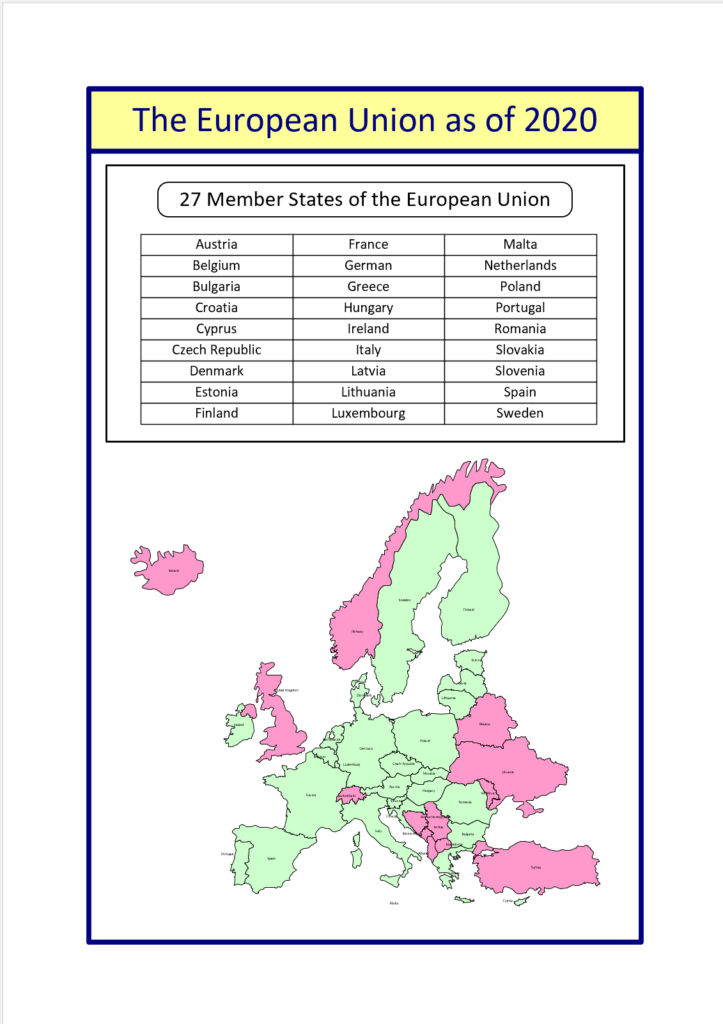
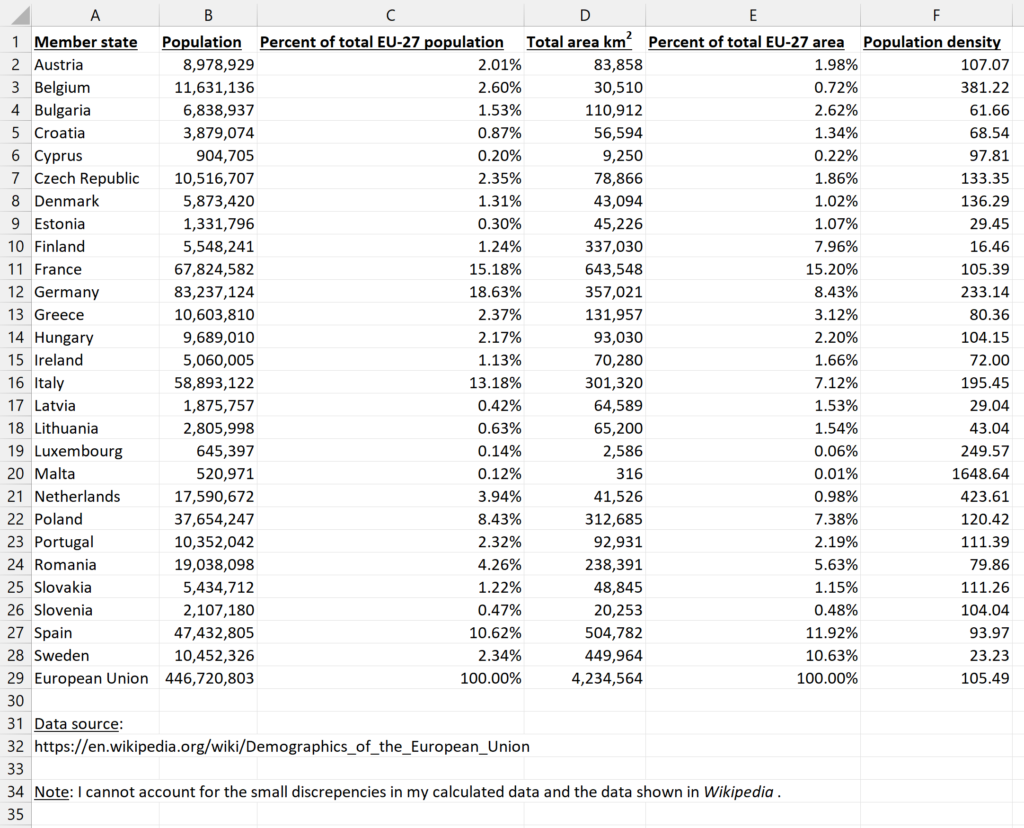
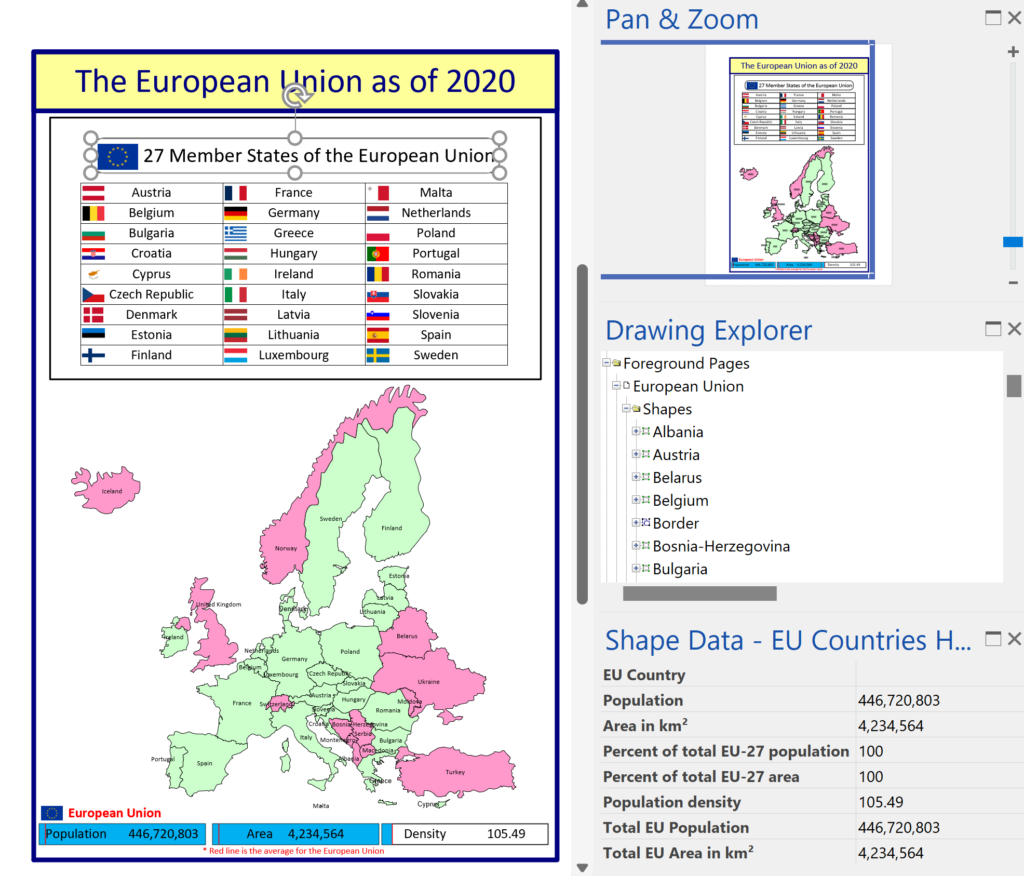
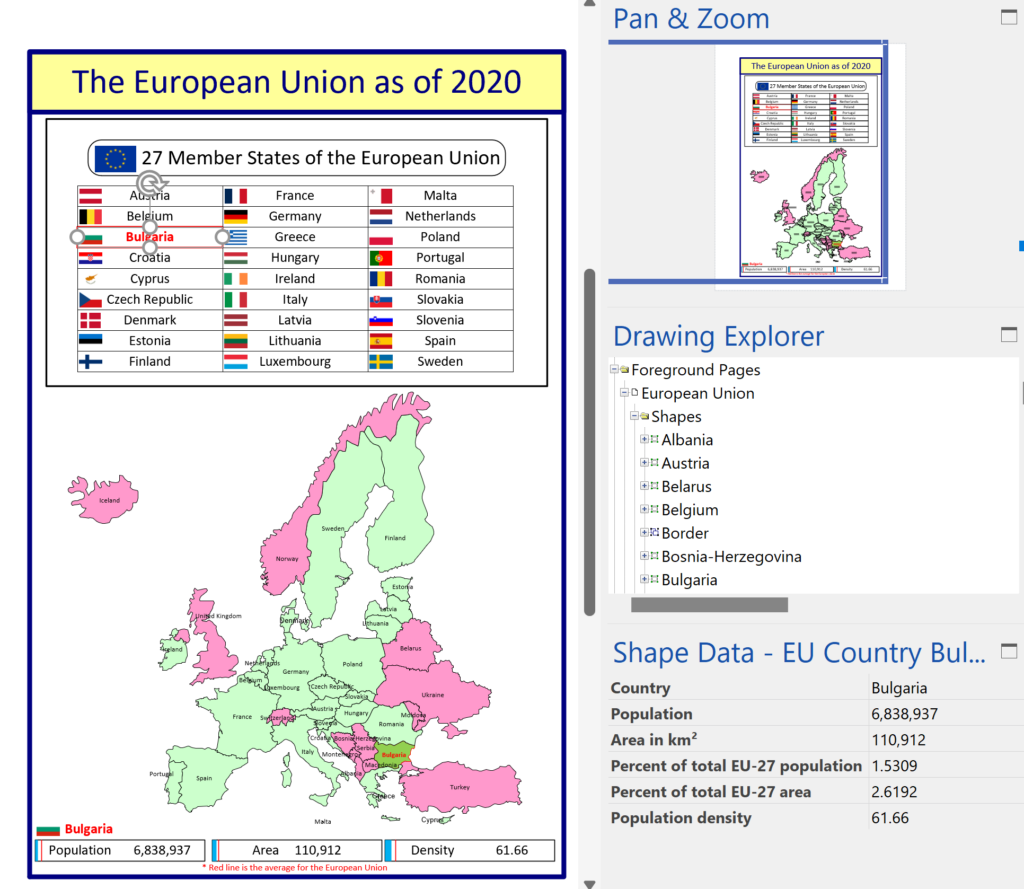
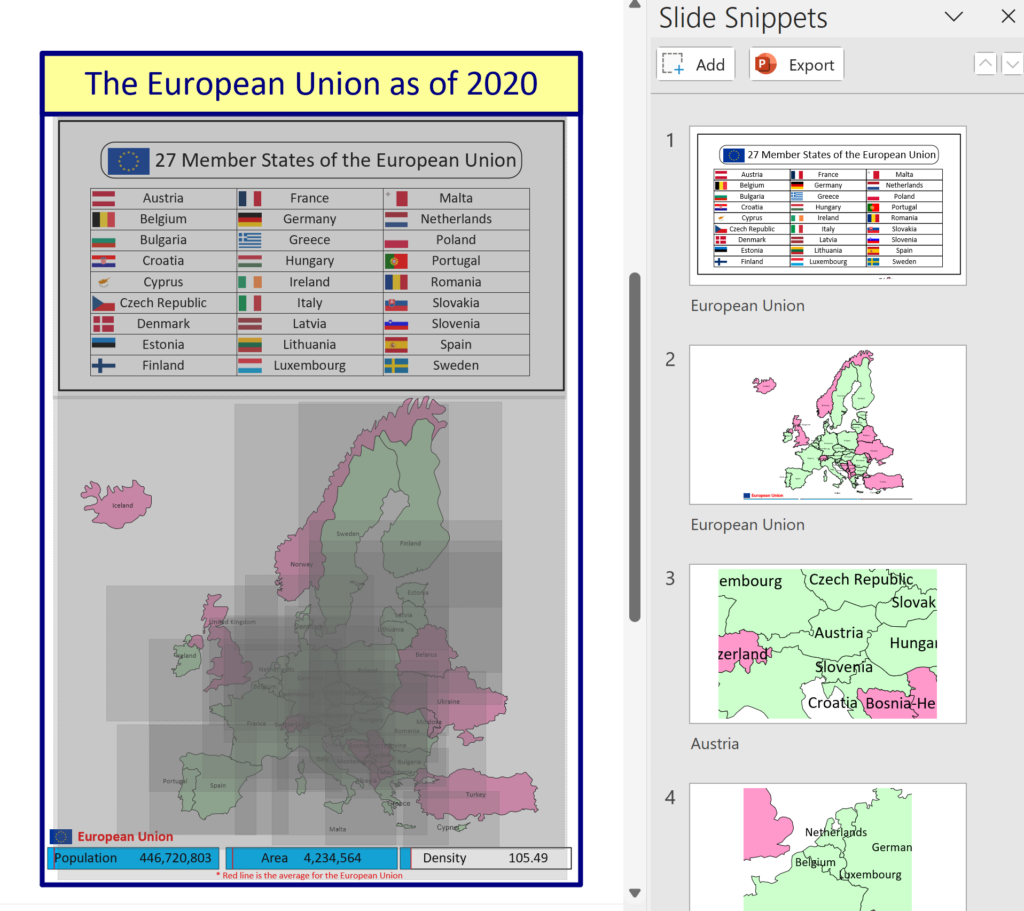
• Skip to main content
  • Skip to primary sidebar
  • Skip to footer

bVisual

  • Home
  • Services
    • How Visio smartness can help your business
    • Visio visual in Power BI
    • Visio Consulting Services
    • Visio Bureau Services
    • Visio Training and Support Services
  • Products
    • Visio Shape Report Converter
    • SS Plus
    • LayerManager
    • visViewer
    • Metro Icons
    • Rules Tools for Visio
    • The Visio 2010 Sessions App
    • Multi-Language Text for Visio
    • Document Imager for Visio
    • multiSelect for Visio
    • pdSelect for Visio
  • Case Studies
    • Case studies overview
    • Visualizing Construction Project Schedules
    • Visio Online Business Process Mapping
    • Nexans Visio Template
    • CNEE Projects, WorldCom
    • Chase Manhattan Bank
  • News
    • Recent news
    • News archive
  • Resources
    • Articles➡
      • ShapeSheet Functions A-Z
      • Comparing Visio for the Web and Desktop
      • Customising Visio Shapes for the Web App
      • Key differences between the Visio desktop and web apps
      • Using the Visio Data Visualizer in Excel
      • Using Visio in Teams
      • Creating Visio Tabs and Apps for Teams with SharePoint Framework (SPFx)
      • Designing Power Automate Flows with Microsoft Visio
      • Innovative uses of Visio Lists
    • Webcasts ➡
      • Visio in Organizations
      • My session and other Visio sessions at MSIgnite 2019
      • Power up your Visio diagrams
      • Vision up your Visio diagrams
      • The Visio 2010 MVP Sessions
    • Visio Web Learning Resources
    • Books➡
      • Mastering Data Visualization with Microsoft Visio
      • Microsoft Visio Business Process Diagramming and Validation
      • Visualizing Information with Microsoft Visio
  • Blog
    • Browse blog articles
    • Visio Power BI articles
    • Visio for Web articles
    • A history of messaging and encryption
  • About us
    • About bVisual
    • Testimonials
    • Bio of David Parker
    • Contact Us
    • Website Privacy Policy
    • Website terms and conditions
    • Ariba Network

Diagram Types

Published on March 25, 2020 by David Parker

Preventing Deletion of Container Members in Visio

The concept of Structured Diagrams was introduced in Visio 2010 and is featured in many of the templates supplied with Microsoft Visio, and in some third-party solutions, like mine. Connectors, callouts, containers and lists are the key parts of a structured diagrams, and there are times when preventing the deletion of members of a container or list is desirable.

  • An example cross-functional flowchart
  • Accidental deletion of a process shape
[Read more…] about Preventing Deletion of Container Members in Visio

Filed Under: Containers, Lists, Process Flows, ShapeSheet Formulas, Visio Tagged With: Containers, Lists, ShapeSheet Functions, Visio

Published on December 31, 2019 by David Parker

Countries of the World in Power BI with Flags

I like Power BI, and the latest update features the ability to set a custom web url onto another column. So, I couldn’t resist trying it in the example below. Notice that the Country or Area values are hyperlinks to the url of the country page in the CIA World Factbook.

[UPDATE Oct 2021: The CIA World Factbook has been updated, and this the flag links are currently broken]

[Read more…] about Countries of the World in Power BI with Flags

Filed Under: Geographic, mFormula, PowerBI Tagged With: Flag, PowerBI

Published on December 5, 2019 by David Parker

Using Visio Org Chart Wizard to work with Exchange Online

I have used the Microsoft Visio Organization Chart Wizard many, many times over the years, but I usually use it from text files, and I had been aware that I was not getting good results from the Microsoft Exchange Server directory option, now that I use Office 365. I was always getting just the first Personnel record (Admin). Well, I was prompted to find out why, and was amazed to find the answer by Winnie Liang in Creating Organizational Chart from AD Information.

[Read more…] about Using Visio Org Chart Wizard to work with Exchange Online

Filed Under: Org Charts, Visio for Desktop Tagged With: Org Chart

Published on November 10, 2019 by David Parker

Visio news from MS Ignite 2019

Daniel, Scott, me and Michel at the Veeam party

Microsoft Ignite 2019 at the huge Orange County Conference Conference Center in Orlando is over for another year. 30,000 attendees over 6 days, and I have seen my first sunlight today since I arrived in Florida last Saturday! So, it is time to review just what was announced about Visio, and how much Visio is appreciated.

[Read more…] about Visio news from MS Ignite 2019

Filed Under: Data Visualizer, Floor Plans, MSFlow, MSIgnite, Org Charts, PowerBI, Process Flows, Teams, Visio, Visio for Desktop, Visio for Web Tagged With: Data Visualizer, MSIgnite, Org Chart, Processes

Published on October 25, 2019 by David Parker

Clarity Videos Re-boot

I am upgrading this website at the moment, and I came across on old post of mine about a new video series that Microsoft launched in 2009 … yes, 10 years ago! So, I thought I wouldre-boot the series for all our enjoyment … and because almost all of the features are still present, with a new look, and some new features!

Clarity ep. 1: Create an Office Layout diagram using Visio

[Read more…] about Clarity Videos Re-boot

Filed Under: Floor Plans, Network Diagrams, Org Charts, Process Flows, Visio, Visio for Desktop Tagged With: Video, Visio, Visio 2007

Published on June 21, 2019 by David Parker

Triggering Shape Mouse Enter and Leave JavaScript events in Visio Online

I am working on a project where Visio Online process diagrams are embedded within a SharePoint web page, and was surprised that the JavaScript onShapeMouseEnter() event was not being triggered as the mouse cursor moved over some of my shapes. After much searching by myself, and my colleague Seb Craft, we found that only the sub-shapes in the group were firing the event … So what was the problem?

[Read more…] about Triggering Shape Mouse Enter and Leave JavaScript events in Visio Online

Filed Under: JavaScript, Office 365, Process Flows, ShapeSheet Formulas, SharePoint, SOP Web Pages, Visio, Visio for Web, Visio Online Tagged With: JavaScript, ShapeSheet

  • « Go to Previous Page
  • Go to page 1
  • Go to page 2
  • Go to page 3
  • Go to page 4
  • Interim pages omitted …
  • Go to page 8
  • Go to Next Page »

Primary Sidebar

  • LinkedIn
  • Twitter

Recent Posts

  • Update to LayerManager add-in for non-English users
  • Pushing Data Visualizer in Visio beyond its limits
  • Pushing Data Visualizer in Visio to the limits!
  • Teams Tuesday Podcast Recording about Visio
  • Linking Data to Visio Shapes in Code

Categories

Tags

Accessibility Add-Ins Connectors Containers Data Export Data Graphics Data Import Data Visualizer Educational Excel GraphDatabase Hyperlinks Icon Sets JavaScript Layers Legend Link Data to Shapes Lists MSIgnite MVP Office365 Org Chart PowerApps PowerBI PowerQuery Processes Shape Data Shape Design ShapeSheet ShapeSheet Functions SharePoint 2013 SQL Teams Themes Validation VBA Video Visio Visio 2007 Visio 2013 Visio for the Web Visio Online Visio Services Visio Viewer Webinar

Footer

bVisual Profile

The UK-based independent Visio consultancy with a worldwide reach. We have over 25 years experience of providing data visualization solutions to companies around the globe.

Learn more about bVisual

  • LinkedIn
  • Twitter

Search this website

Recent posts

  • Update to LayerManager add-in for non-English users
  • Pushing Data Visualizer in Visio beyond its limits
  • Pushing Data Visualizer in Visio to the limits!
  • Teams Tuesday Podcast Recording about Visio
  • Linking Data to Visio Shapes in Code

Copyright © 2023 · Executive Pro on Genesis Framework · WordPress · Log in