Most of the smartness of Visio comes from the power of the ShapeSheet. Every shape in Visio, even if it is just text, has a ShapeSheet that most users do not see. In fact, a lot of users do not realise that there is a Developer ribbon tab that is not visible by default.
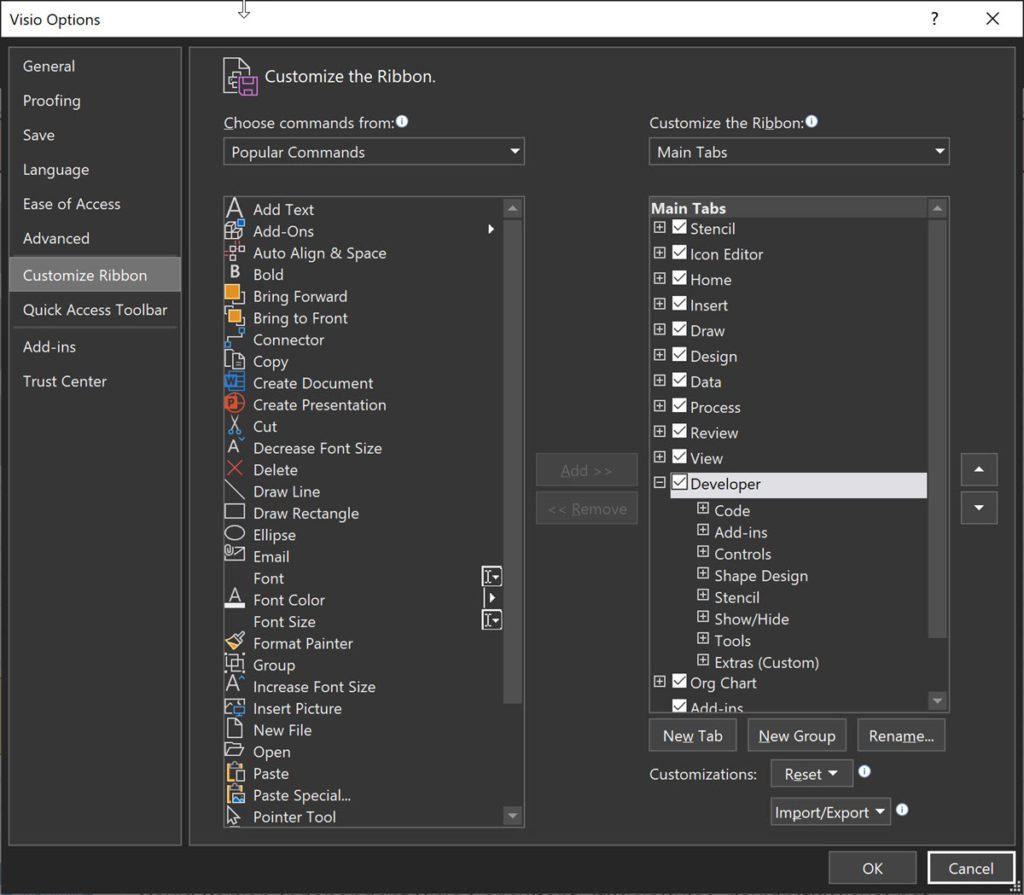
It can be made visible by ticking it in the Developer tab in the Visio Options / Customize Ribbon dialog. This can be opened from File / Options, or by using the Customize the Ribbon… right-mouse menu option in a blank area of the ribbon.
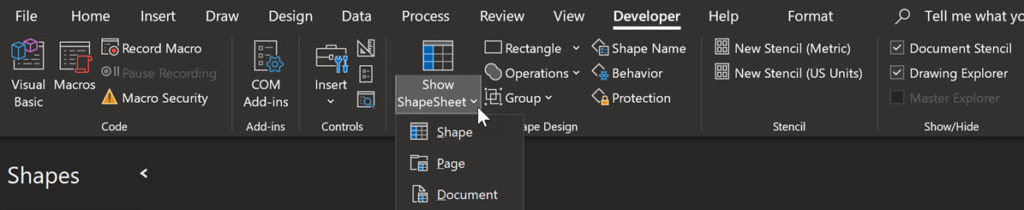
The Show ShapeSheet drop-down button in the Developer ribbon tab will open the ShapeSheet of the selected shape, active page or active document.
The ShapeSheet is divided into Sections, Rows and Cells. Some of the Sections always exist in a shape of a particular type (this also includes pages and documents), whilst others are optional. The rows in some of these optional sections can be renamed for clarity, if required. For example, the default name for the first row in the User-defined Cells section is Row_1, but it can be renamed, just like ShapeAppearance in the following image of the ShapeSheet of an Off-page reference shape from the Basic Flowchart Shapes stencil.
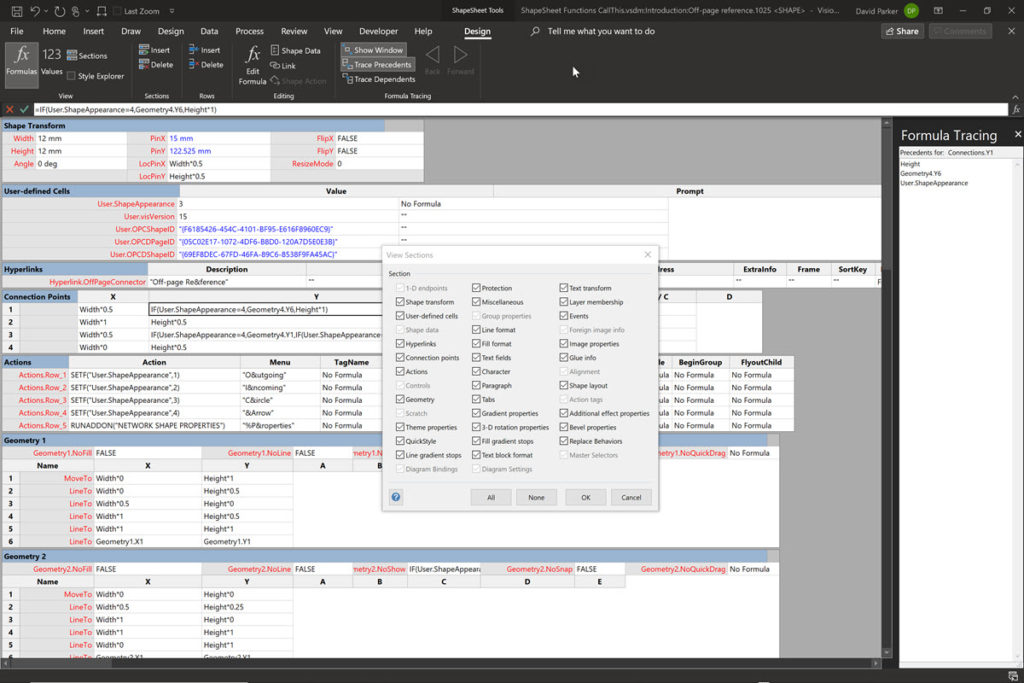
Notice that the ShapeSheet can display either the Formulas or the Values, and that not all of the Sections need to be visible, and individual sections can be expanded or collapsed. The ShapeSheet contains many sections, so it is usually necessary to scroll.
Each of the cells can be referenced by name within formulas in other cells. They can also be referenced by their Section, Row, Cell indices in code using the CellsSRC[…] property. However, this reference is all about formulas using the functions available in the ShapeSheet. There are currently 210 functions listed in the Microsoft Docs, but some of them do not have an example, or they are difficult to follow without a visual the examples. Most of the functions work perfectly within Visio for the Web, just as they do in Visio for the Desktop. There are some exceptions to this, and one in particular, CALLTHIS(), is unlikely to ever work in the web because it is used to run code within a Visual Basic project.
Over the next few months, each of the functions will be described more visually, and there will be similarity in the way that each page in the document demonstrates the function.
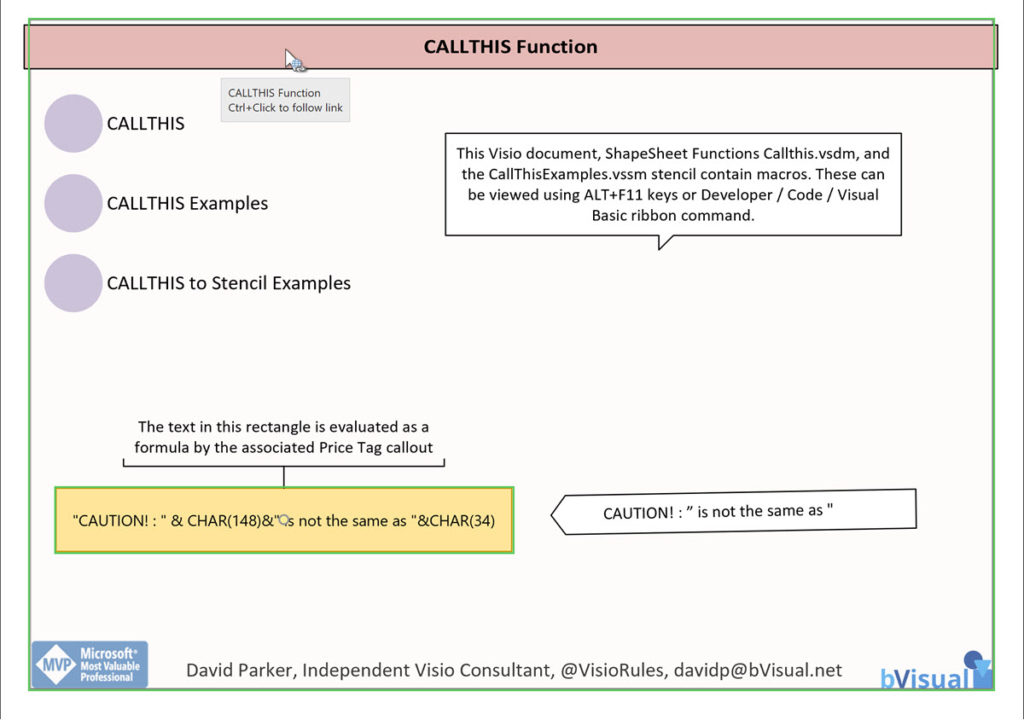
The border is a Visio container shape and contains a hyperlink to the Microsoft Docs for the specified function, and the ScreenTip is displayed in the associated Word Box callout.
The mauve circles are Off-page reference shapes that provide hyperlinks to specific pages within the Visio document.
The text of the coloured rectangle is evaluated as a Visio ShapeSheet formula by the associated Price Tag callout (using the EVALTEXT() function).
A second callout sometimes suggests how the target shape can be edited to demonstrate the ShapeSheet function. And another callout may display the value in another cell, such as the Angle in the following example,
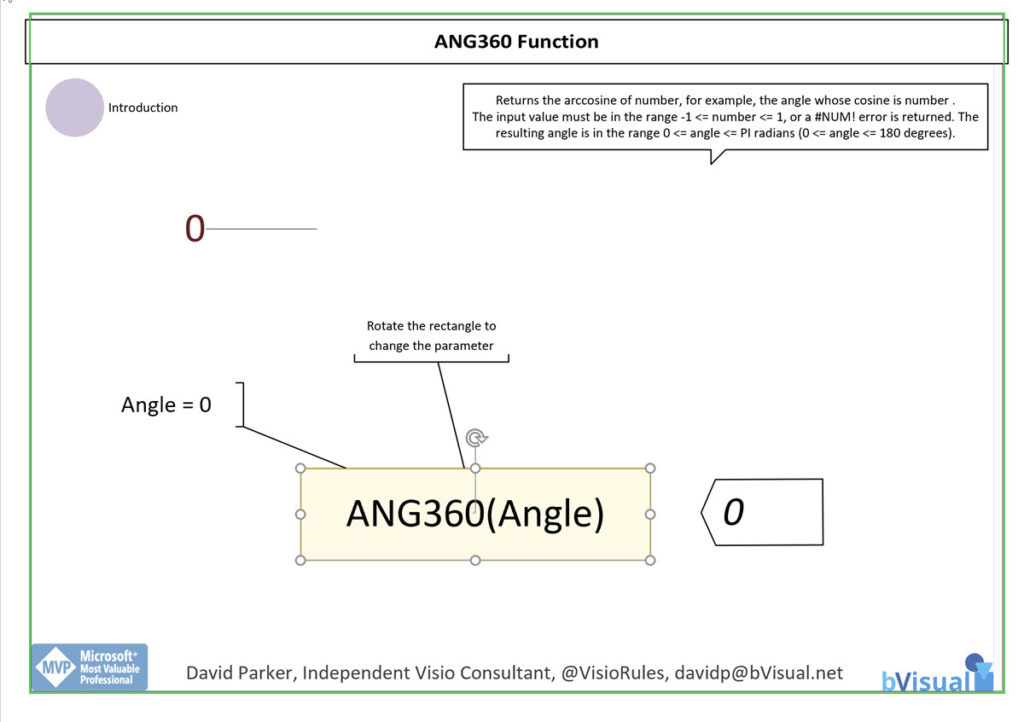
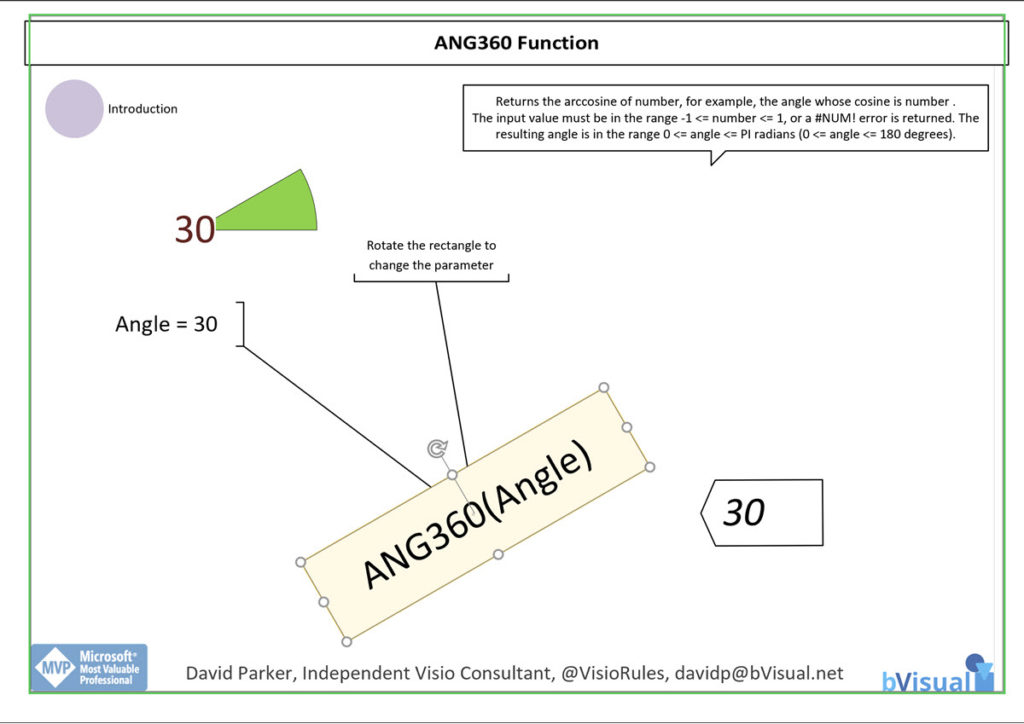
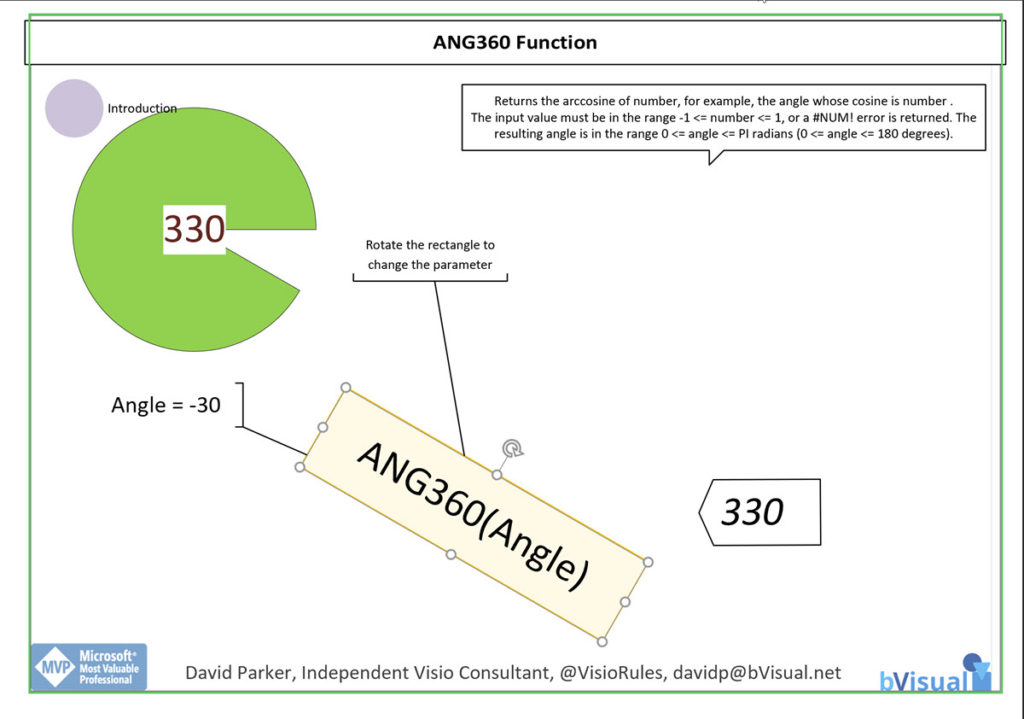
There may be other shapes, such as the green part-filled circle above, that may further demonstrate the output of the function.
Most of these callout shapes make use of the CALLOUTREFTARGET() function. This is another example of the Structured Diagram concept in Visio, eg Containers, Lists, Callouts and Connectors.
Although the documents are viewable from my OneDriveForBusiness folder, they will need to be downloaded and placed into your ODfB or SharePoint tenant for them to be editable in the web.
You may get a warning dialog when switching from one page to another in the web, but it can be safely refreshed.
The articles will appear in the list and grid below, along with other related topics, so subscribe, or keep a look out for new ones.
- Visio ShapeSheet Functions A-C
- Using the CALLTHIS function in Visio
- Visio ShapeSheet Functions D-F
- Visio ShapeSheet Functions G-K
- Visio ShapeSheet Functions L-N
- Visio ShapeSheet Functions O-R
- Visio ShapeSheet Functions S
- Visio ShapeSheet Functions T – Z

Creating Boolean Context Menus in Visio
Over the many, many years that I have been creating Microsoft Visio solutions, I have had to create numerous right-mouse context menus for shapes to control their Shape Data values. Over that time, patterns emerge, so this article is highlighting three different appearances for simple Boolean values, otherwise known as True/False or Yes/No values, and…
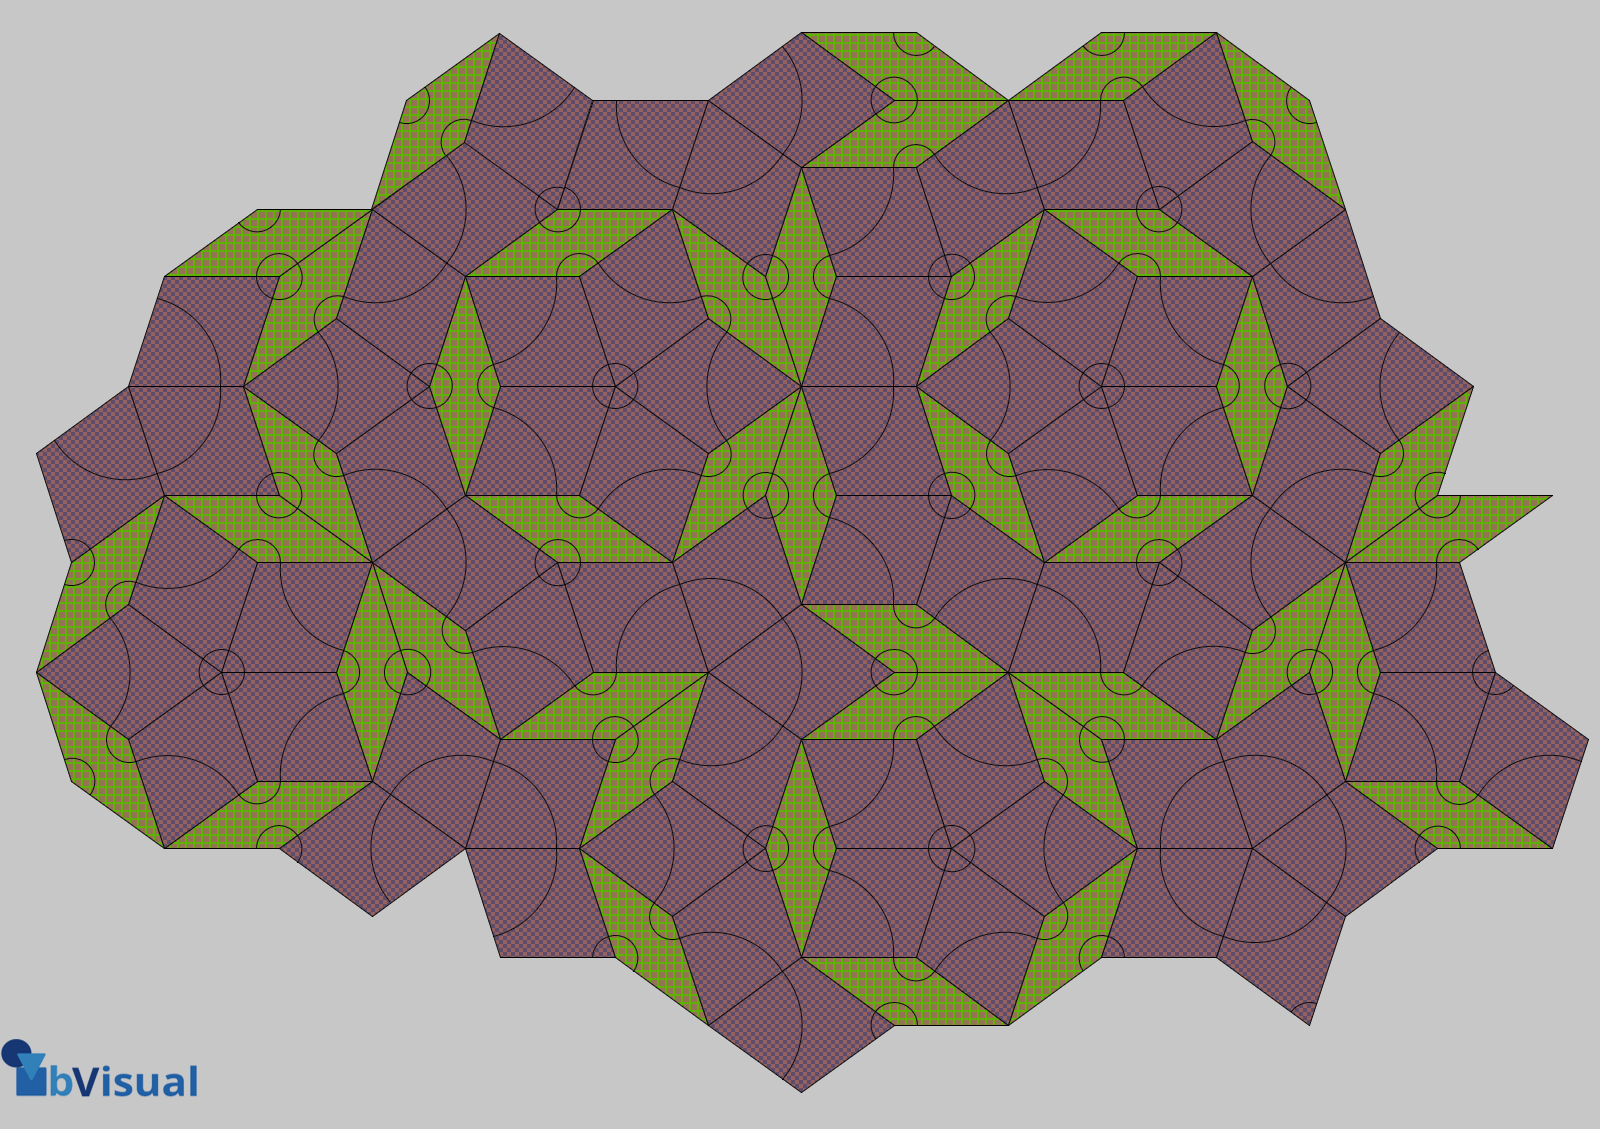
A visual exploration of Penrose Tiling in Visio
Maybe it is because I used to be a building architect, but I have always been fascinated by the relationship between numbers and visualisations. Perhaps the most famous one is the Golden Ratio which has been used as the basis of many building designs and art pieces. It is often recognised to create a harmony…
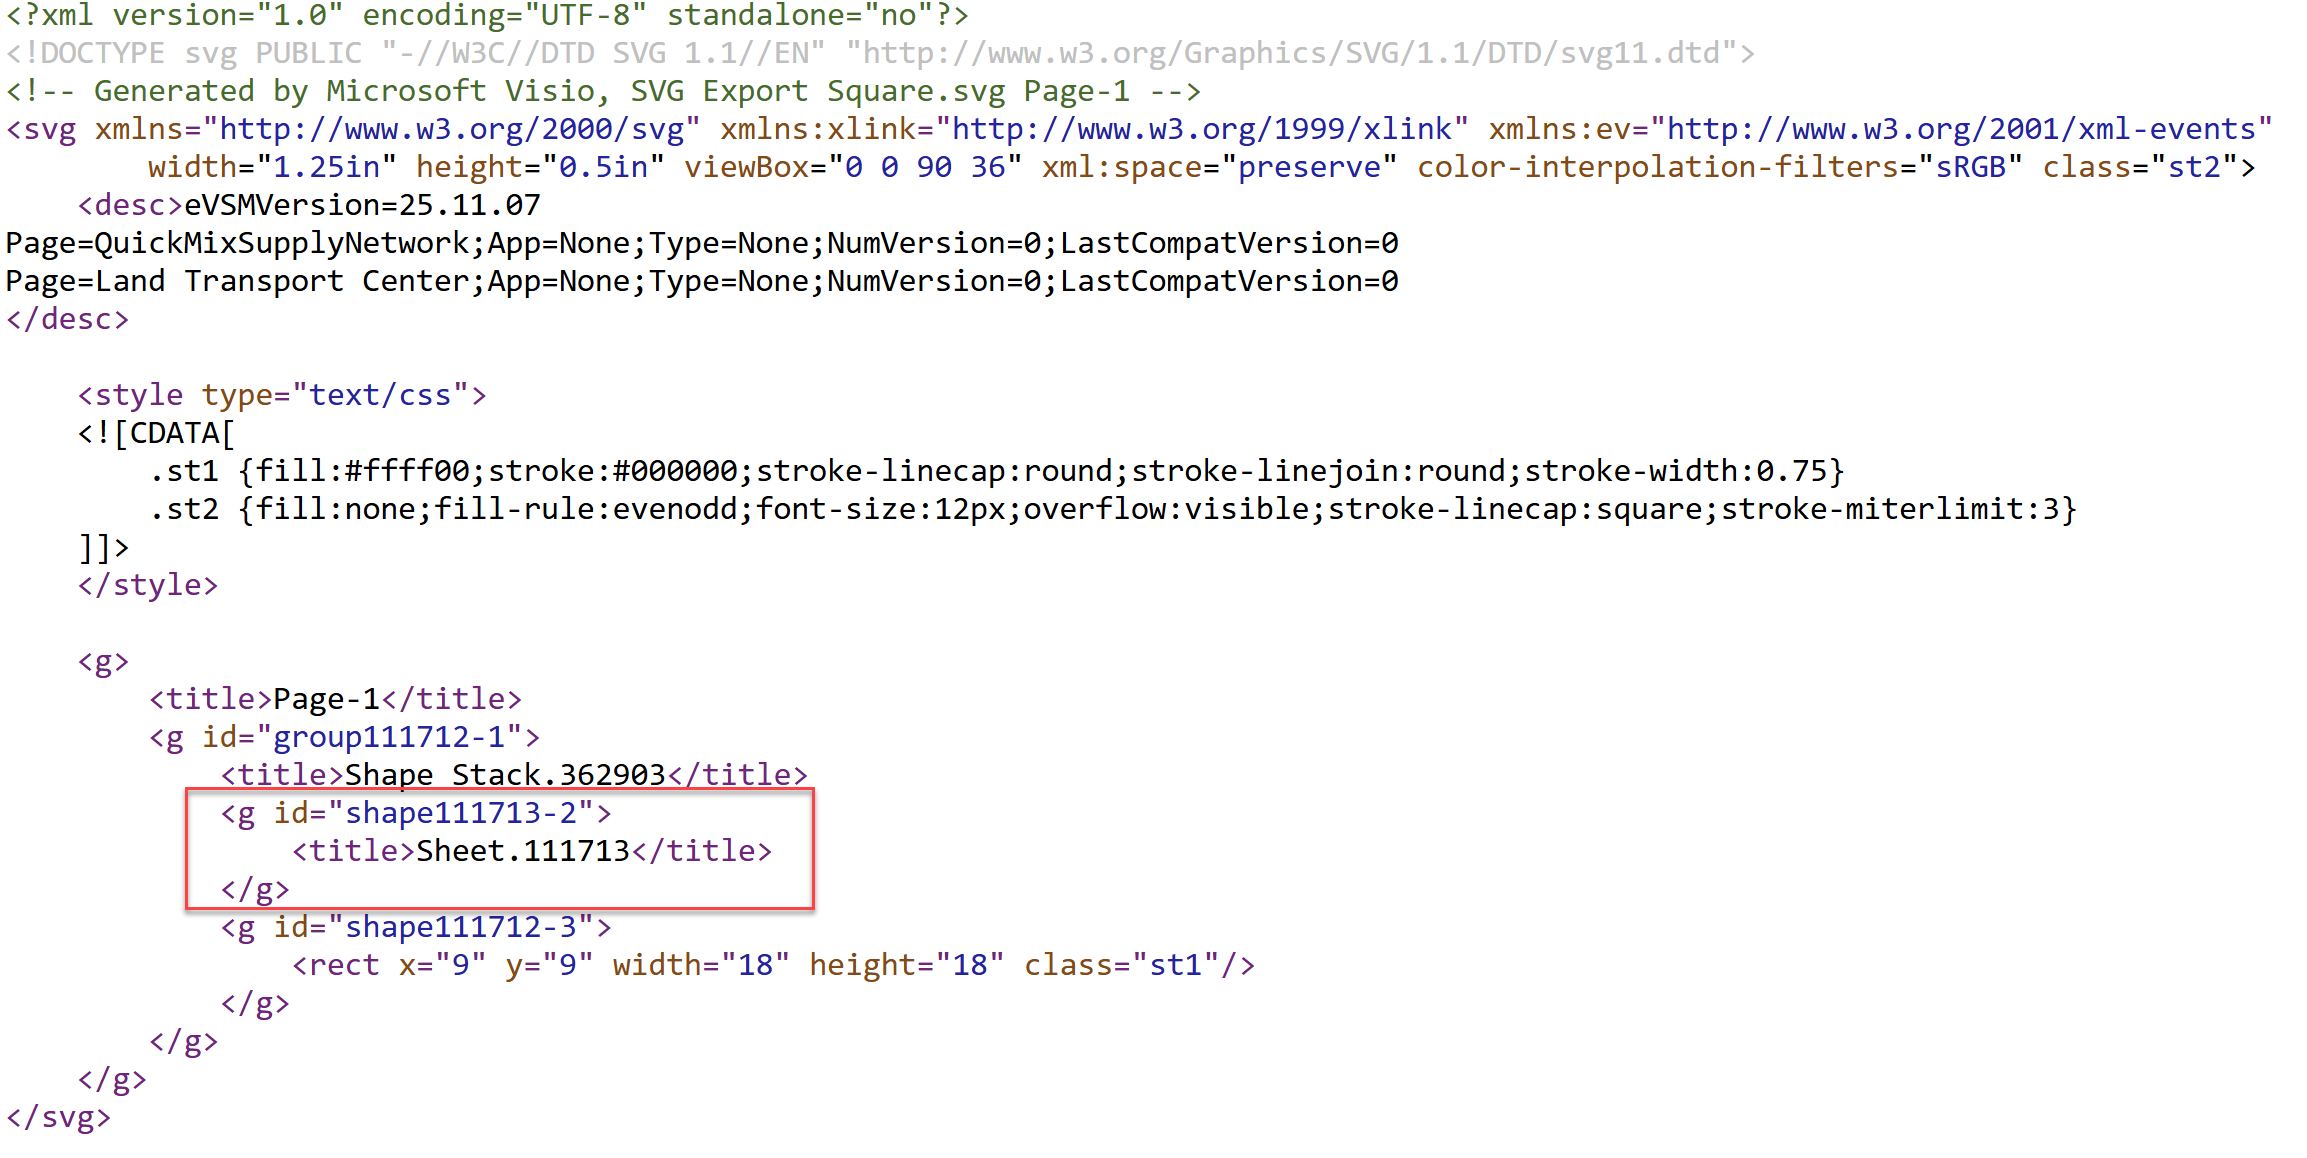
How SVG in Visio can cause a Shape.BoundingBox(…) error
I have used Visio’s Shape.BoundingBox(…) for many, many years and I cannot ever recall it failing, but I have now managed to create some shapes that cause it to error. This caused many hours of confusion, so I nearly abandoned using the method, until I discussed it with my fellow Visio MVP, John Goldsmith (see…

Jumping between Shapes in Visio
Many Visio diagrams get quite large, and sometimes it is useful to provide the ability to jump to another shape quickly in the same document, either on a different page or on the same one. Although there is an add-on provided in desktop Visio that is used by the Off-Page Reference shape provided in the…
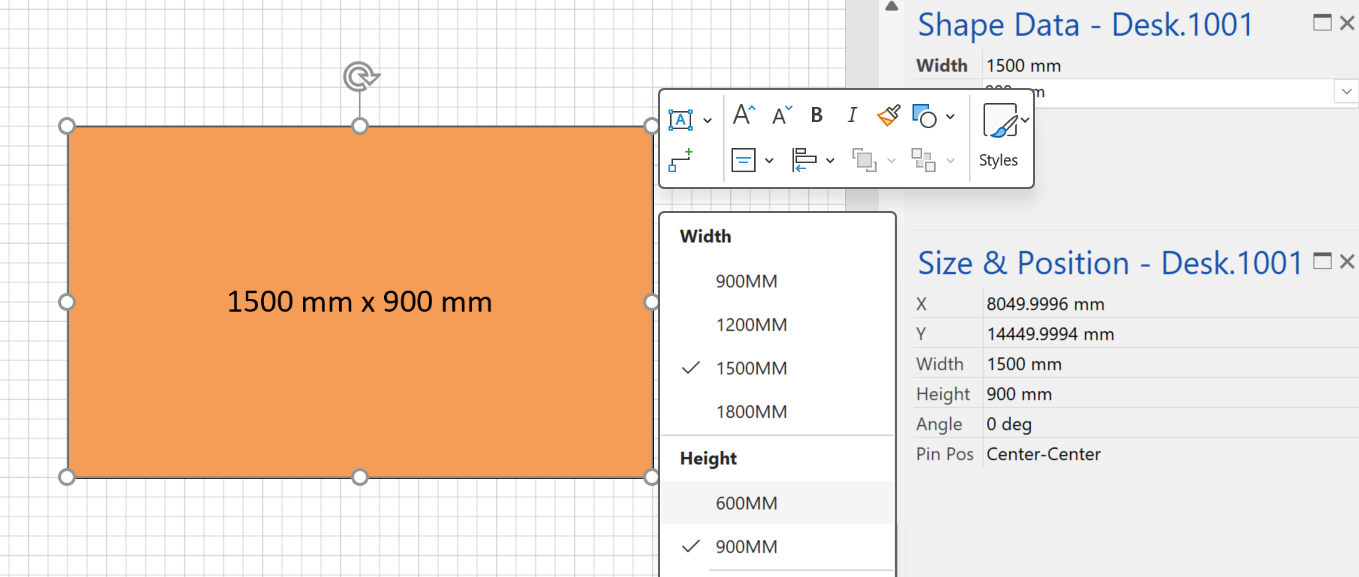
Fixing dimensions of 2D shapes
I am often asked what makes Visio unique and makes it stand out from the crowd, especially in today’s online world. Well, I think there are many reasons, but one of them is the ability to create scaled drawings with parametric components of specific dimensions. This was crucial for my adoption of Visio back in…
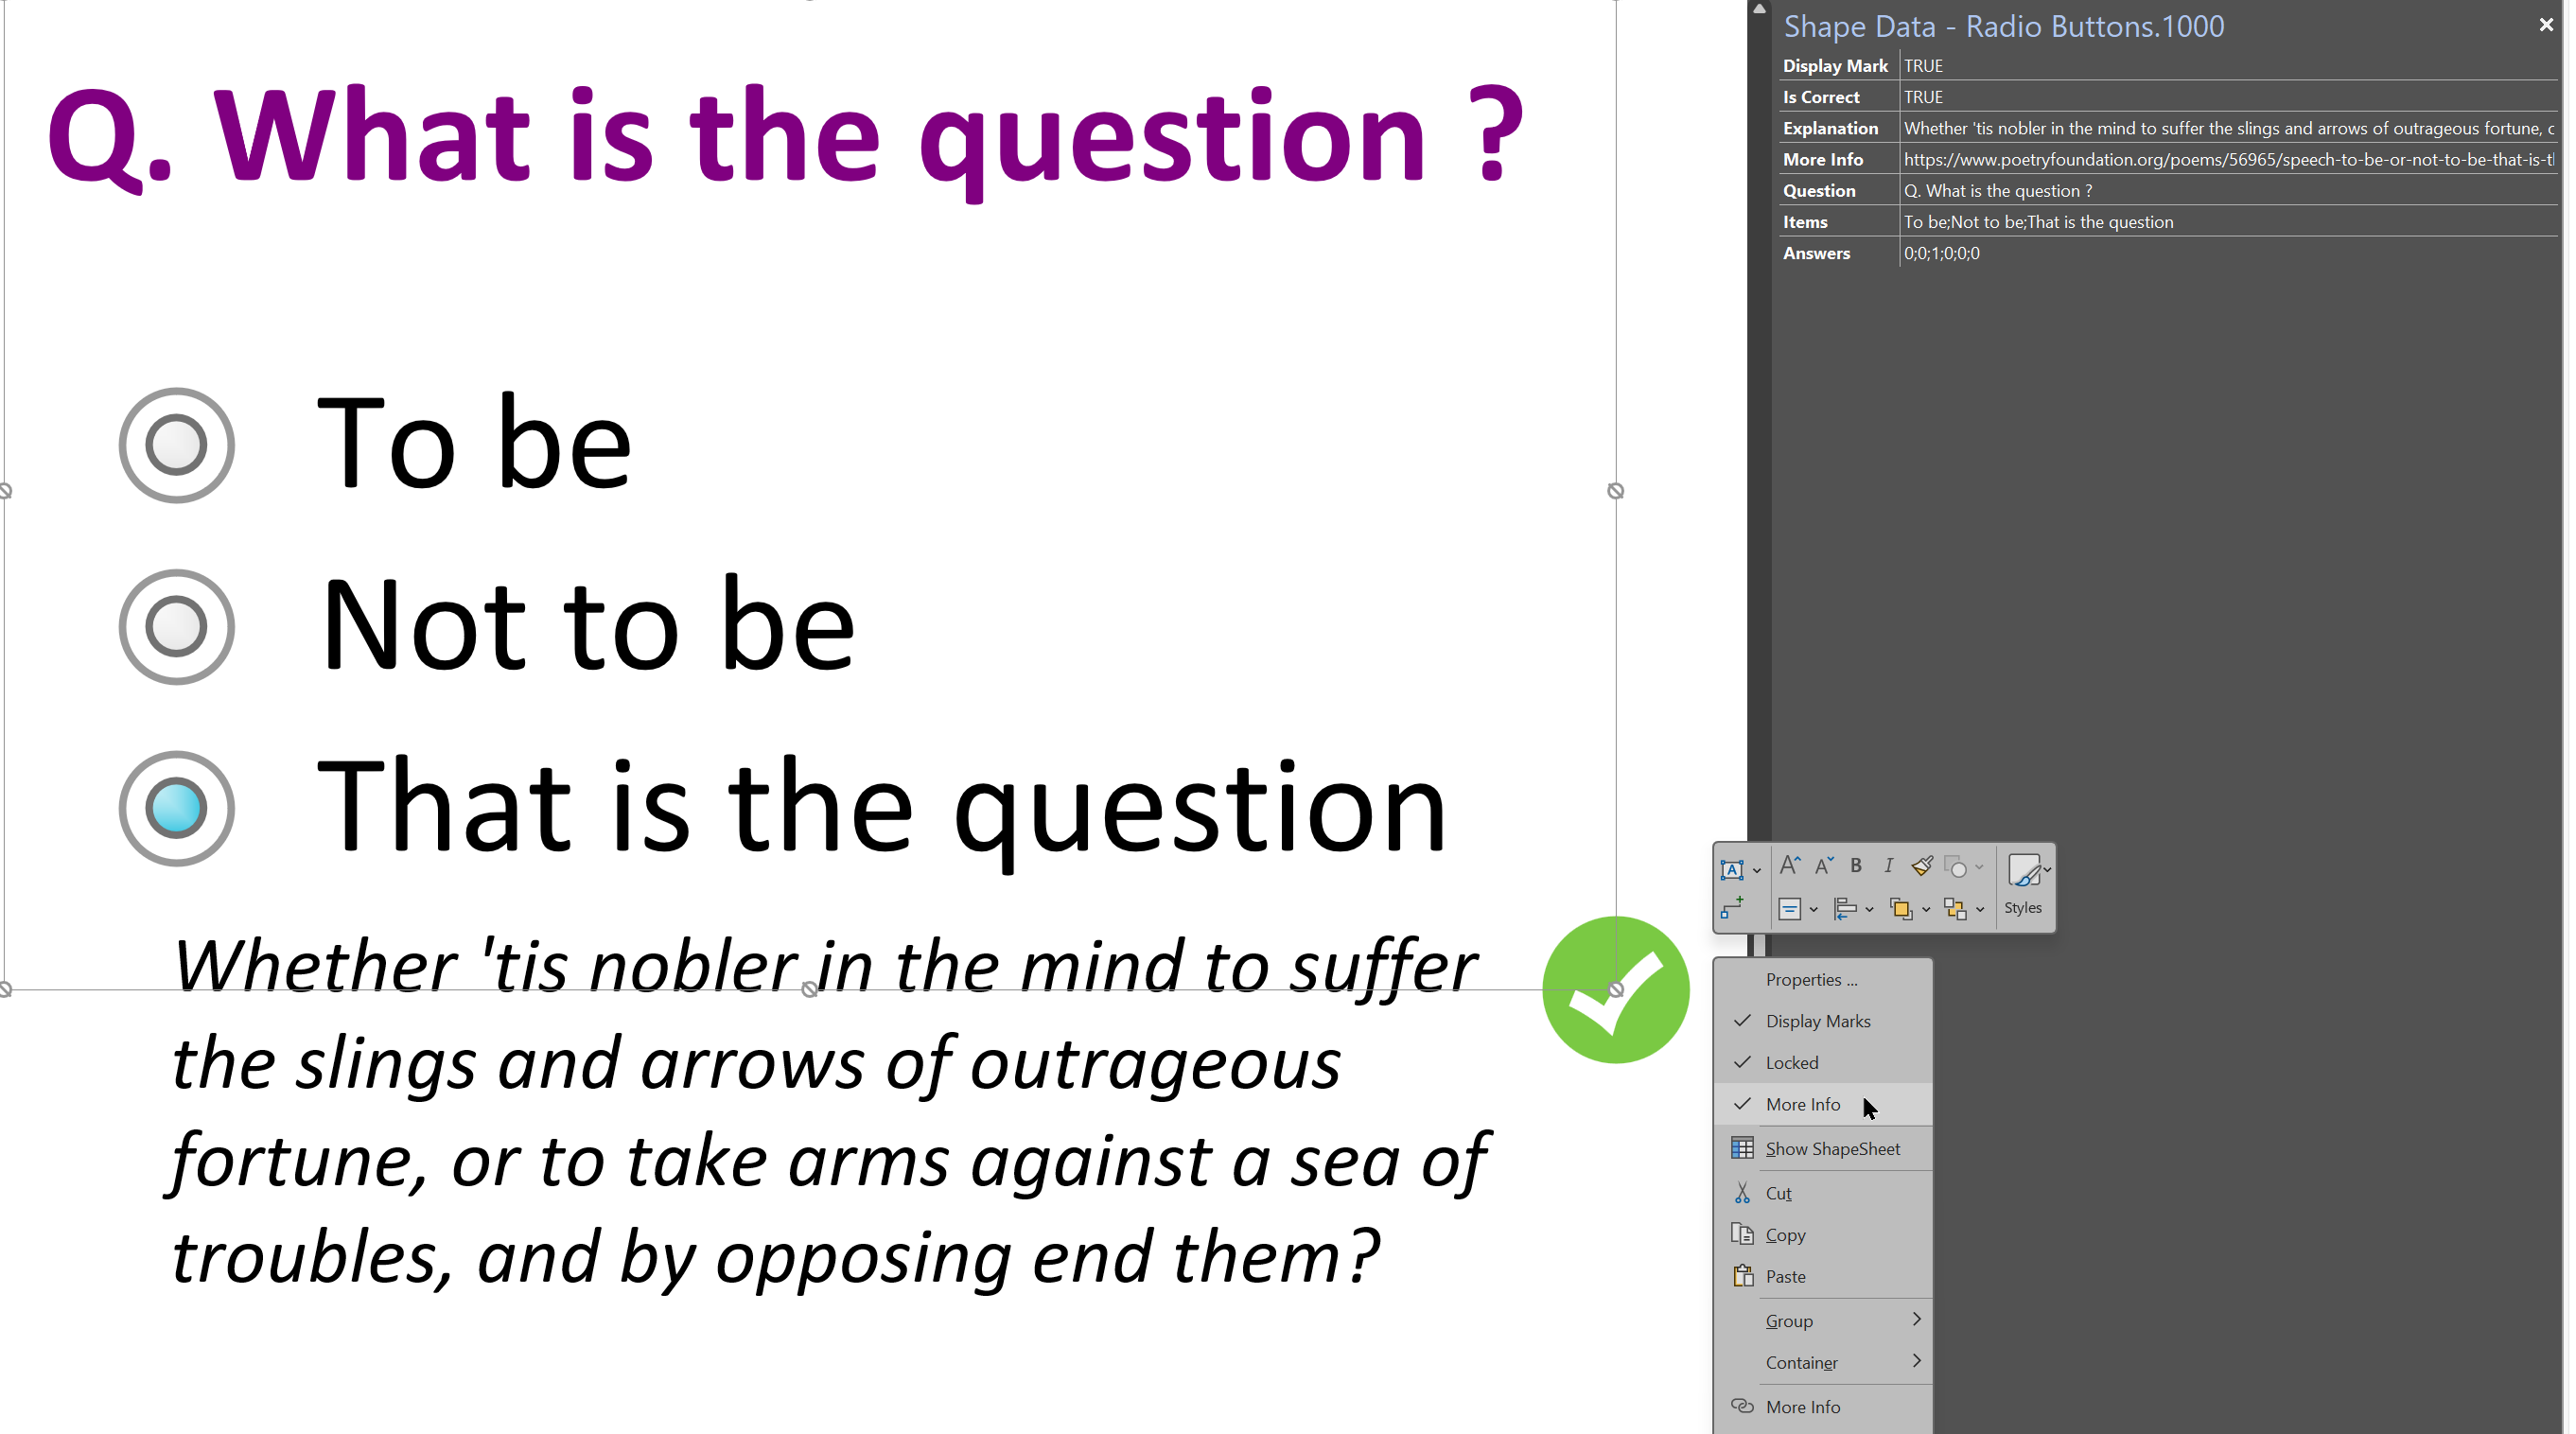
Smart Radio Buttons and Check Boxes in Visio
A recent project requires an interactive tutorial within Microsoft Visio desktop where a lot of the questions need a single answer using radio buttons, or multiple-choice answers using check boxes. I thought that this would be a great use of the list containers capability because the questions and answers could be part of the container…