• Skip to main content
  • Skip to primary sidebar
  • Skip to footer

bVisual

  • Home
  • Services
    • How Visio smartness can help your business
    • Visio visual in Power BI
    • Visio Consulting Services
    • Visio Bureau Services
    • Visio Training and Support Services
  • Products
    • LayerManager
    • visViewer
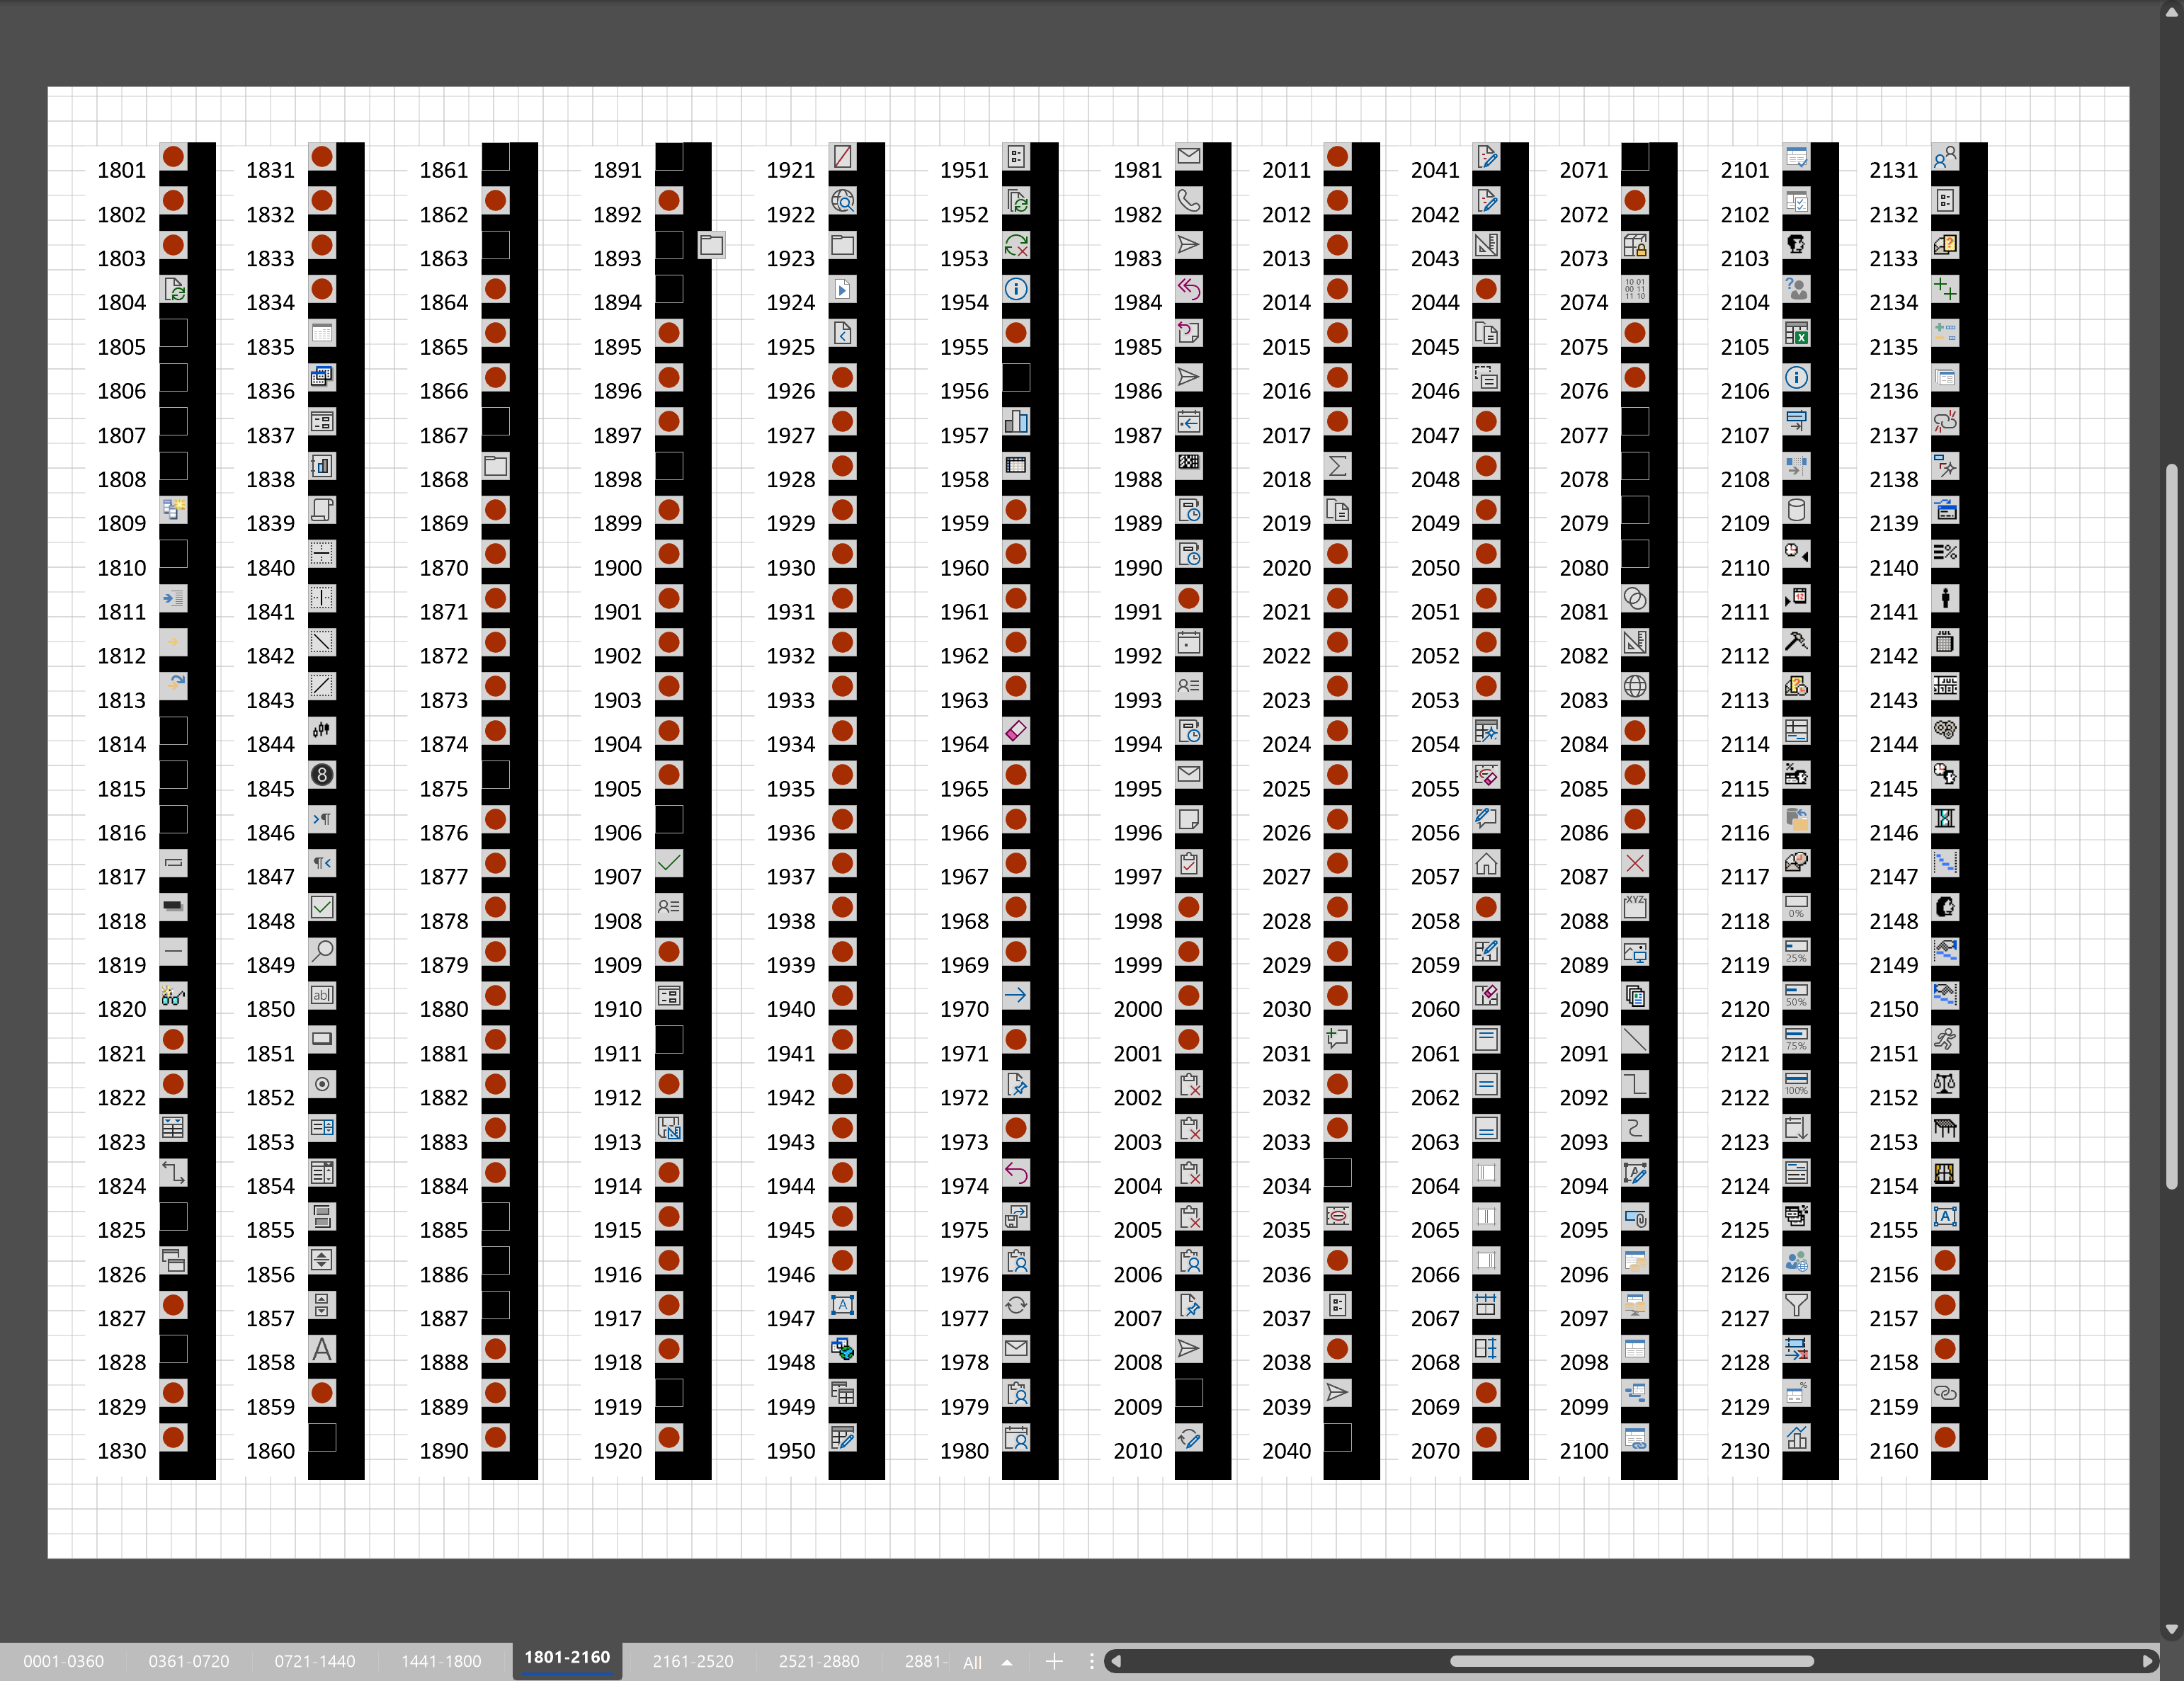
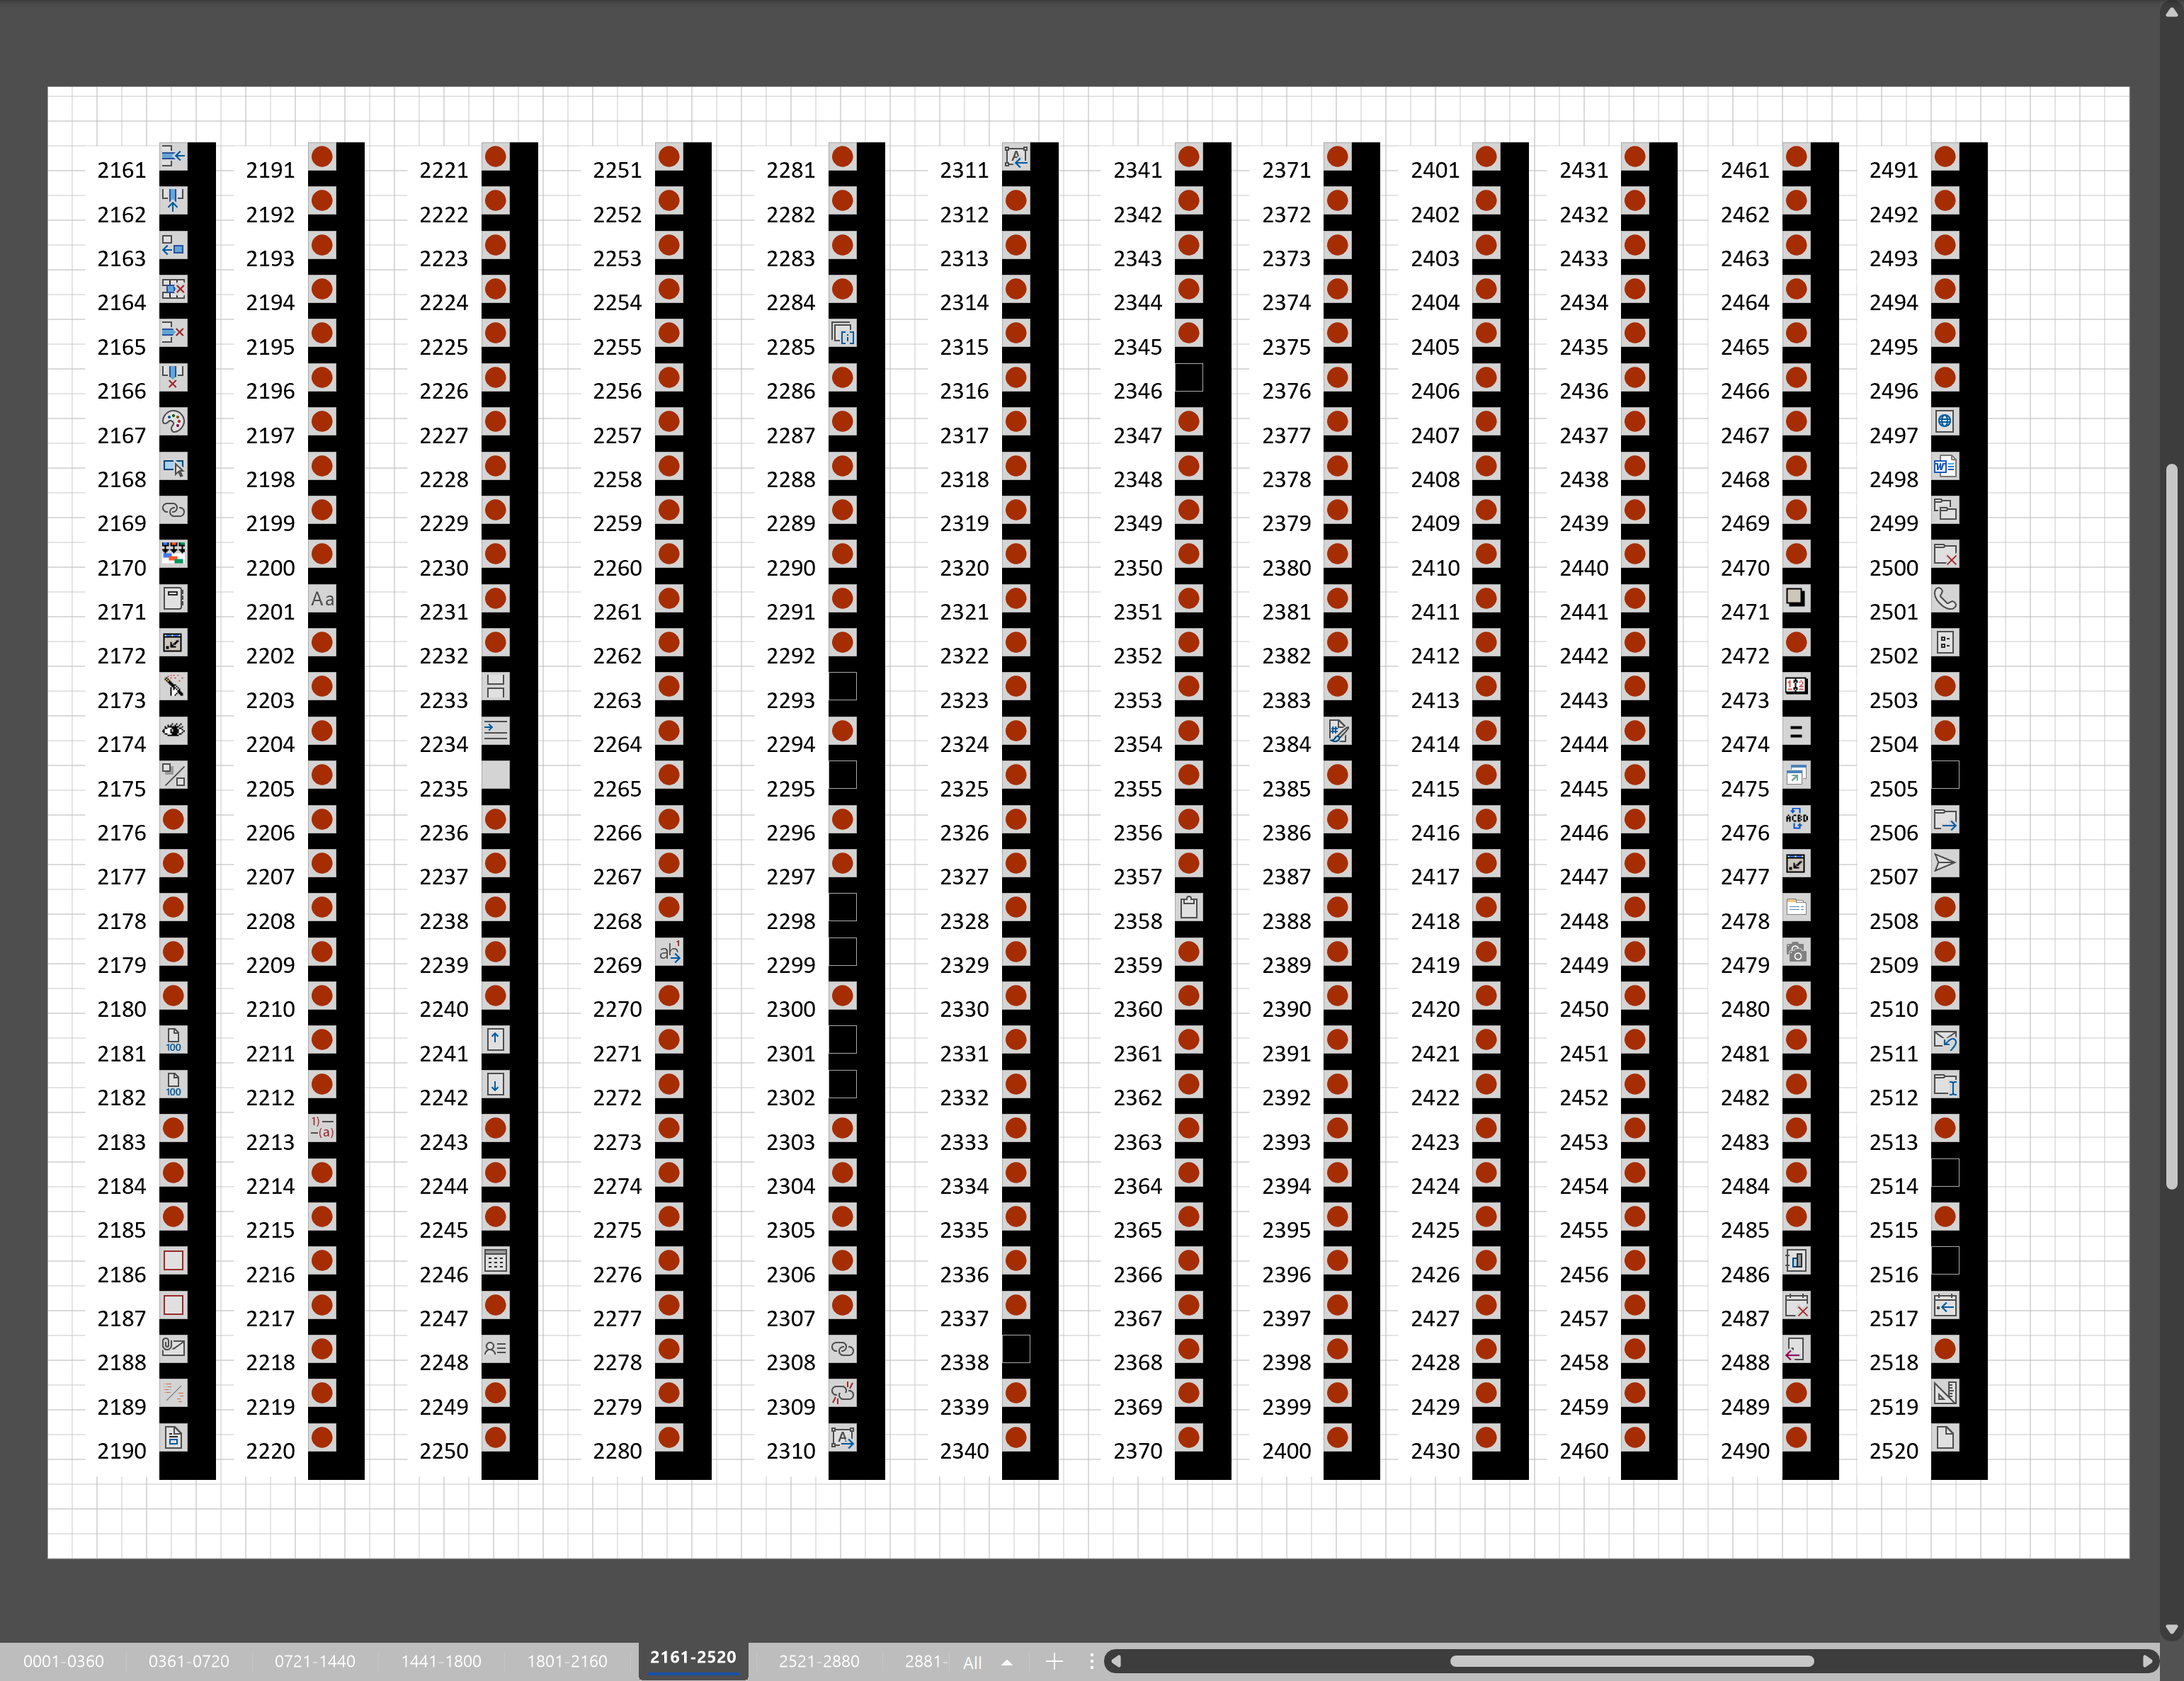
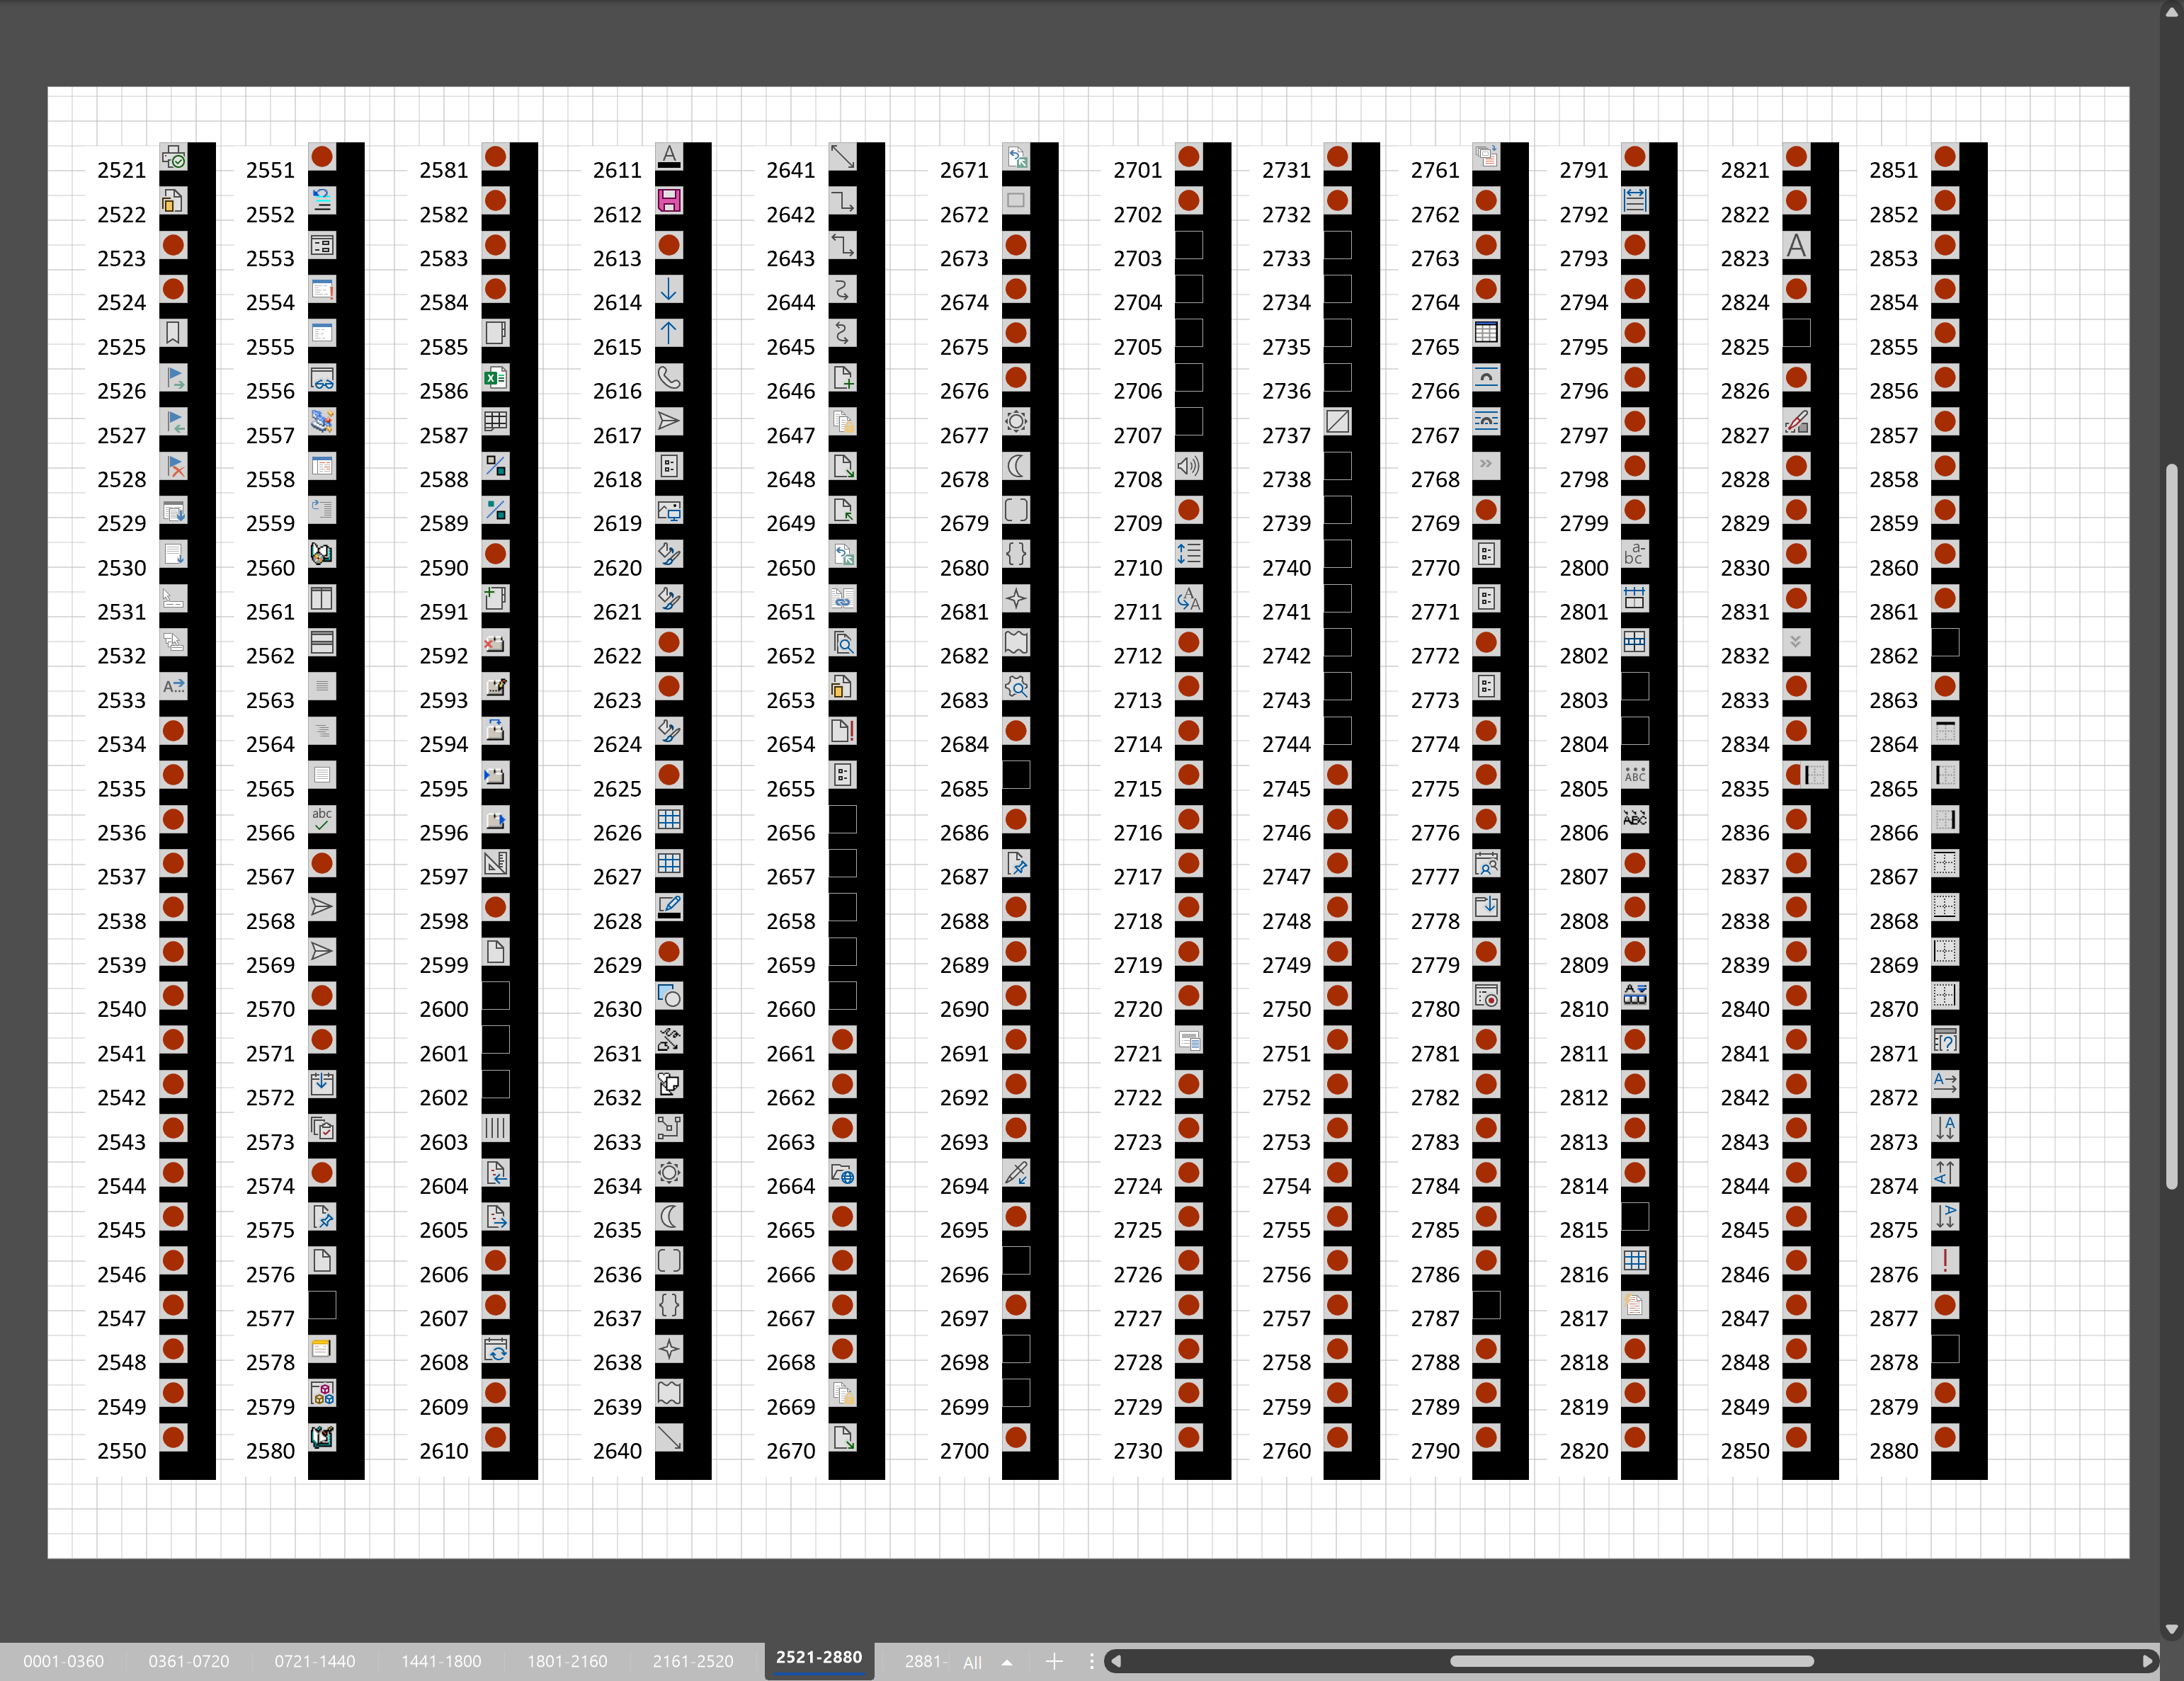
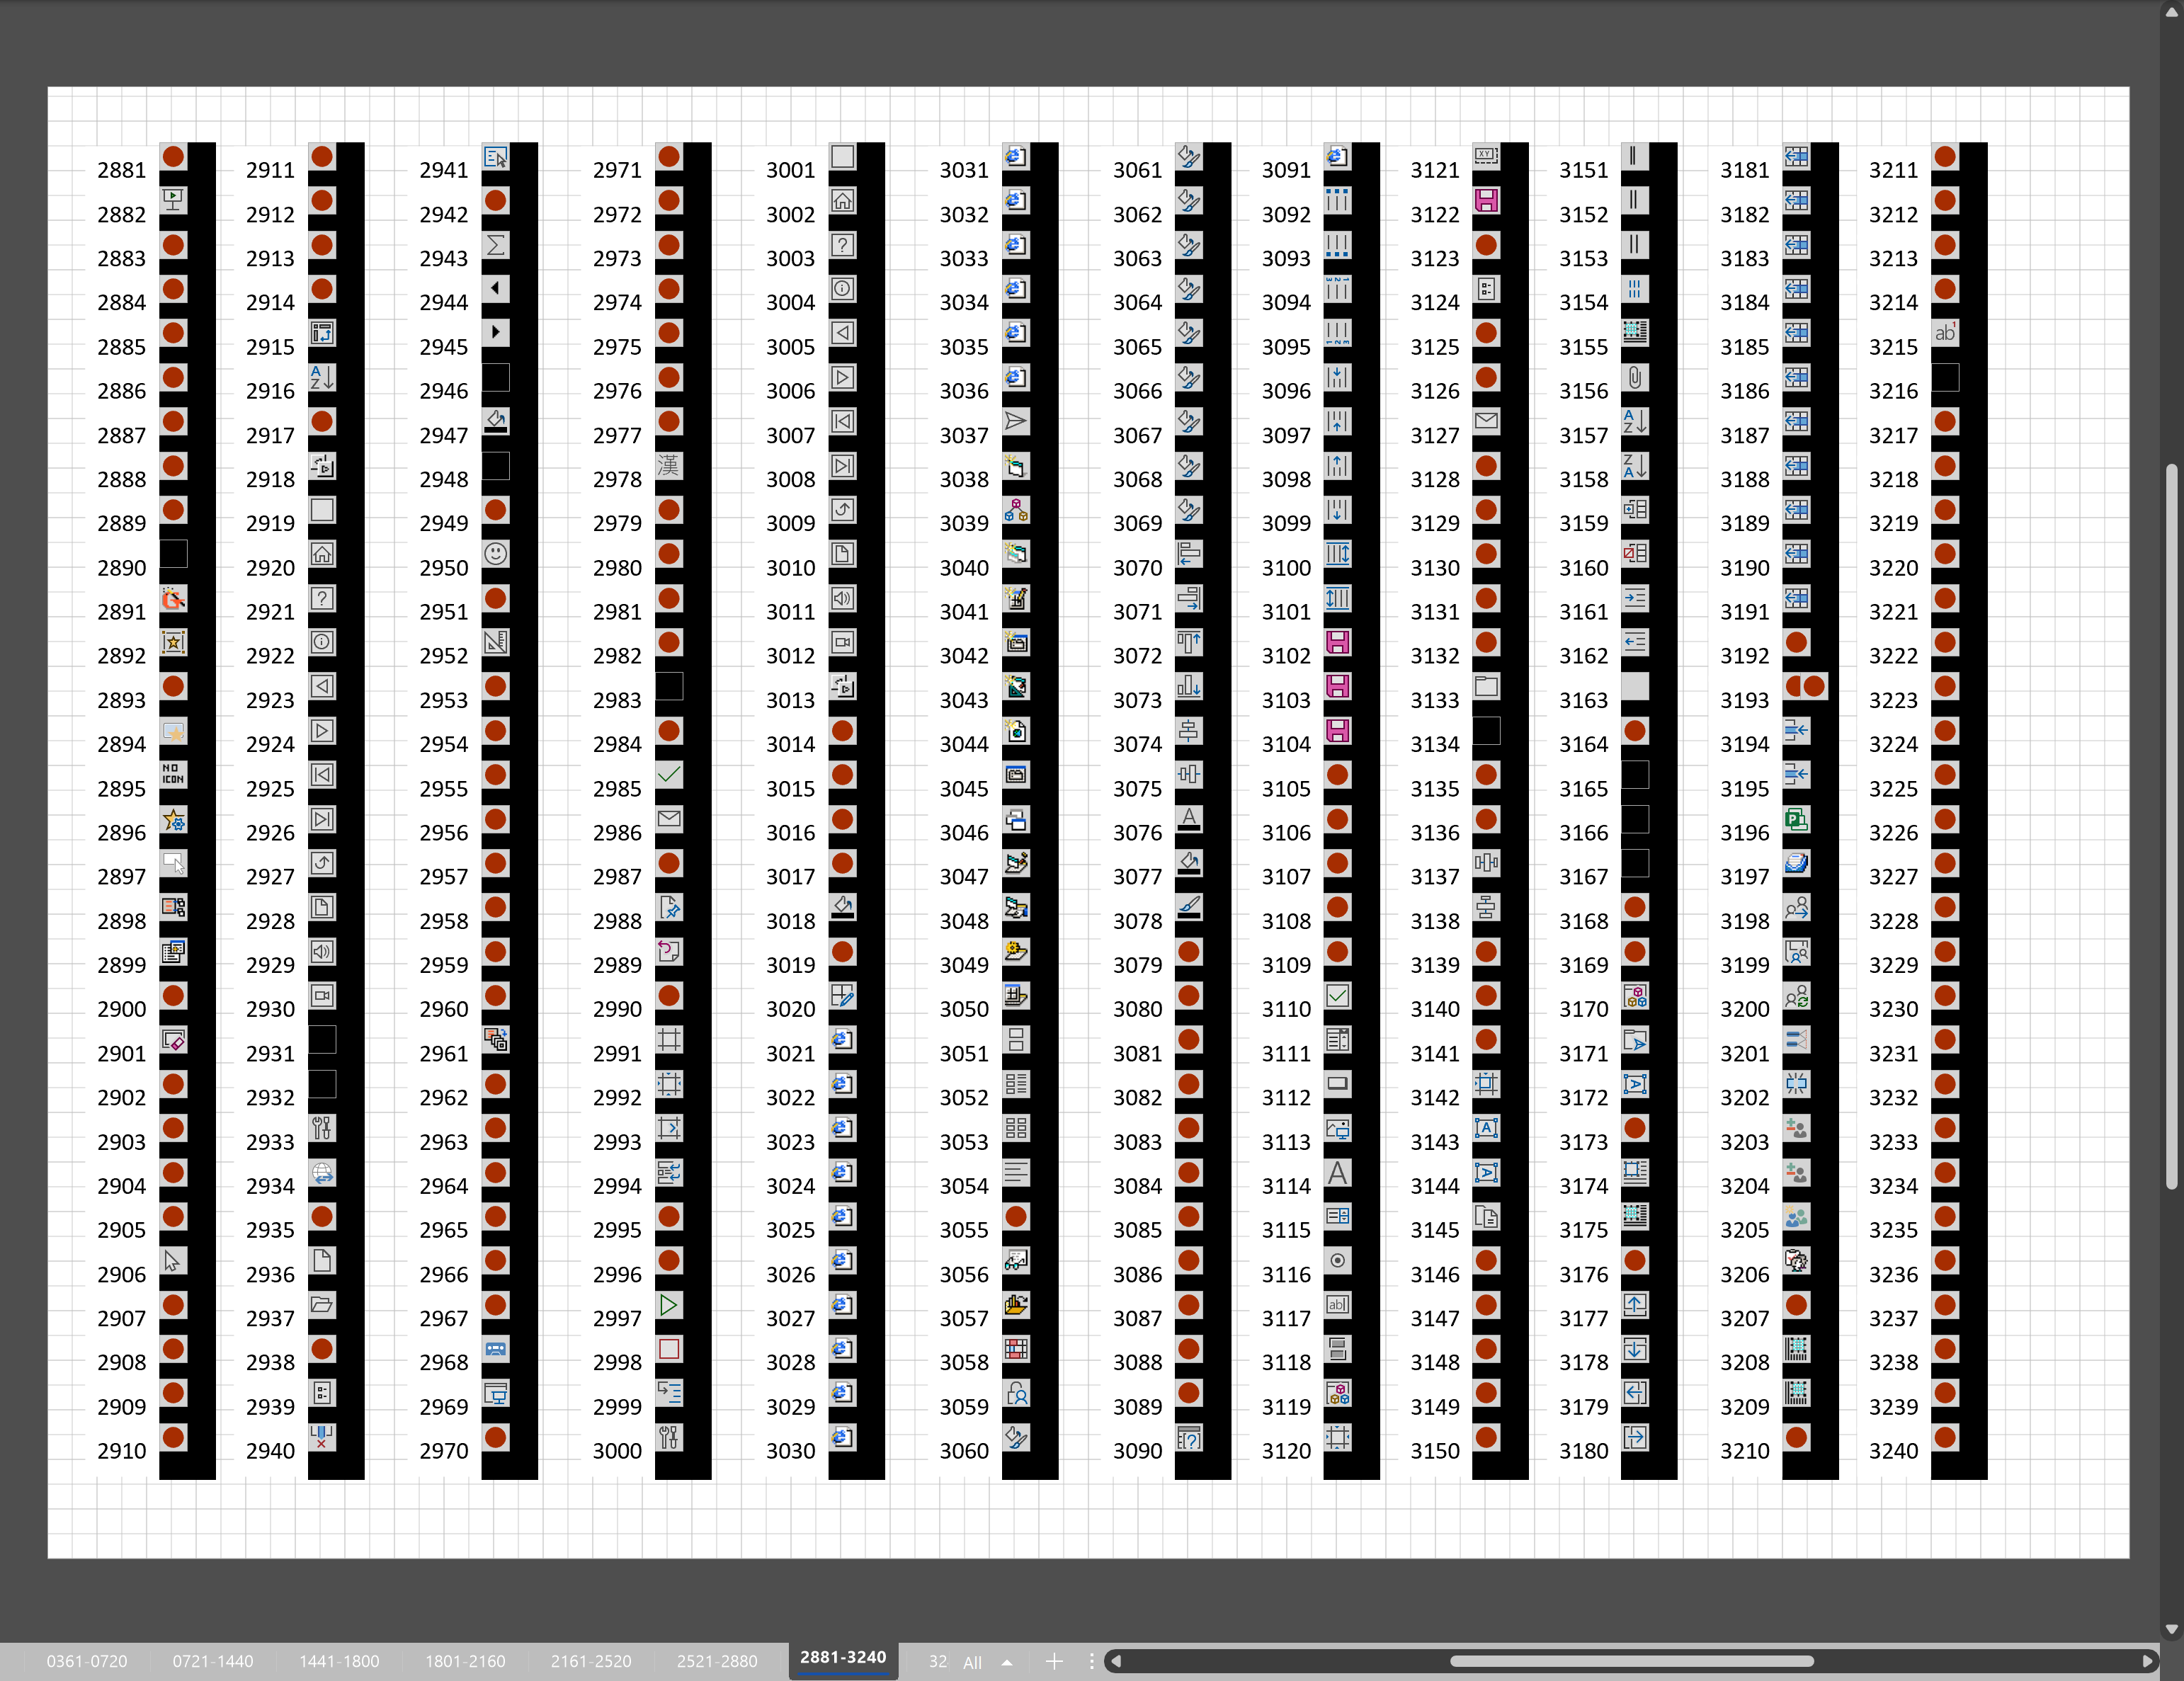
    • Metro Icons
    • Rules Tools for Visio
    • The Visio 2010 Sessions App
    • Multi-Language Text for Visio
    • Document Imager for Visio
    • multiSelect for Visio
    • pdSelect for Visio
  • Case Studies
    • Case studies overview
    • Visualizing Construction Project Schedules
    • Visio Online Business Process Mapping
    • Nexans Visio Template
    • VRA makes the case for Prudential
    • CNEE Projects, WorldCom
    • Chase Manhattan Bank
  • News
    • Recent news
    • News archive
  • Resources
    • My session and other Visio sessions at MSIgnite 2019
    • Innovative uses of Visio Lists
    • Vision up your Visio diagrams
    • Power up your Visio diagrams
    • Mastering Data Visualization with Microsoft Visio
    • Microsoft Visio Business Process Diagramming and Validation
    • The Visio 2010 MVP Sessions
    • Visualizing Information with Microsoft Visio
    • Visio Web Learning Resources
  • Blog
    • Browse blog articles
    • Visio Power BI articles
    • Visio for Web articles
    • Visio blog on Orbus website
    • A history of messaging and encryption
  • About us
    • About bVisual
    • Testimonials
    • Bio of David Parker
    • Contact Us
    • Ariba Network

ShapeSheet Functions

Published on August 8, 2019 by David Parker

Multi-line text in Visio Shape Data

The Shape Data (nee Custom Properties) dialog and window only provides a single line to view or edit text values. It is a great shame because the value can be up to 64k characters, and long text can be pasted into it. I, and many others, have complained about this for many years to Microsoft, but nothing has been done to rectify this. Of course, I do develop custom user interface components for many customers, but that is not always desirable. Therefore I sometimes re-purpose standard Visio elements to provide the ability to view or edit multi-line text in Shape Data rows.

  • Description Shape Data row
  • Edit using ScreenTip or Action
  • Scrollable multi-line text
    Scrollable multi-line text
  • The first 248 characters are displayed on mouse hover
  • Simple ShapeSheet formulas to do this
[Read more…] about Multi-line text in Visio Shape Data

Filed Under: Shape Data, ShapeSheet Formulas, Visio Tagged With: Shape Data, ShapeSheet, ShapeSheet Functions

Published on July 22, 2019 by David Parker

Writing a WeekNum(…) function for Visio

I needed to display the week number of dates in a Visio project of mine, but there is no WeekNum(…) function built-in, so I had to write one, and allow for the date that the week numbers begin in to be varied from 1st January.  I also needed to allow for the week numbers to go backwards from the specified week number begin date.
Excel has a WeekNum(..) function, which can take an optional parameter for the day of the week to begin on, and an IsoWeekNum(..) function, and the following table shows the values change for the first 35 days of the year:
Excel Week Num Formulas
[Read more…] about Writing a WeekNum(…) function for Visio

Filed Under: Shape Data, ShapeSheet Formulas, TimeTable, Visio, Visio 2016 Tagged With: Excel, ShapeSheet Functions

Published on March 7, 2019 by David Parker

Changing Visio Shape Size and Angle with Linked Data

I was recently laying out a computer room floor plan to scale in Visio, from survey data of the cabinets\racks within it, and it occurred to me that I could work a bit smarter than I first thought. Originally, I was going to just add lots of rectangles, size them, rotate them, and label each them with their name. Then I thought, why not use the Width, Depth and Name columns from the survey data to do most of the work for me? It was so simple to do, and only took a few minutes, so I thought I would share my methodology because it demonstrates how easy it is to work smarter with Visio….

These are the simple steps shown above, written out for your education….

[Read more…] about Changing Visio Shape Size and Angle with Linked Data

Filed Under: Excel, External Data, mFormula, ShapeSheet Formulas, Visio Tagged With: Shape Data, Shape Design, ShapeSheet, ShapeSheet Functions

Published on July 31, 2018 by David Parker

Enhancing the Built-In Containers in Visio

The concept of Structured Diagrams was introduced in Visio 2010 to provide core functionality for a variety of the templates in Visio, such as the Cross-Functional Flowchart, BPMN Diagram and Wireframe Diagram. This is primarily evident as Containers, Lists and Callouts and they can be customized (see Custom Containers, List and Callouts ), as shown in some of my previous articles ( see https://blog.bvisual.net/?s=container). One example of this extension can be found in all of the flowchart shapes that placed into a swimlane in a cross-functional flowchart. They have a Shape Data row, Function, that automatically inherits the text entered into the header of the swimlane. In another example, a Visio user can use Insert / Diagram Parts / Container to visually group other shapes together, and update the header text of the container. Well, I often do want my custom shapes to inherit the text of a container, so, in this article, I show how the built-in containers can be enhanced to provide this ability.

InheritingContainerText

You should be aware that I often exploit the fact that Visio creates a local copy of each master shape that it uses within a document. This can be modified and set to match master by name on drop, to ensure that it is the one to use, even if the original Microsoft provided version is used. In this case, I use this trick to create hidden, enhanced versions of the containers that are available in the gallery of containers. Microsoft also do this with the Dynamic connector shape in a number of their own templates.
If you examine the Function Shape Data row of any of the flowchart shapes, then you will find the formula:

[Read more…] about Enhancing the Built-In Containers in Visio

Filed Under: Containers, Process Flows, ShapeSheet Formulas, Visio, Visio 2016 Tagged With: Containers, ShapeSheet, ShapeSheet Functions

Published on June 19, 2018 by David Parker

Really Snapping to Grids in Visio

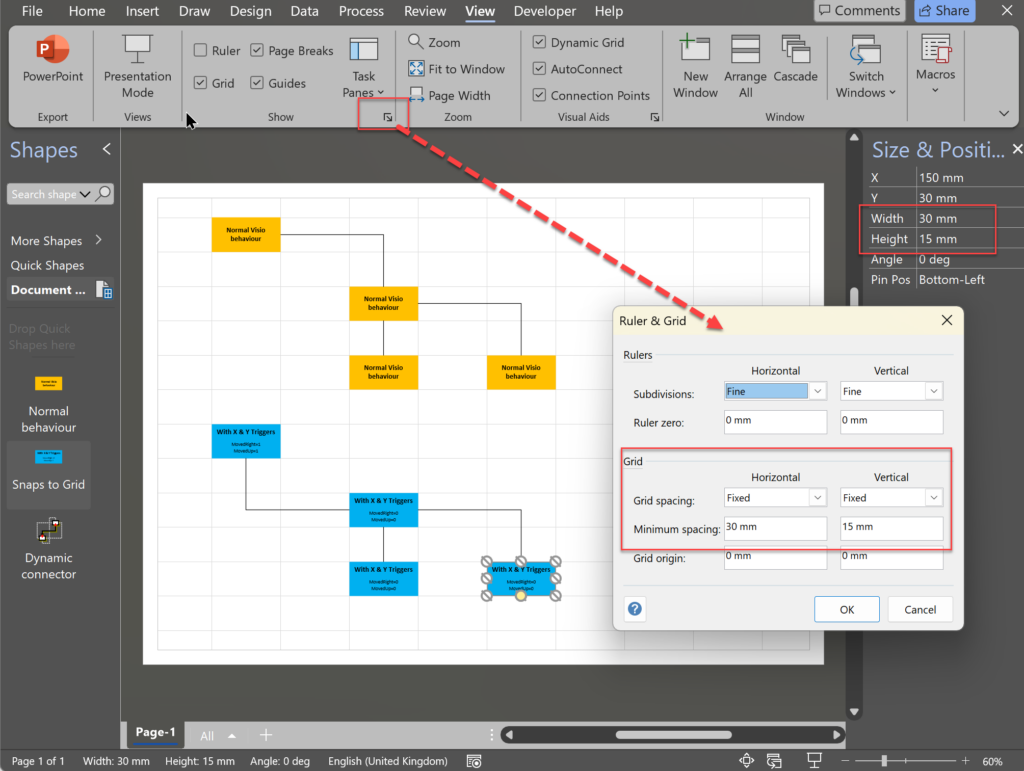
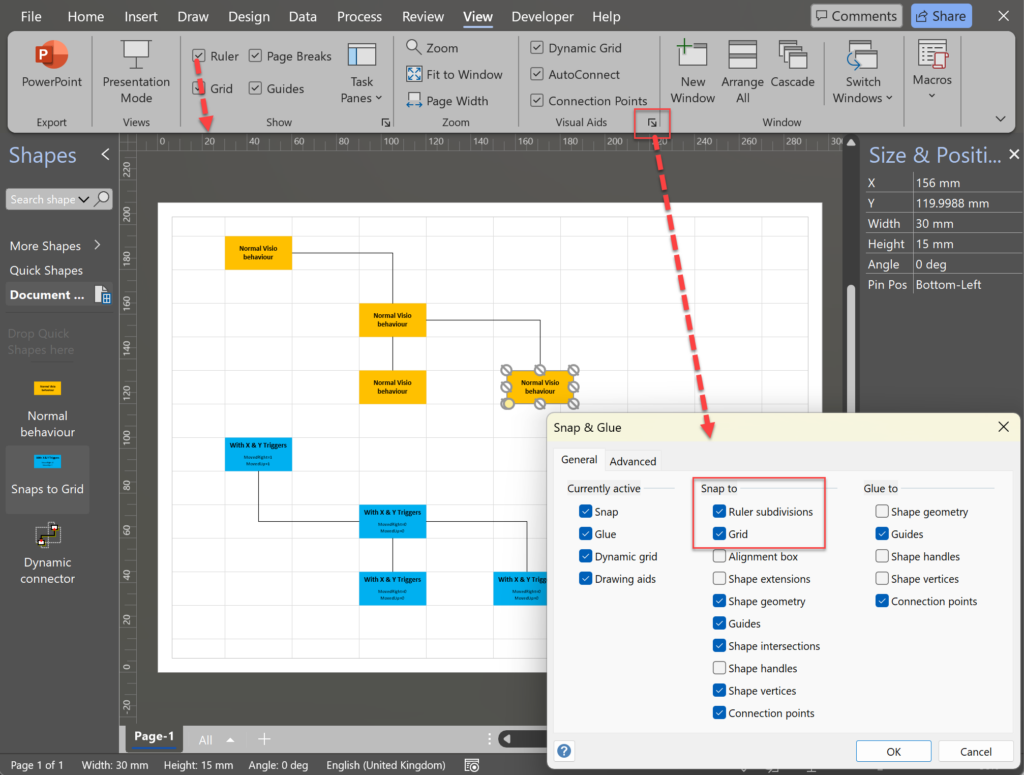
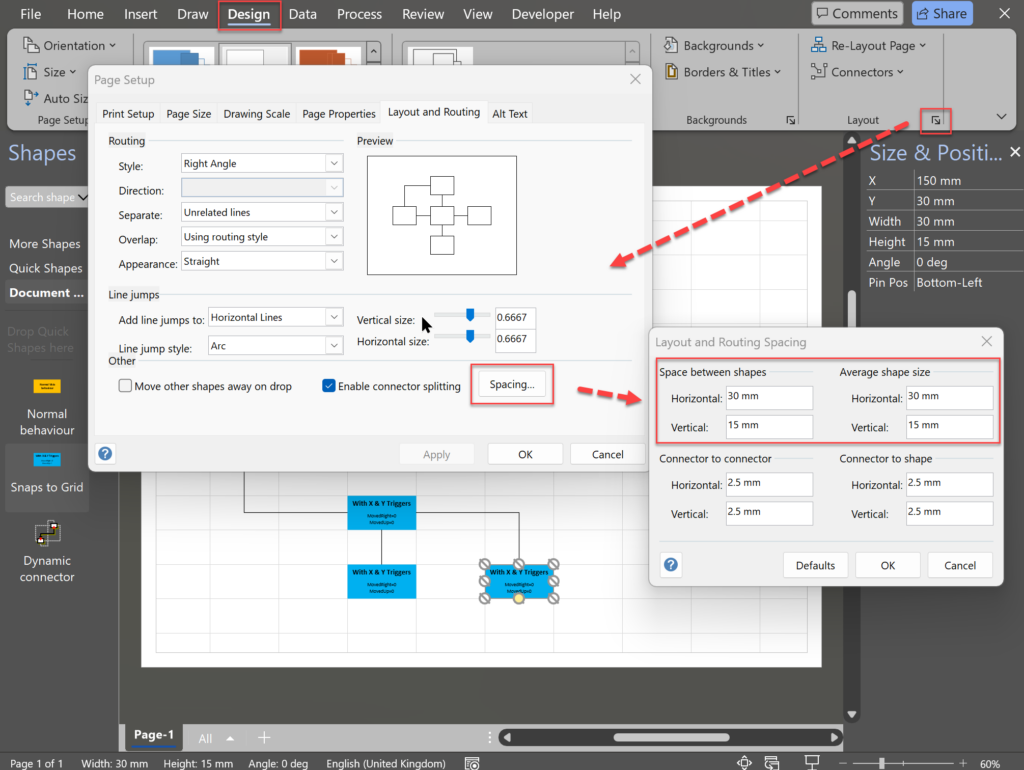
Visio has the ability to refine the options for snapping shapes to just grids, but this does not necessarily mean that shapes will automatically position themselves on a grid, or that the size is a multiple of a grid. What if you want some shapes to always be positioned on a fixed grid, and the width and height to always be a multiple on the horizontal and vertical grids respectively? What if you want the grid to start at the top left rather then the default bottom left? Fortunately, the ShapeSheet of the page and shapes can provide this ability, without the need for any external code.


You can set the page to have Fixed horizontal and vertical grids, each with different minimum spacing, if necessary. You can set the grid and ruler origins using the Ruler & Grid dialog, but it will be always relative to the bottom left corner of the page. So this can be a problem if you change the print margins or the page size, if you really want the grid origin to remain in another position, like top left.
You can just leave the Grid for snapping, and even change its strength to Strong, and even enter a larger number manually. This can help with snapping to the grids, but it is not enforced to be exclusive to the grids.

[Read more…] about Really Snapping to Grids in Visio

Filed Under: Shape Data, ShapeSheet Formulas, TimeTable, Visio Tagged With: ShapeSheet Functions

Published on June 15, 2018 by David Parker

Using EVALCELL() in Visio to calculate Workdays

I recently agreed to calculate the number of workdays between two dates in Visio, without realising how difficult it is. Excel users are lucky because it has the NETWORKDAYS() function, but Visio users are not so fortunate. However, Visio does have the EVALCELL function which can be extremely useful in cases like this. I got the inspiration from one of the answers in StackOverflow for a SQL user who also needed a solution.

First, I created a GetDaysUser-defined Cell row to calculate the number of inclusive days between two dates. This function requires two dates passed through as the start and end arguments.

User.GetDays
=INT(((DATEVALUE(ARG("e"))+1)-DATEVALUE(ARG("s")))/1 ed)
User.GetDays.Prompt
="Get the number of actual days between two dates, eg 1st Jan to 14th Feb : "&EVALCELL(User.GetDays,"s","01 Jan 2018","e","14 Feb 2018")

Second, I created a GetAdjusteDays User-defined cell row to provide the necessary addition of 1 day if the start date falls on a Sunday, and the subtraction of 2 days or 1 days if the end date falls on a Sunday or Saturday respectively.

User.GetAdjustedDays
=INT((EVALCELL(User.GetDays,"s",ARG("s"),"e",ARG("e"))+IF(WEEKDAY(DATEVALUE(ARG("s")))=7,1,0)-IF(WEEKDAY(DATEVALUE(ARG("e")))=7,2,IF(WEEKDAY(DATEVALUE(ARG("e")))=6,1,0))))
User.GetAdjustedDays.Prompt
="Get the number of days between two dates, adjusted for start and end day of the week : "&EVALCELL(User.GetAdjustedDays,"s","01 Jan 2018","e","14 Feb 2018")

Thirdly, I used the formula from my earlier article,Prototyping Visio ShapeSheet Formulas in Excel , the GetWorkdays User-defined Cell row to fully calculate the number of workdays (weekdays) between two dates.

User.GetWorkdays
=IF(WEEKDAY(DATEVALUE(ARG("s")))<=WEEKDAY(DATEVALUE(ARG("e"))),(FLOOR(INT(DATEVALUE(ARG("e"))-DATEVALUE(ARG("s")))/7)*5)+MAX(MIN(WEEKDAY(DATEVALUE(ARG("e")))+1,6)-WEEKDAY(DATEVALUE(ARG("s"))),0),(FLOOR(INT(DATEVALUE(ARG("e"))-DATEVALUE(ARG("s")))/7)*5)+MIN((WEEKDAY(DATEVALUE(ARG("e")))+6)-MIN(WEEKDAY(DATEVALUE(ARG("s"))),6),5))/1 ed
User.GetWorkdays.Prompt
="Get the number of work days between two dates, eg 1st Jan to 14th Feb : "&EVALCELL(User.GetWorkdays,"s","01 Jan 2018","e","14 Feb 2018")

This means that I can now include these User-defined Cell rows in any shape that I need to calculate the number of workdays for.
For example, if I have a shape with Start Date and End Date Shape Data rows, I can call either the User.GetDays or User.GetWorkdays functions using the EVALCELL() function.

Prop.DurationDays.Value
=GUARD(EVALCELL(User.GetDays,"s",Prop.StartDate,"e",Prop.EndDate))
Prop.DurationWorkdays.Value
=GUARD(EVALCELL(User.GetWorkdays,"s",Prop.StartDate,"e",Prop.EndDate))

Of course, I guarded these formulas because I do not want a user to accidently overwrite them.
 

Filed Under: ShapeSheet Formulas, TimeTable, Visio Tagged With: ShapeSheet Functions

  • Go to page 1
  • Go to page 2
  • Go to page 3
  • Interim pages omitted …
  • Go to page 6
  • Go to Next Page »

Primary Sidebar

Sign up for our newsletter

No spam. Unsubscribe anytime. Get email updates whenever we publish new blog posts.

  • LinkedIn
  • Twitter

Recent Posts

  • Displaying Visio Number Shapes data clearly
  • Using Visio Org Chart Wizard to work with Exchange Online
  • Overcoming ‘We can’t open your file in Visio because it exceeds the shape count limit’ in Power BI
  • Visio news from MS Ignite 2019
  • Clarity Videos Re-boot

Categories

Tags

Accessibility Add-Ins Connectors Data Export Data Graphics Data Import DataRecordset Data Visualizer Educational Excel FM GraphDatabase Hyperlinks Icons Icon Sets JavaScript Layers Legend Link Data to Shapes Macros MSIgnite MVP Office365 Org Chart PowerApps PowerBI PowerQuery Processes Scales Shape Data ShapeSheet ShapeSheet Functions SharePoint 2013 SQL Validation VBA Video Visio Visio 2007 Visio 2013 Visio Pro for Office365 Visio Services Visio Viewer Web Webinar

Footer

bVisual Profile

The UK-based independent Visio consultancy with a worldwide reach. We have over 25 years experience of providing data visualization solutions to companies around the globe.

Learn more about bVisual

  • LinkedIn
  • Twitter

Search this website

Recent posts

  • Displaying Visio Number Shapes data clearly
  • Using Visio Org Chart Wizard to work with Exchange Online
  • Overcoming ‘We can’t open your file in Visio because it exceeds the shape count limit’ in Power BI
  • Visio news from MS Ignite 2019
  • Clarity Videos Re-boot

Sign up for our newsletter

No spam. Unsubscribe anytime. Get email updates whenever we publish new blog posts.

Copyright © 2019 bVisual Ltd. All rights reserved. · Privacy policy · Terms and conditions