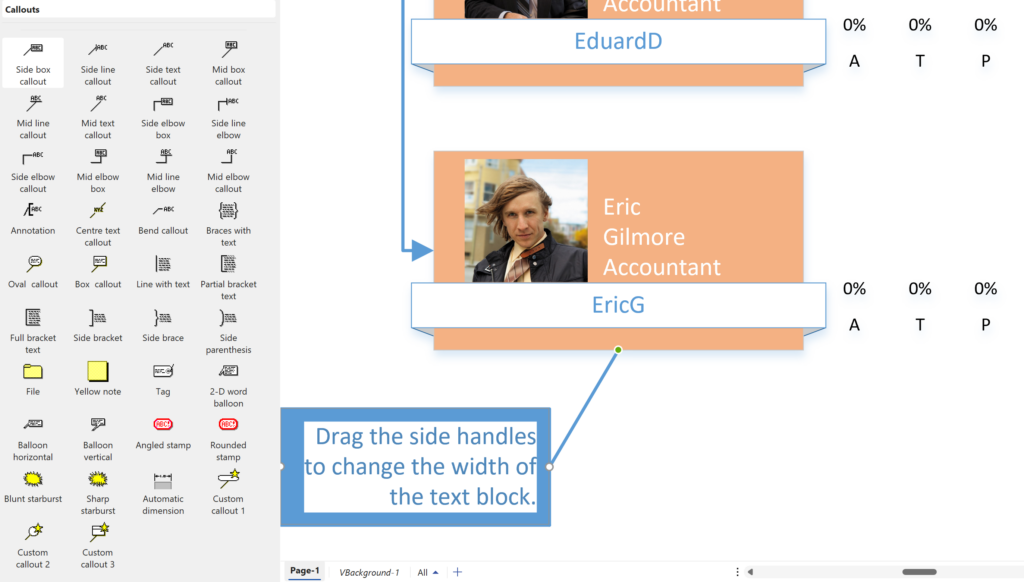
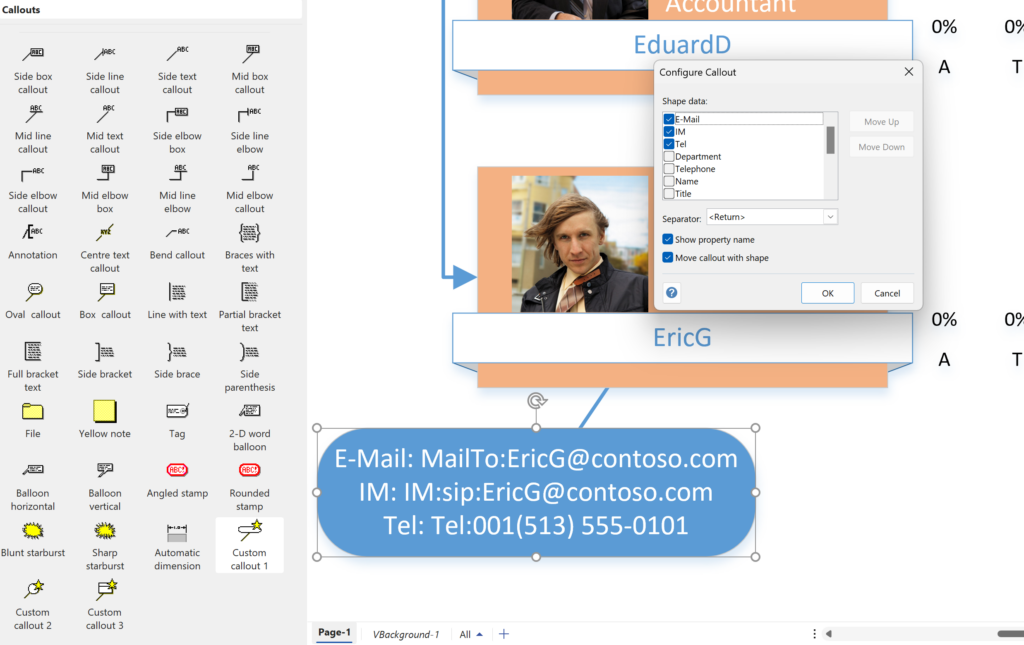
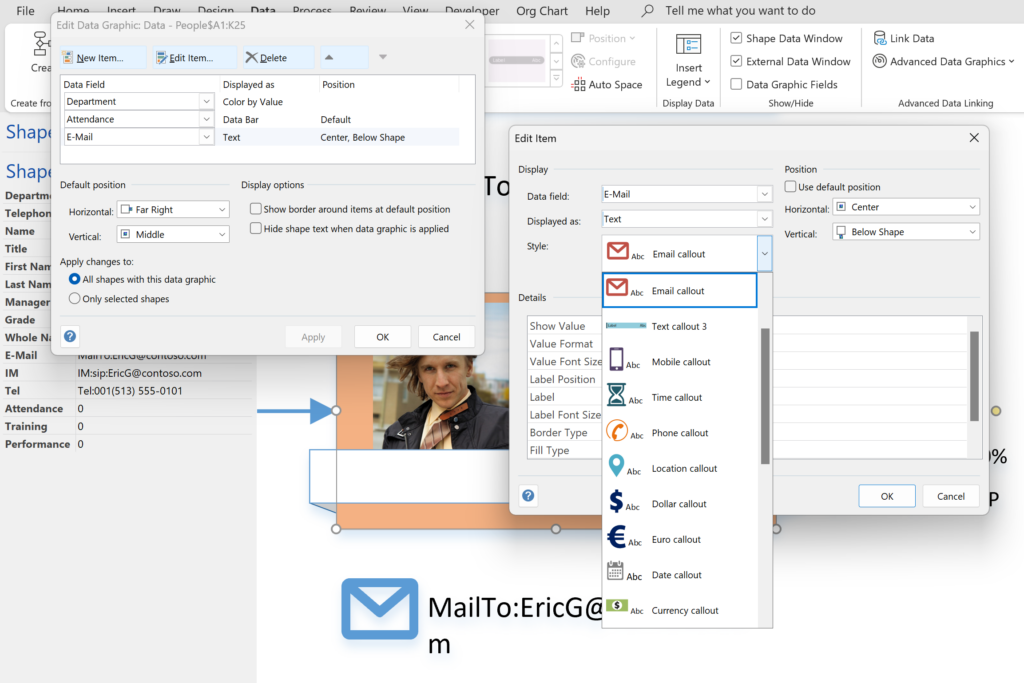
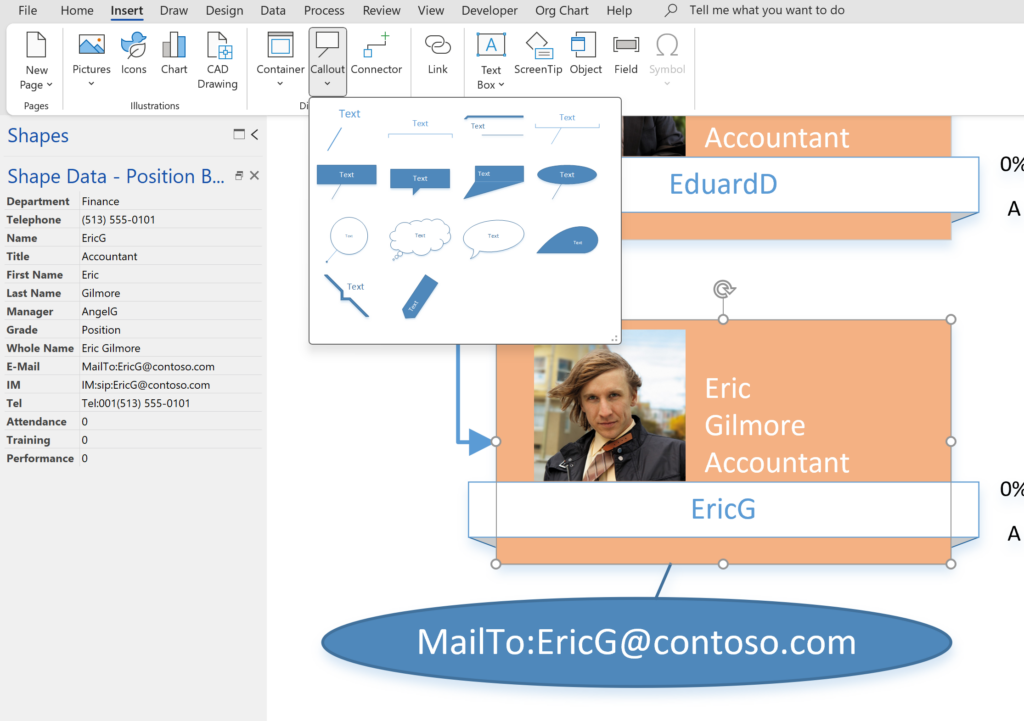
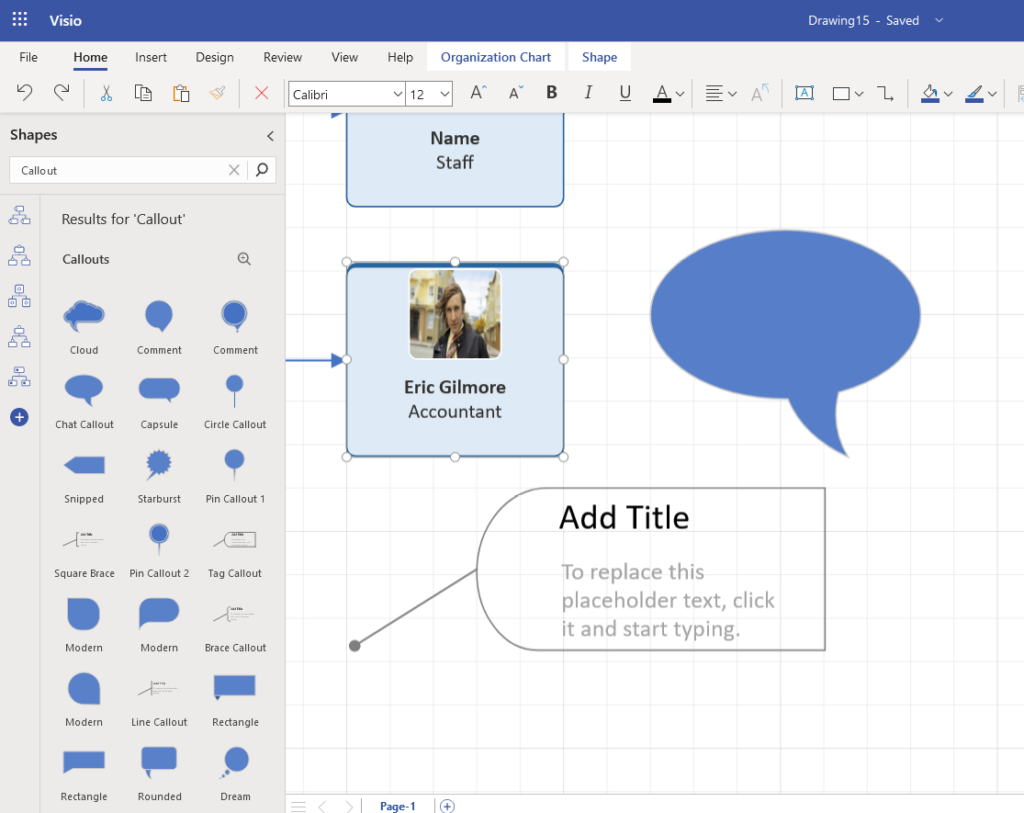
I have been a Visio user/developer since the mid-1990’s and seen the word “callout” used as part of the name of many master shapes in Visio. The images below show five ways that the term “callout” has been applied to the name of Visio master shapes. Generally, each evolution has been an advance on the previous ones, or have becoome specialised for their usage … until Microsoft made “callout” shapes available in Visio web editions. These are not an advance in evolution, but are a radical regression, and in my opinion, quite unnecessarily basic, and extremely frustrating.
[Read more…] about When is a Visio Callout not a Callout?Shape Data
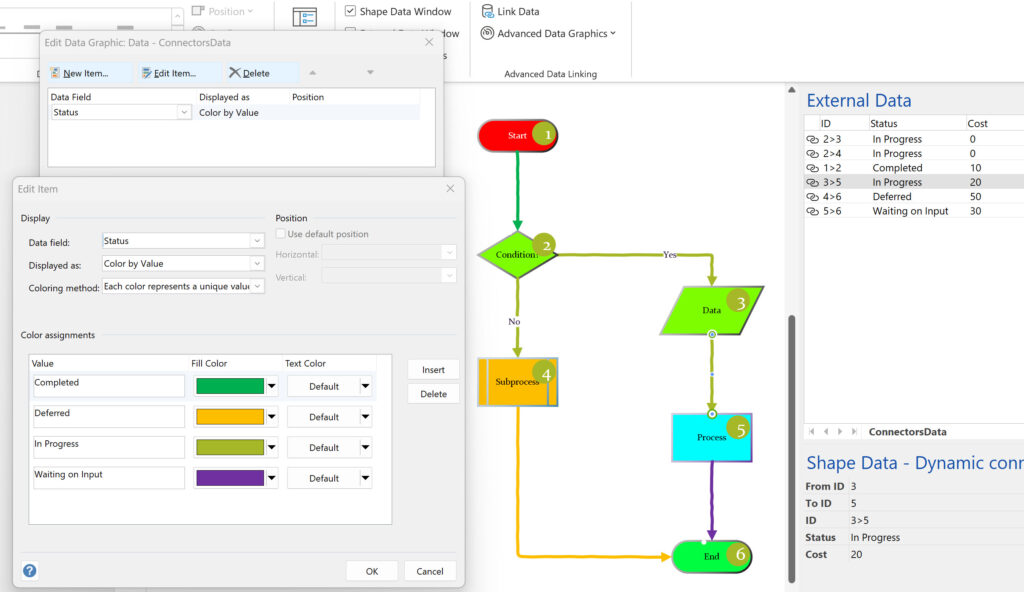
Using Visio Color by Value on Connectors
Data Graphics in Visio Plan 2 and Visio Professional is great, but it only enables us to use them with 2D shapes in Visio, i.e. not on connectors. So, what if you want to change the line colour of the connectors between the 2D shapes because of the data flowing between them? Well, it is possible … with a little preparation!
More Parsing XML Data in Visio Shapes
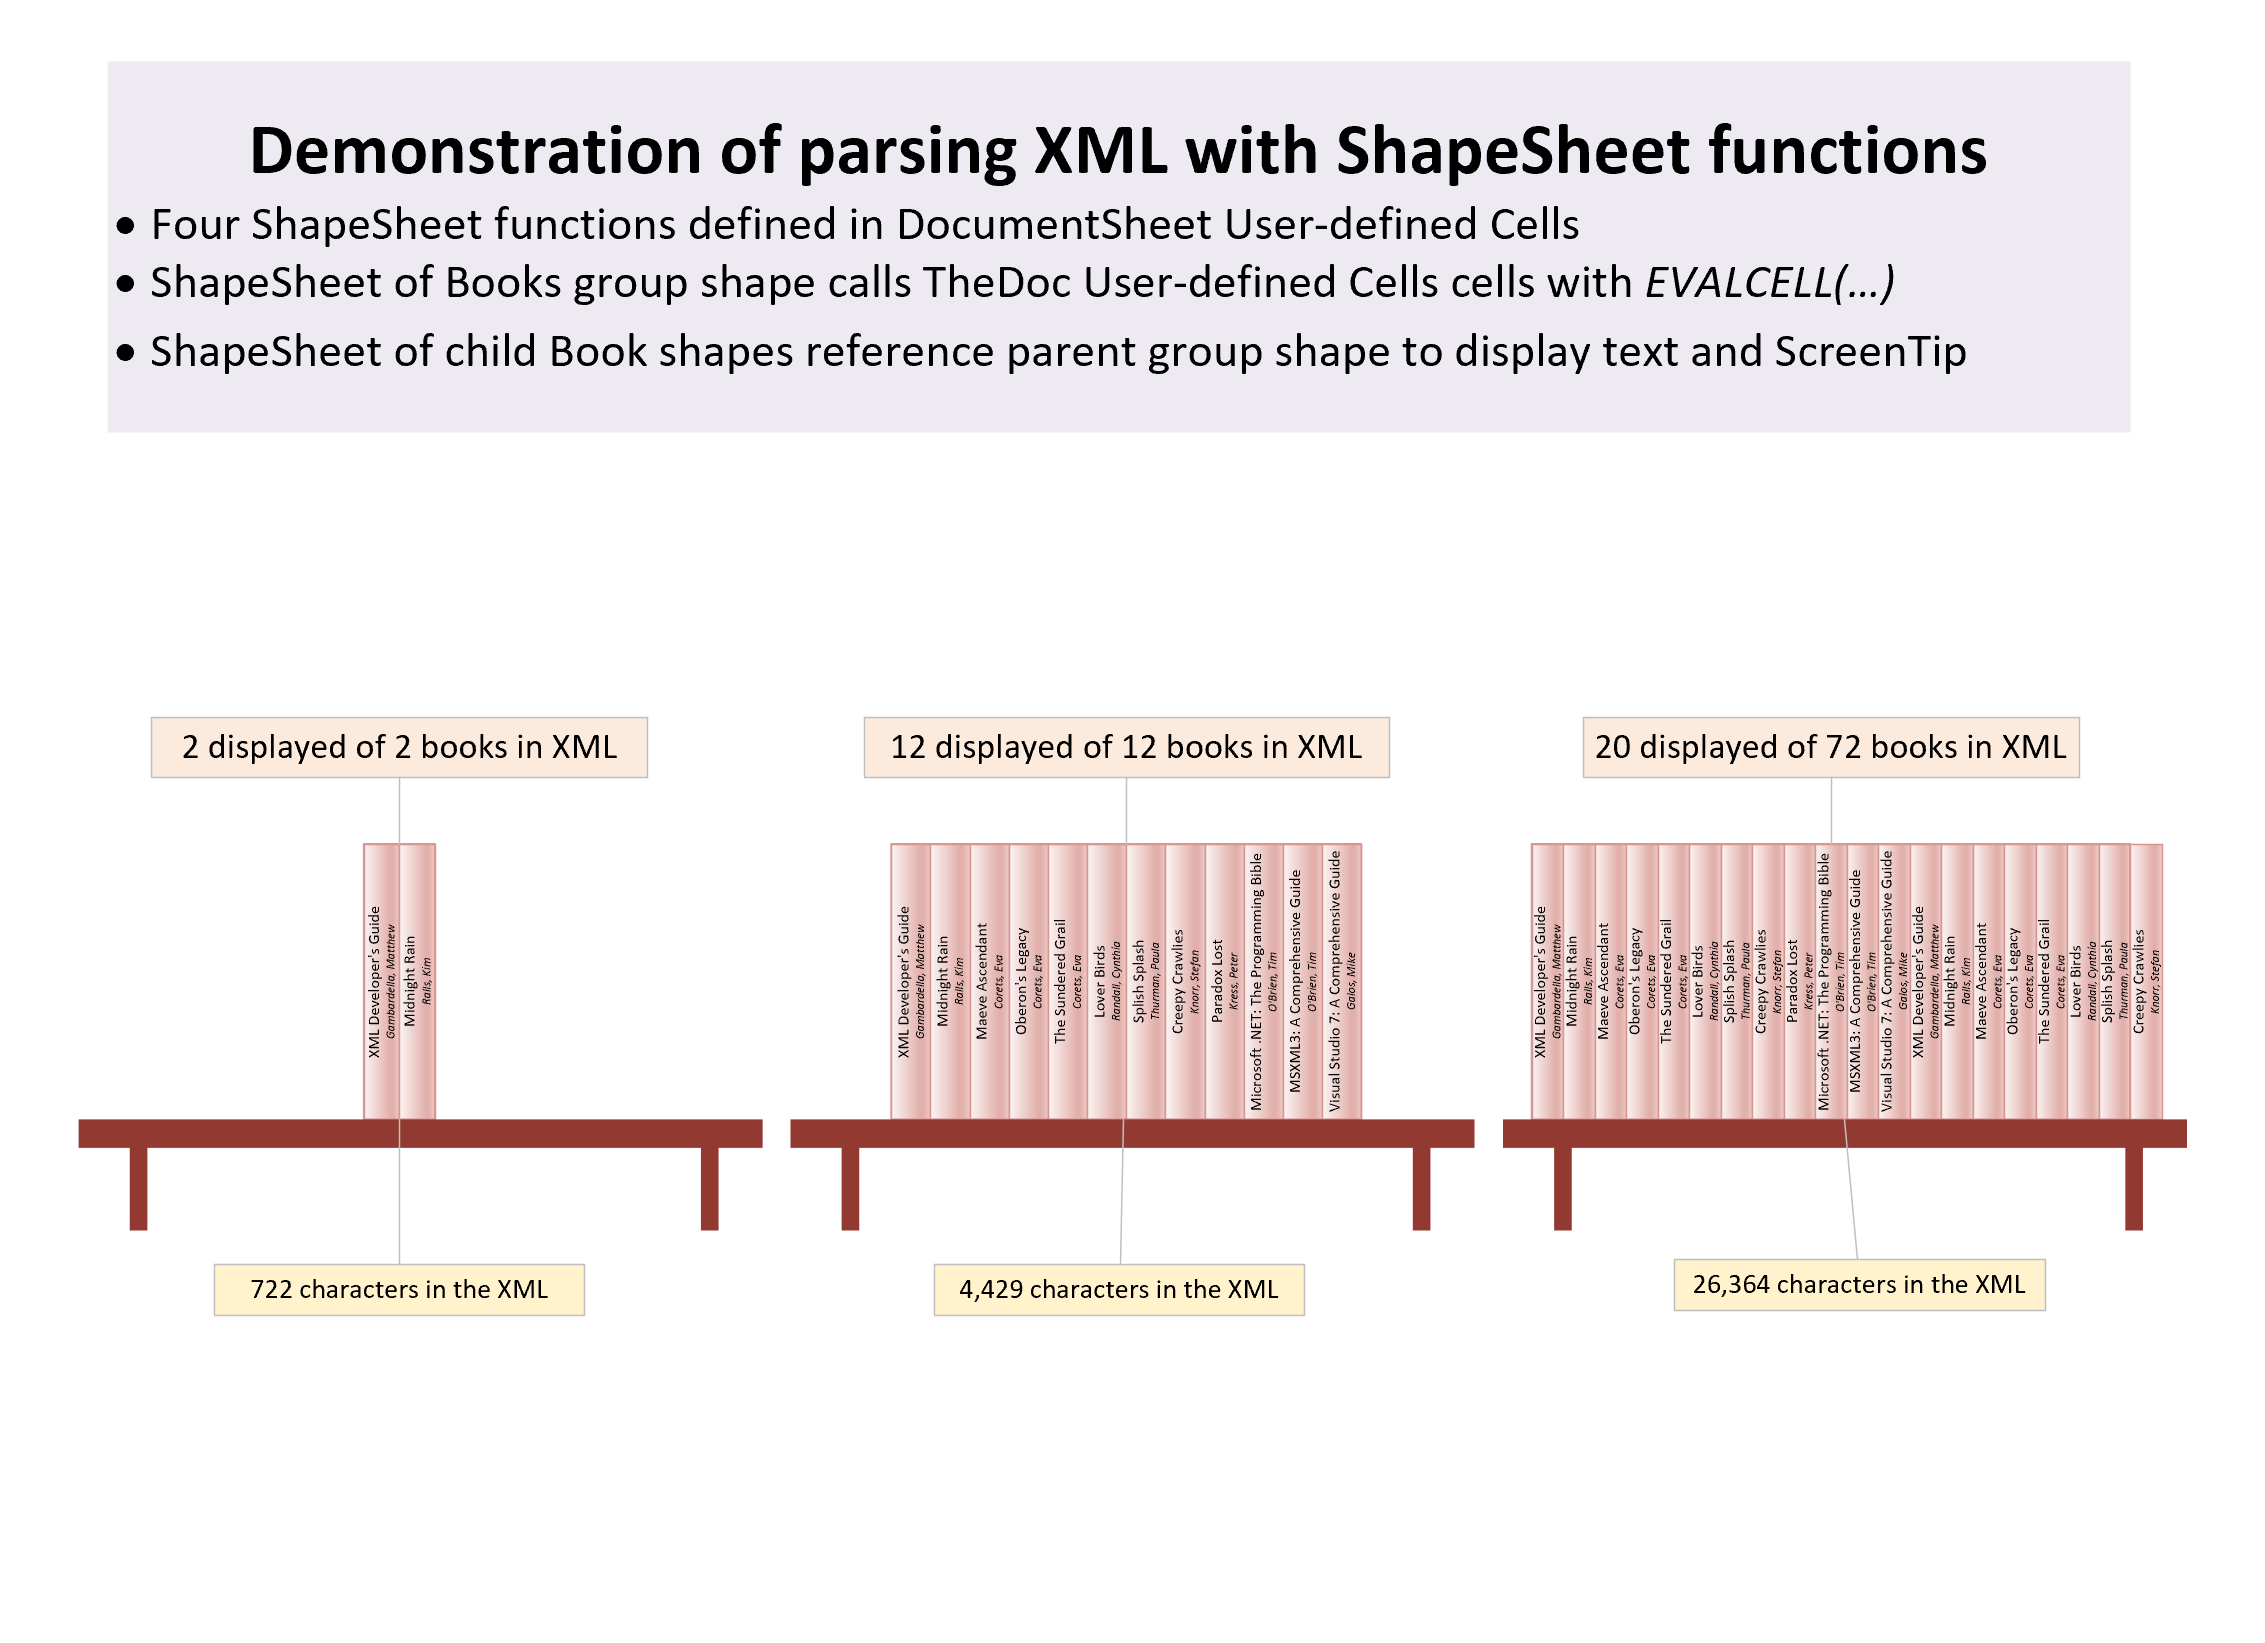
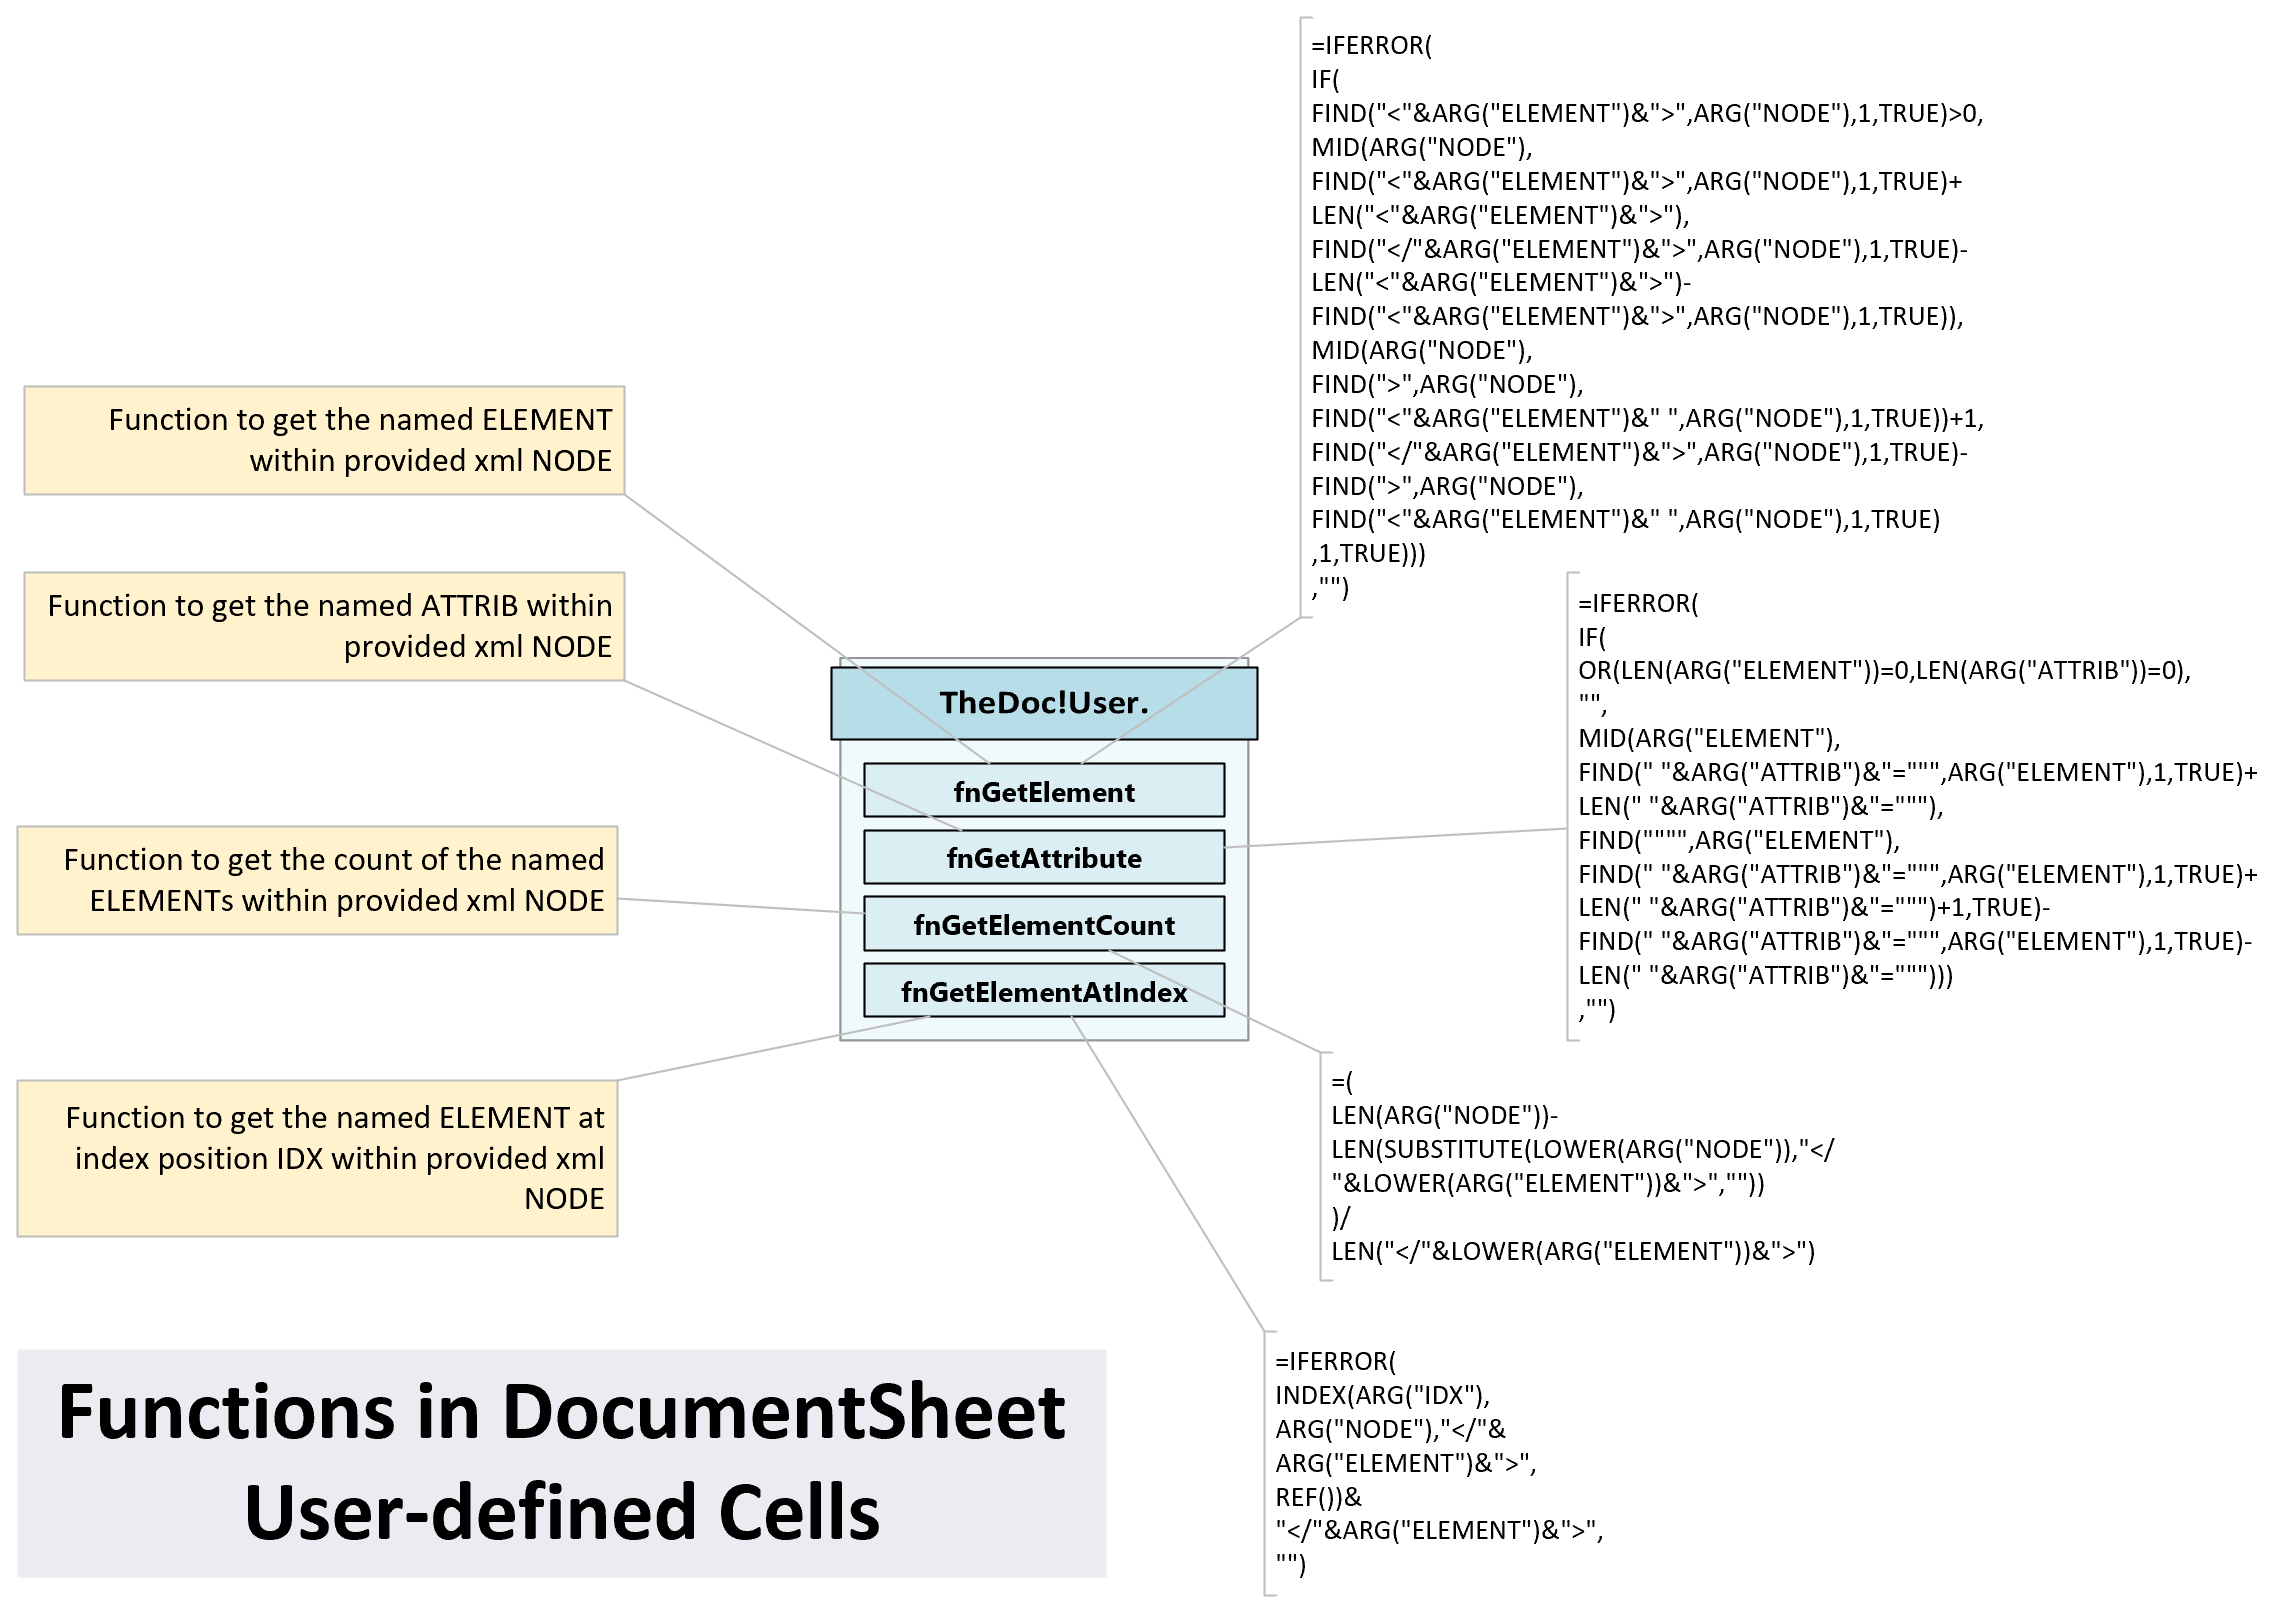
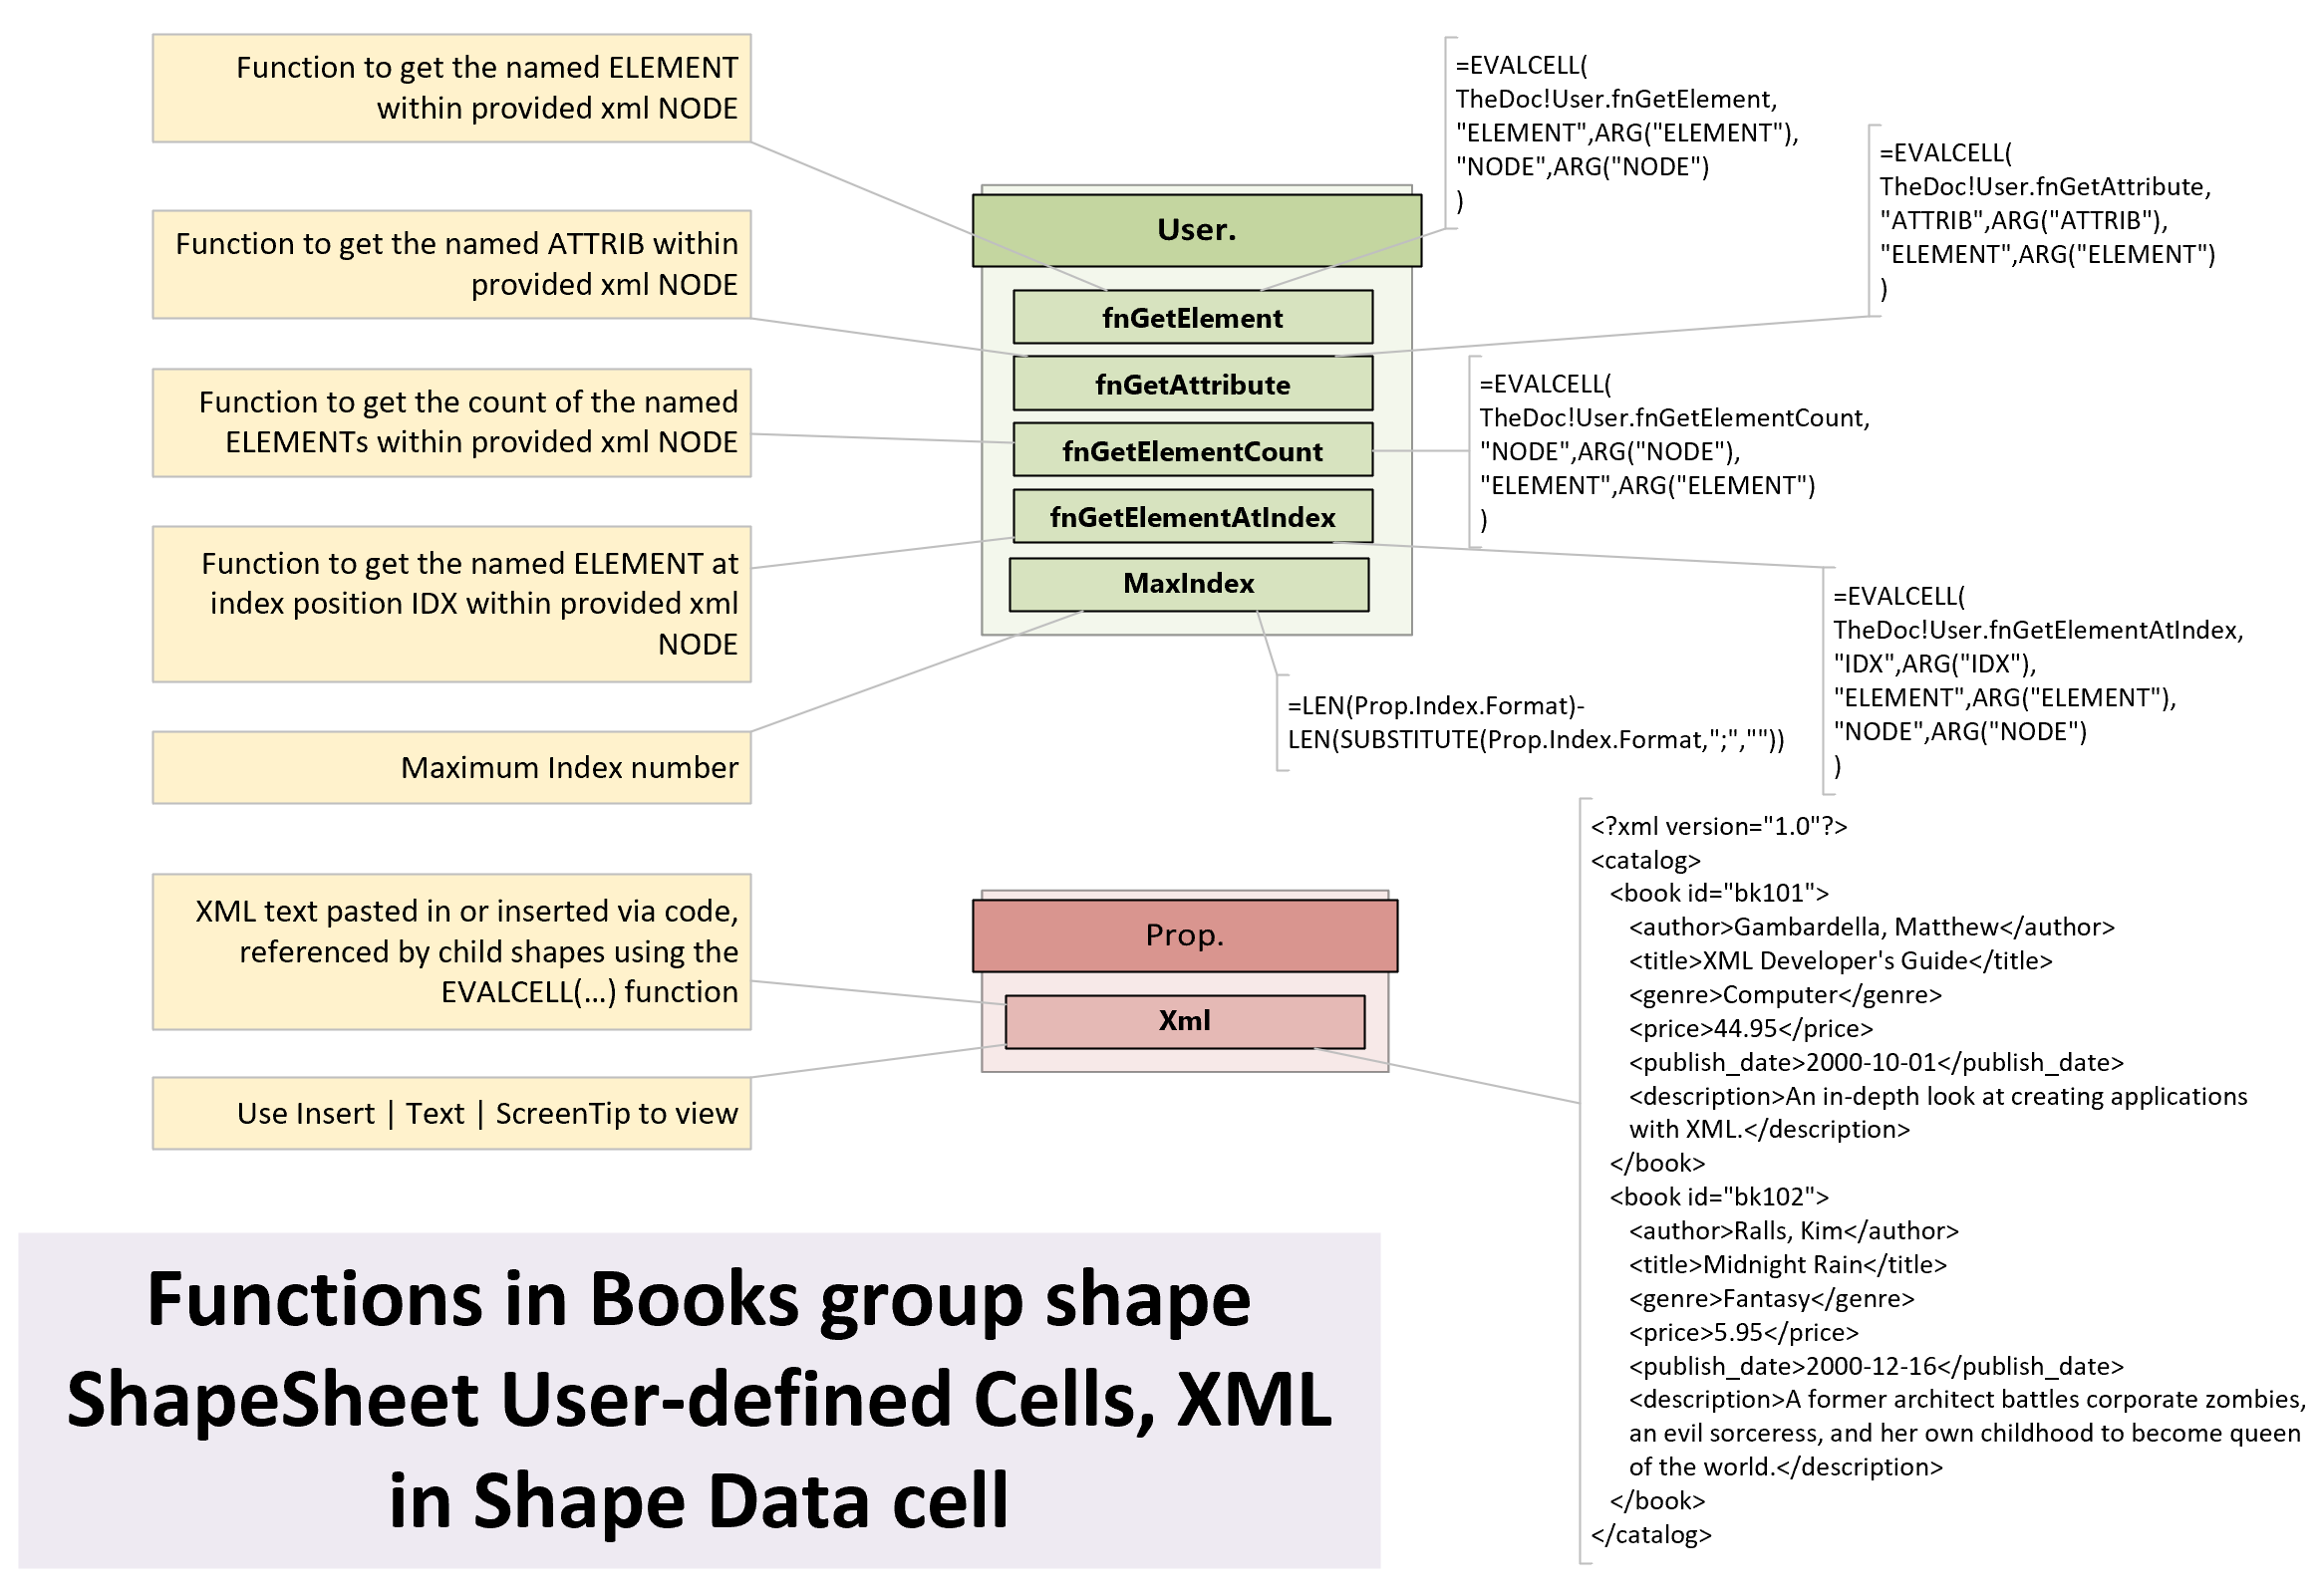
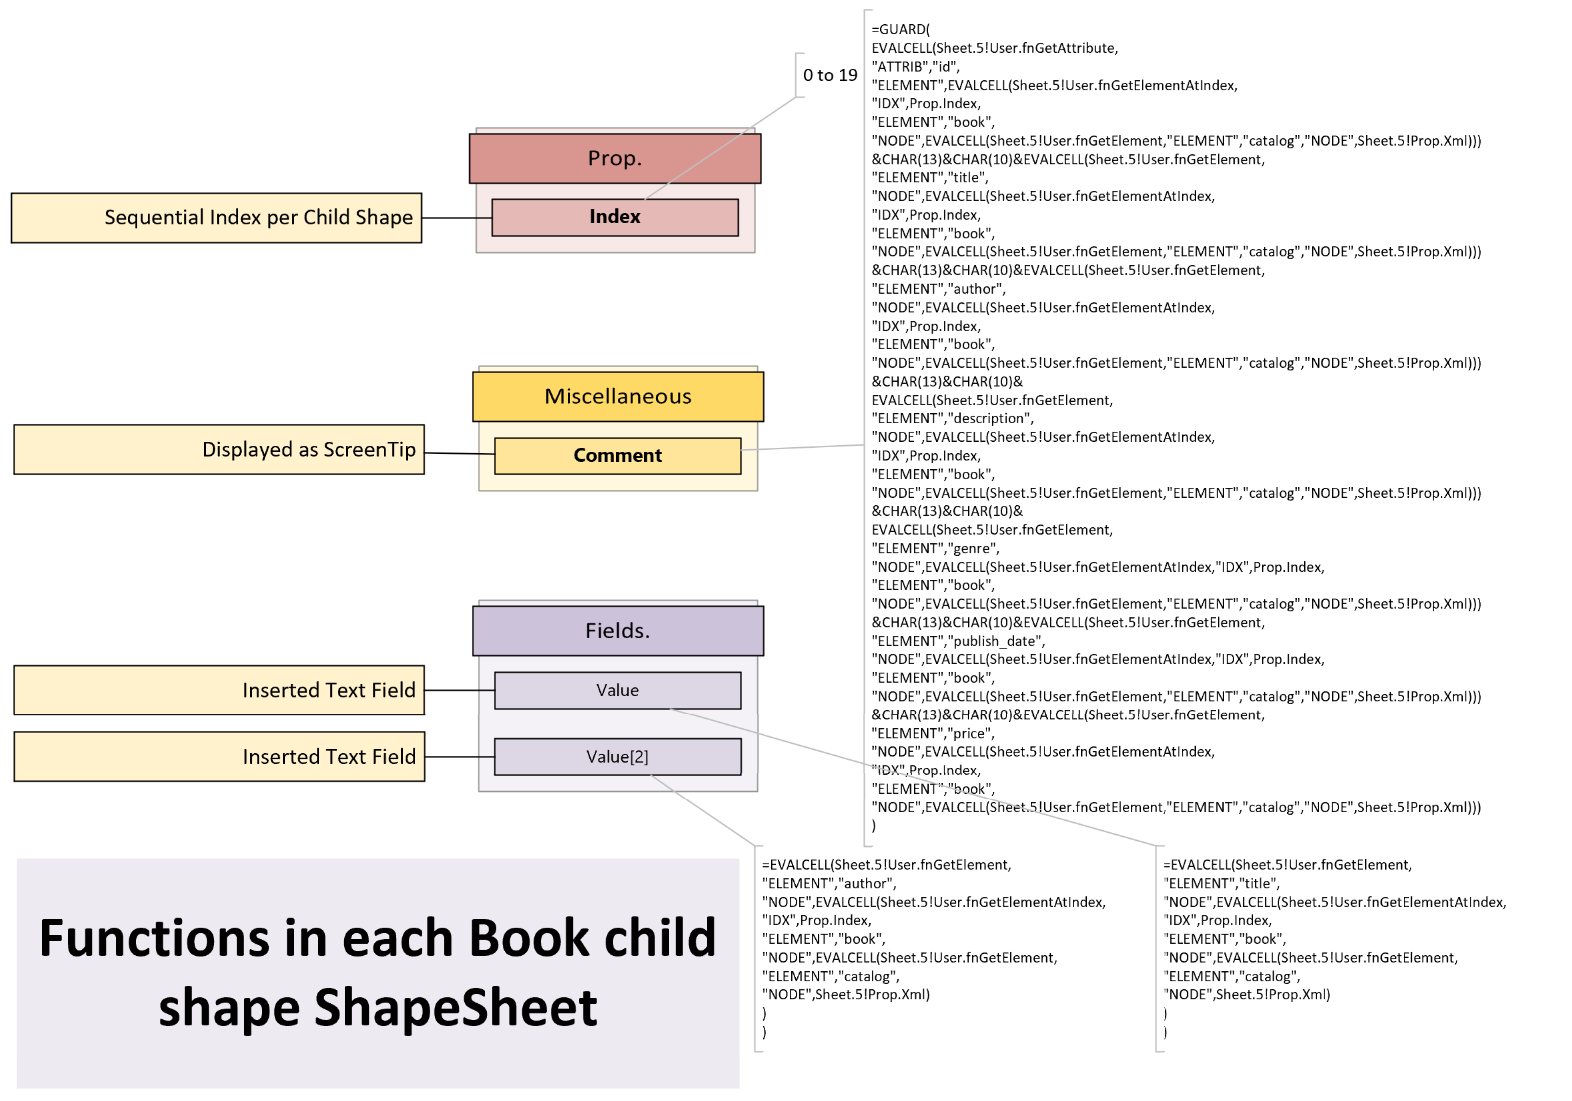
My last article looked at parsing an XML string with a known structure and order of elements and attributes. This can be acceptable in some scenarios, but what if the elements or attributes are in a different order? Then it is necessary to use the element and attribute names rather than their index position. This requires a little more complexity to the ShapeSheet functions, and this can result in longer processing time, so needs to be used cautiously, but it is possible, as I demonstrate in this article.
[Read more…] about More Parsing XML Data in Visio ShapesHighlighting dirty text in Visio shapes
I suppose I should explain what I mean by dirty text first 🙂
I often display the value of a Shape Data row in Visio text, but sometimes the solution requires that the value is also editable. This is ok if the client accepts that all editing is done with the Shape Data window or dialog, but not if the user more naturally wants to edit the text in the shape. In my current solution, I want to pass the manually edited text to another process for checking, and then only update the Shape Data row when validated or accepted, before re-setting the text with the inserted field. My first task was to spot with text had been manually overtyped, so I decided that checking the value of a new User-defined Cell, called IsDirty, was best, and then this value can be used to change the color of the text (or it could be the LineColor or FillForegnd) to make this value visible.
When Insert / Field is used in Visio, it creates a Text Fields section which can hold the reference to the inserted field.
If the text is manually overtyped, then the rows in the Text Fields section get deleted.
[Read more…] about Highlighting dirty text in Visio shapesInteractive Demographics of the European Union in Visio
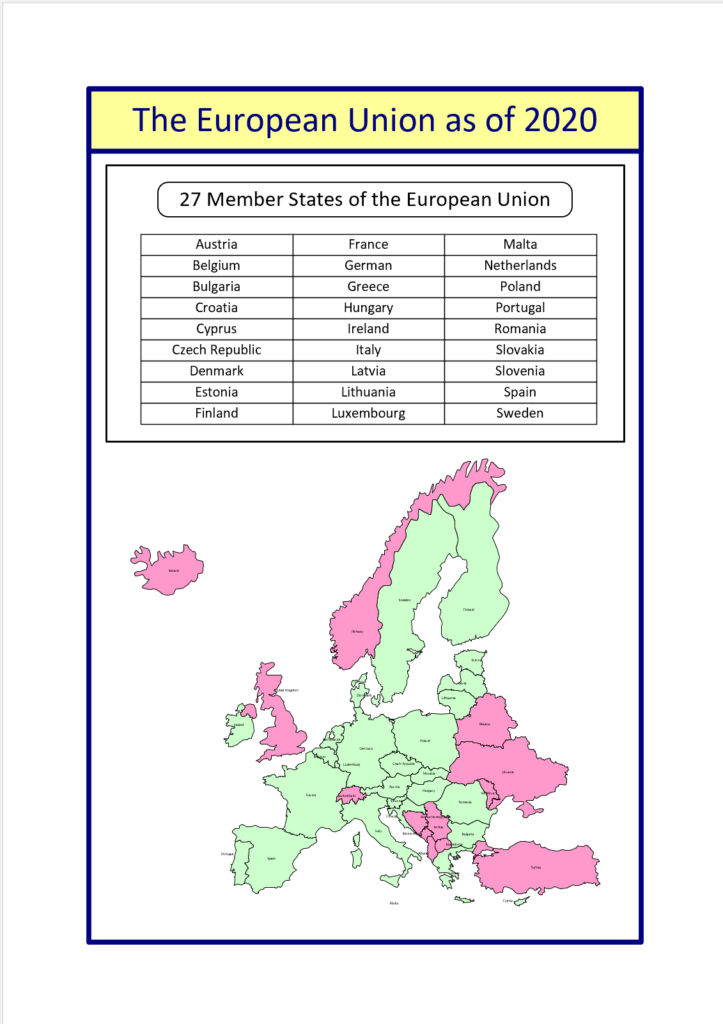
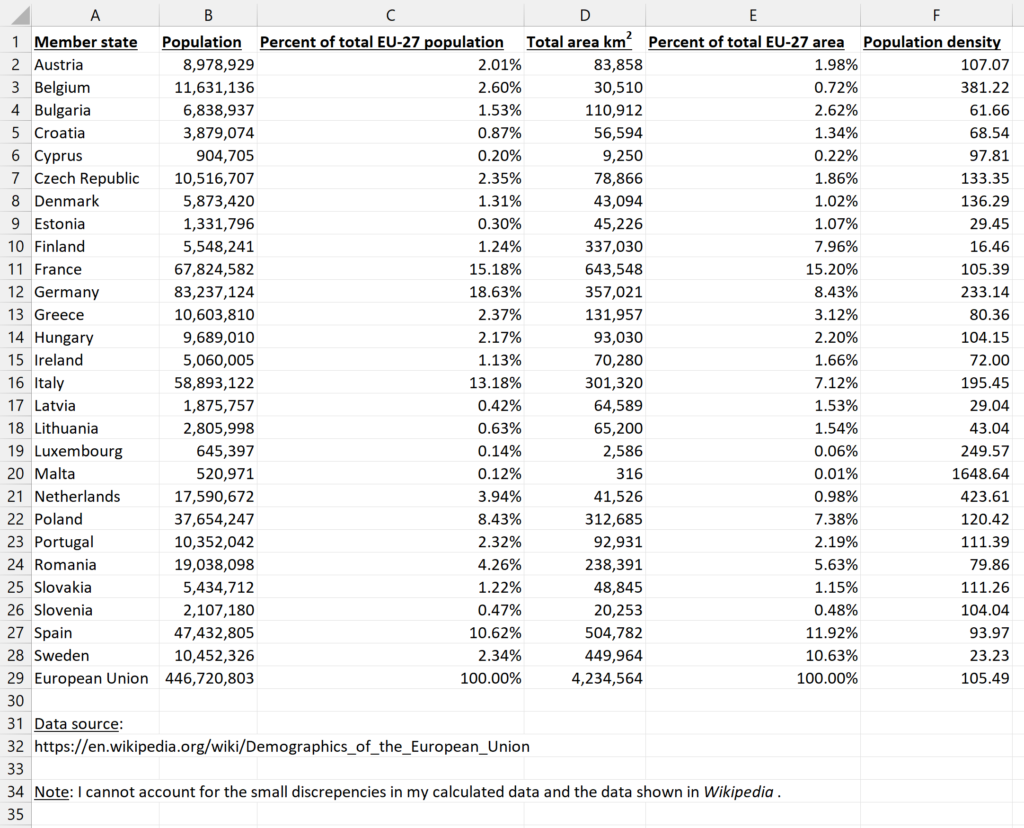
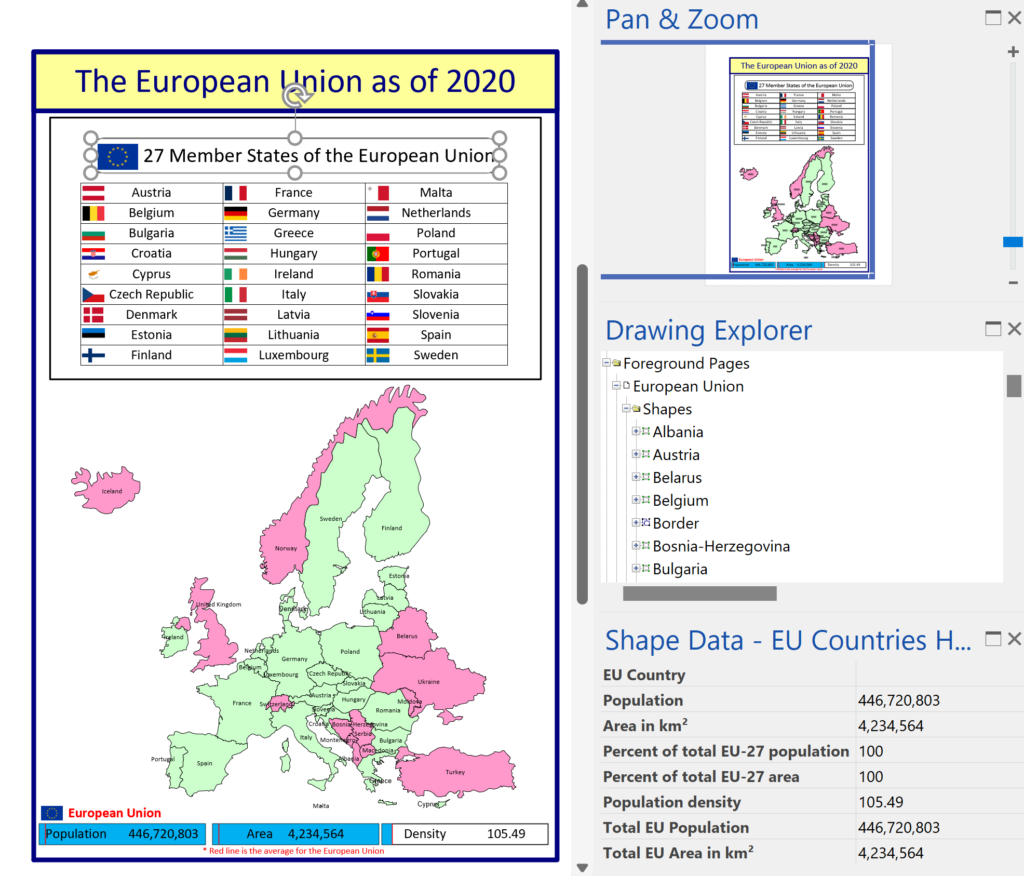
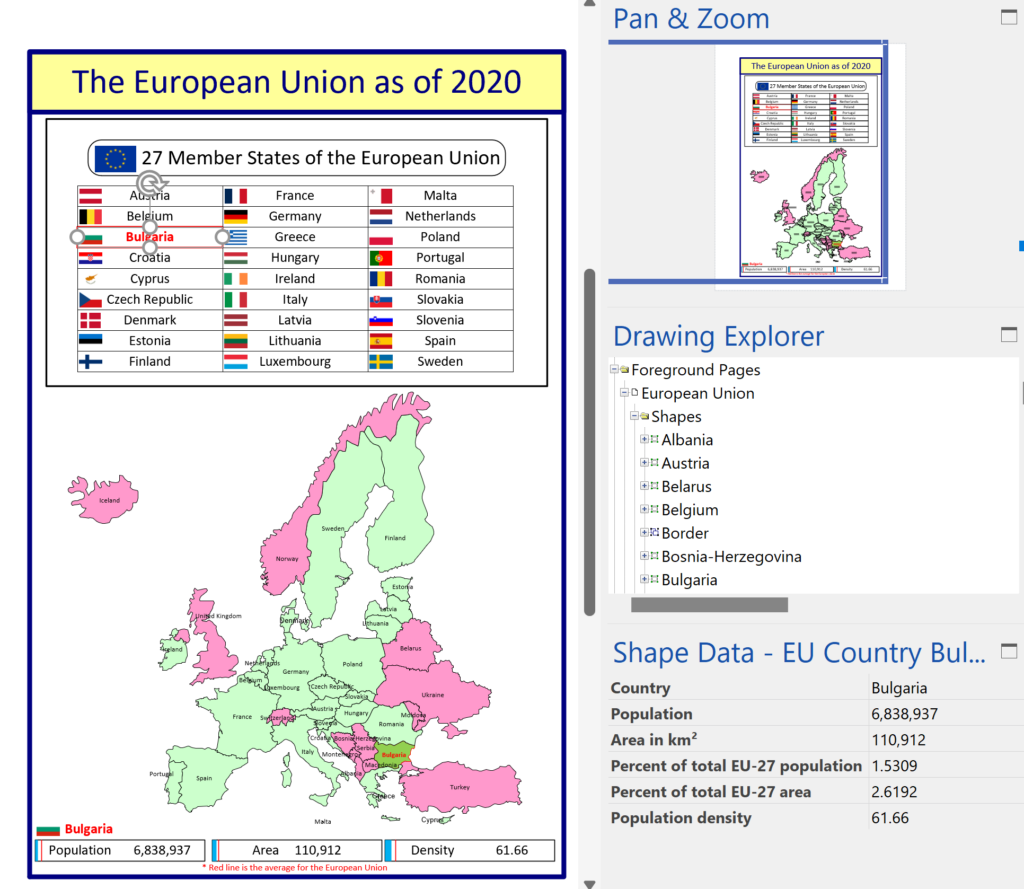
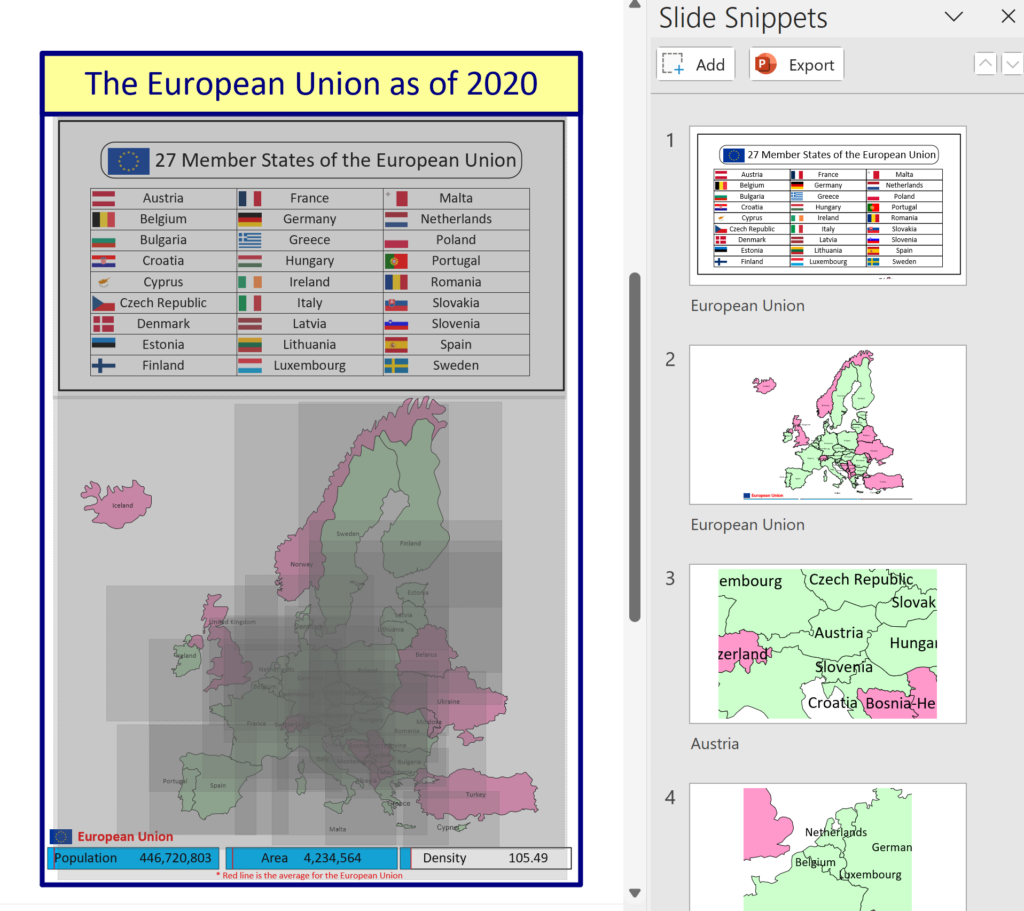
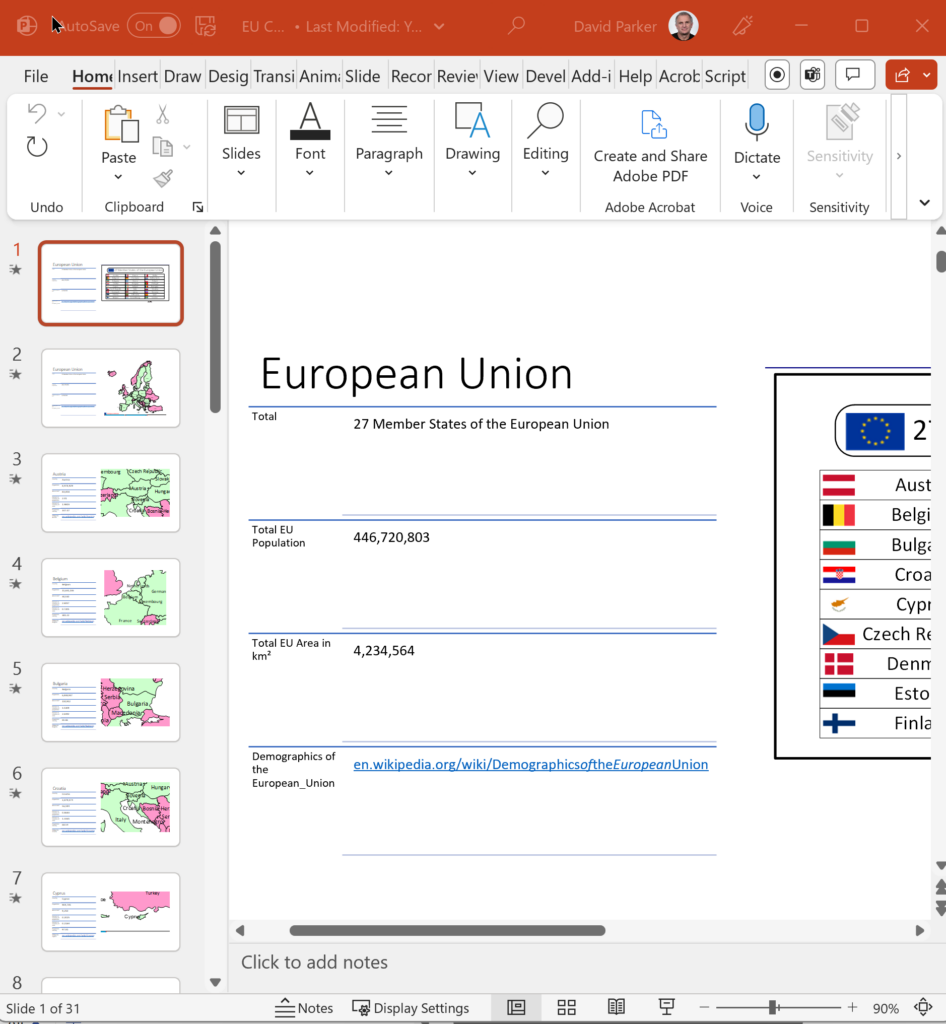
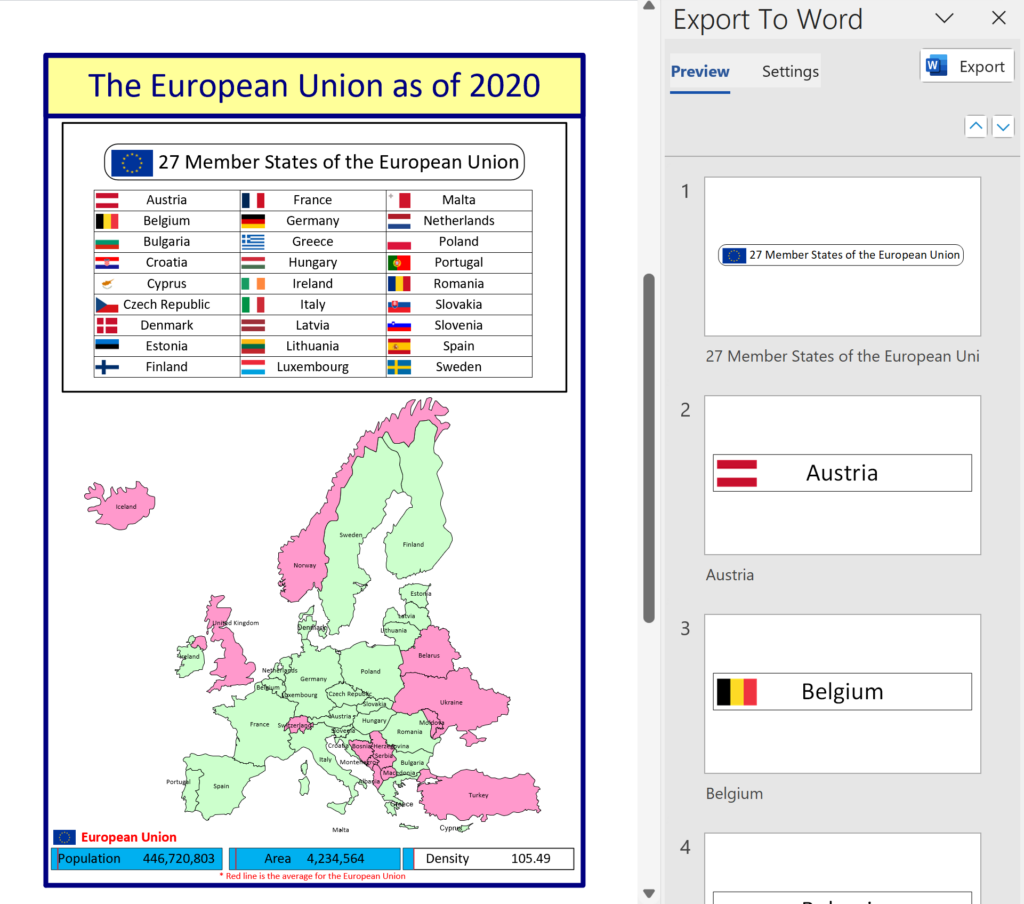
I was recently contacted by a reader, Stanley M. Max (Towson University lecturer), who had started creating a Visio map of the 27 countries in the European Union in 2020, along with the demographics culled from Wikipedia. He wanted to know if the map and stats could be combined to make a more appealing presentation. Well, that prompted me to not only combine the data and country shapes, but to explore ways in which a presentation of the map can be made more interesting in Visio. So, I added data and hyperlinks to the shapes, and set up a page property for the selected country which automatically highlights the country shape, statistics, and header, to which I added flags. So, the user can either set the page country using the Shape Data window for the page, or context menu of each country, or simply by double-clicking.
[Read more…] about Interactive Demographics of the European Union in VisioPushing Data Visualizer in Visio beyond its limits
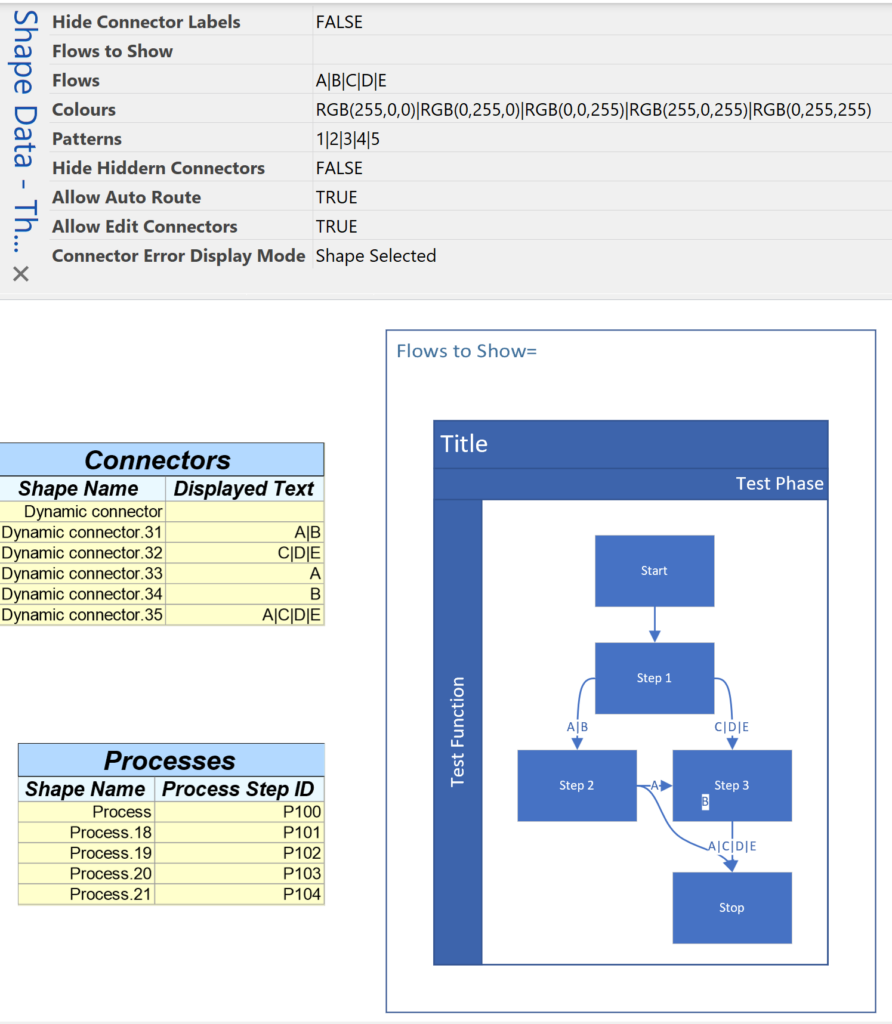
My last post was about some of the lessons learnt when trying to push Data Visualizer to its limits, but this one has some ways of overcoming these limitations. The main lesson learnt is that DV binds the shapes within the DV container shape, CFF Data Visualizer, and controls some of the ShapeSheet cells that are normally available for customization. The label of the connector is bound to the respective column in the Excel table, and that, combined with the ability to modify the Dynamic connector master shape provides a way of overcoming some of the limitations discovered.
So, given that we want to use DV, and we need to have multiple flows between the same shapes, then they cannot be separate connectors. We need to combine multiple flows onto the same connector, and then find a way to selectively display different flows somehow by controlling the visibility of the connectors. However, we cannot make them invisible because they will be deleted by DV, so we need to control their transparency instead. We can do this by interpreting the label somehow, and we are going to modify the Dynamic connector to react to the text of the label, and we can also change the colour and line pattern too.
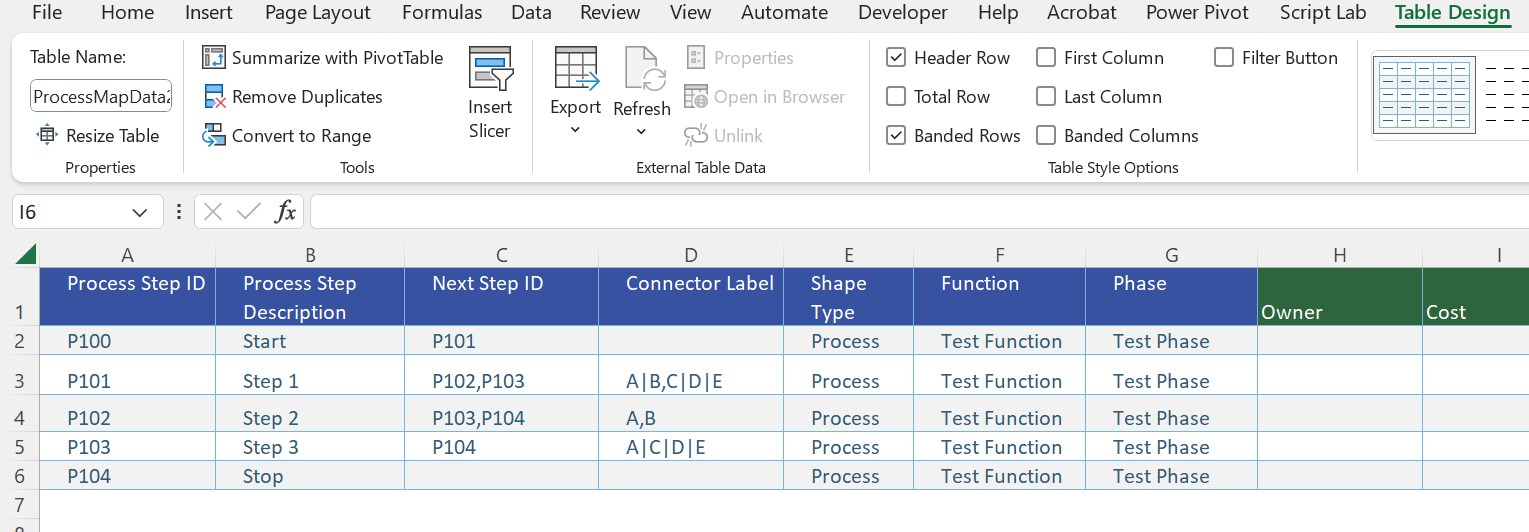
The following screenshots show the Excel table with the multiple flows between the same shapes concatenated with pipe characters, and the diagram created by Data Visualizer when this table is imported into a custom template using Data \ Create from Data \ Create:
[Read more…] about Pushing Data Visualizer in Visio beyond its limits