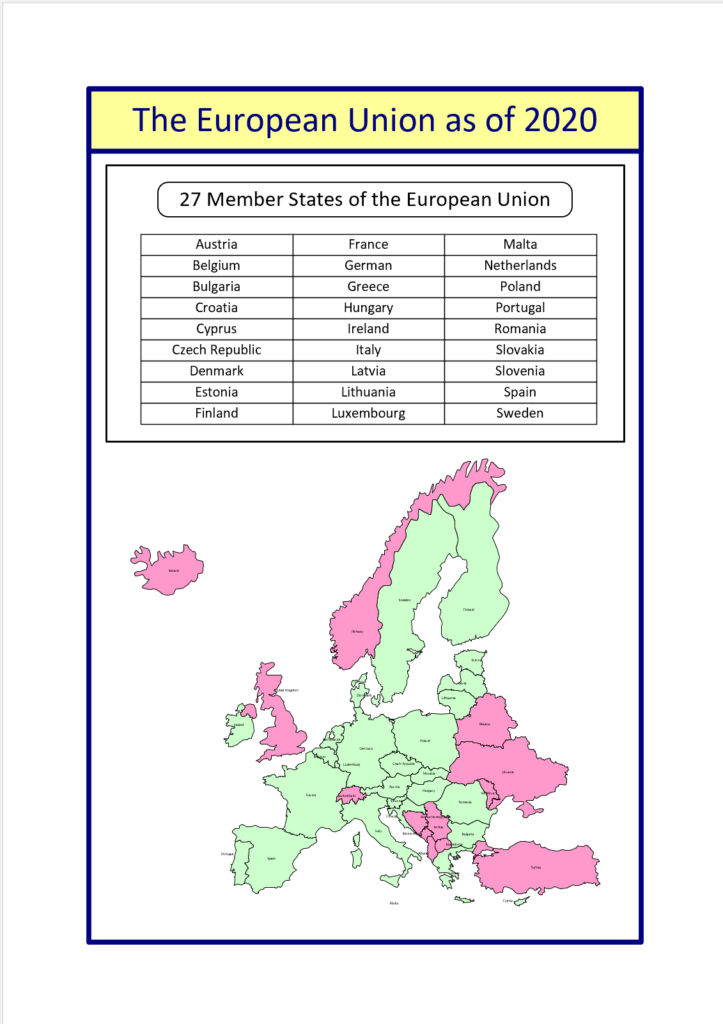
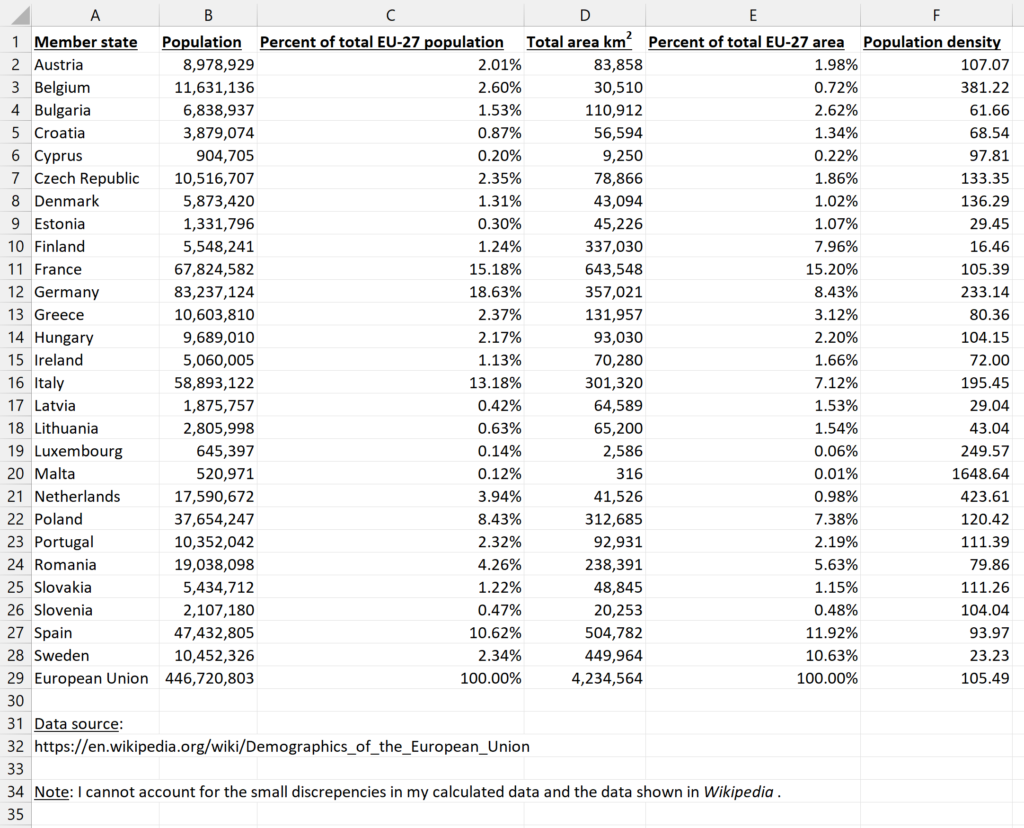
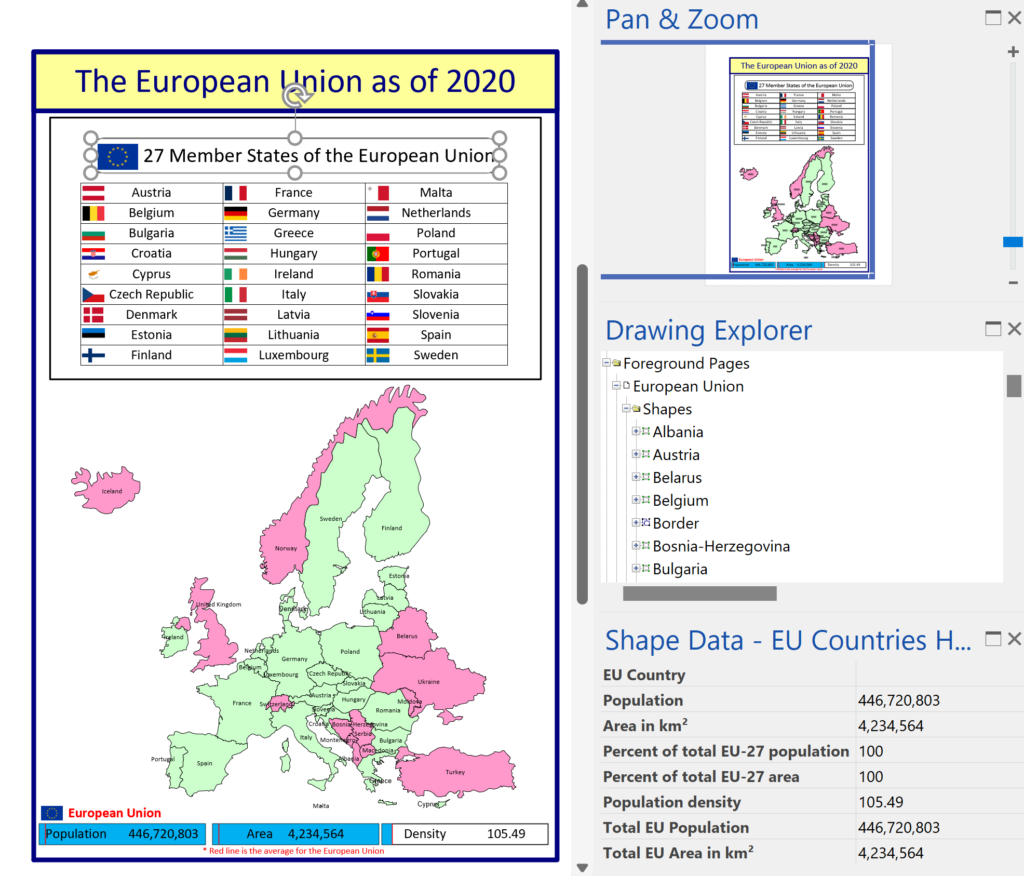
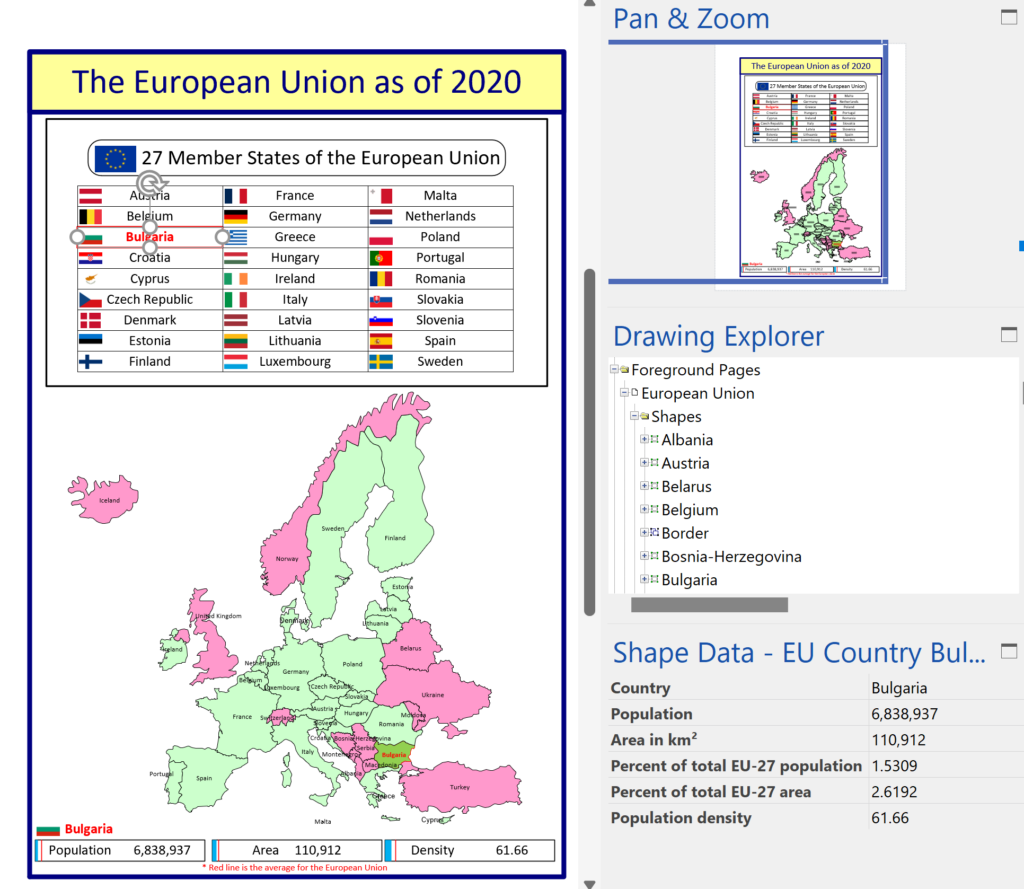
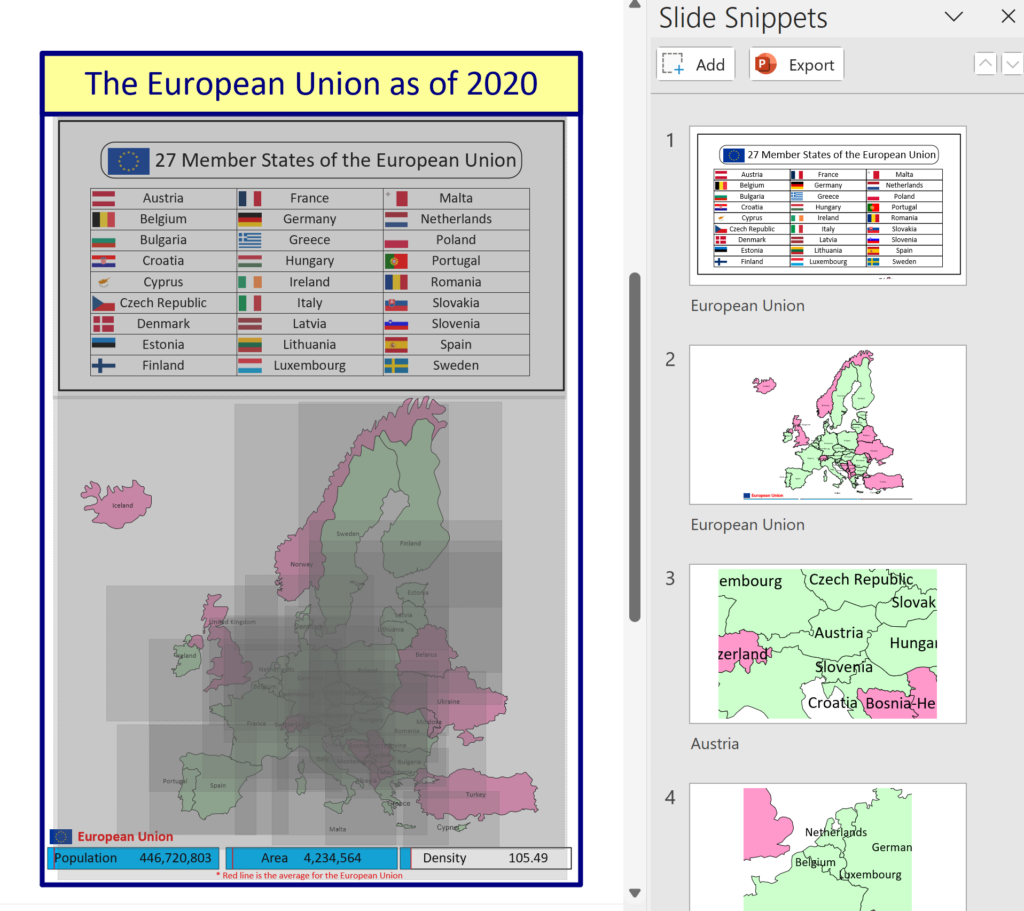
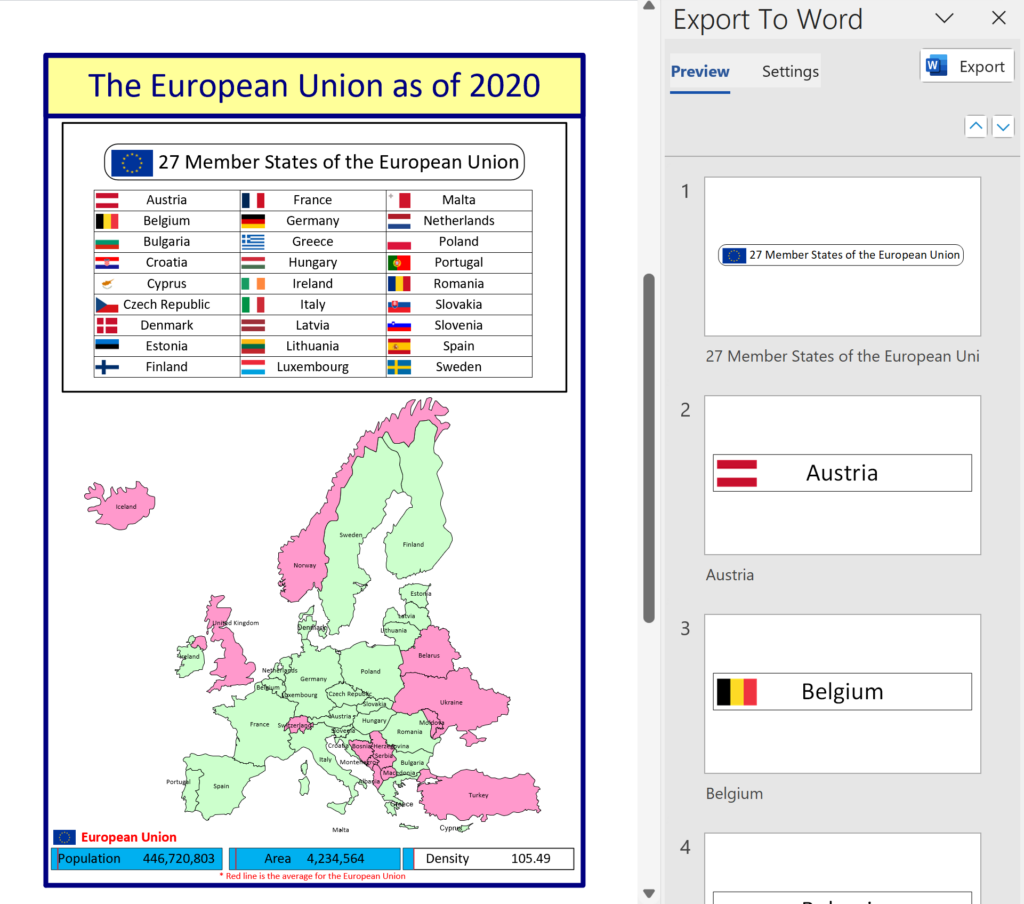
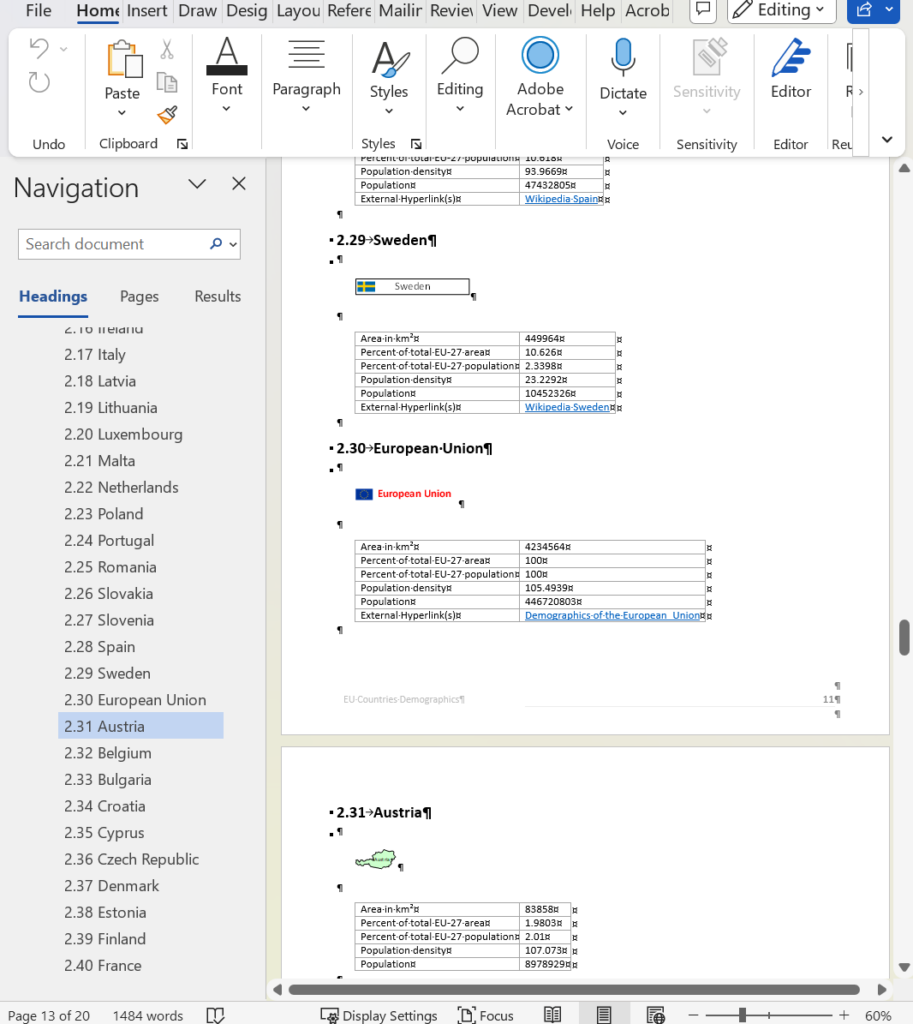
I was recently contacted by a reader, Stanley M. Max (Towson University lecturer), who had started creating a Visio map of the 27 countries in the European Union in 2020, along with the demographics culled from Wikipedia. He wanted to know if the map and stats could be combined to make a more appealing presentation. Well, that prompted me to not only combine the data and country shapes, but to explore ways in which a presentation of the map can be made more interesting in Visio. So, I added data and hyperlinks to the shapes, and set up a page property for the selected country which automatically highlights the country shape, statistics, and header, to which I added flags. So, the user can either set the page country using the Shape Data window for the page, or context menu of each country, or simply by double-clicking.
[Read more…] about Interactive Demographics of the European Union in VisioPowerPoint
Binding Visio and Excel with Data Visualizer
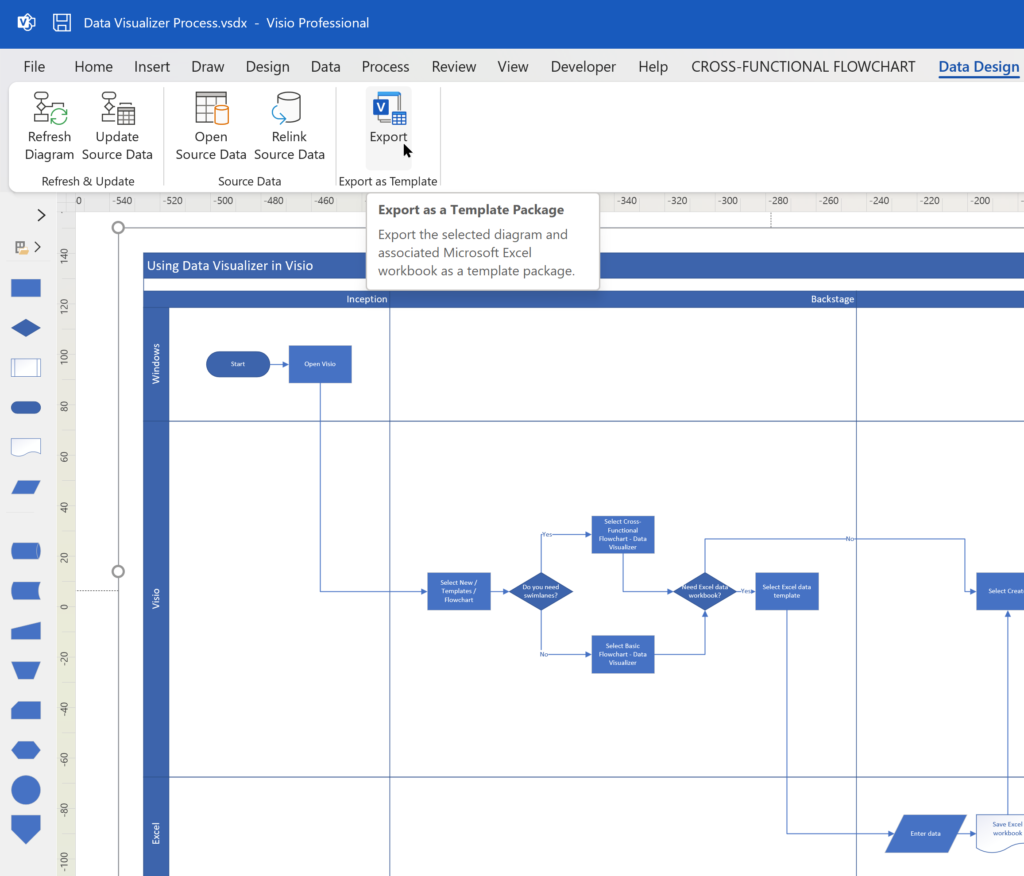
I re-vamped some of my content about the Visio Data Visualizer add-in for Excel in my last post, so I thought I should expand a bit more on the Data Visualizer feature in Visio for Desktop (Visio Plan 2) and Excel for Desktop. I have described it in detail in previous posts, but I never published the process diagram I created for the Data Visualizer Wizard in Visio. So, I thought I would use it to demonstrate a few cool features of Visio for Desktop.

Manual Fix for Slide Snippets in Visio Plan 2
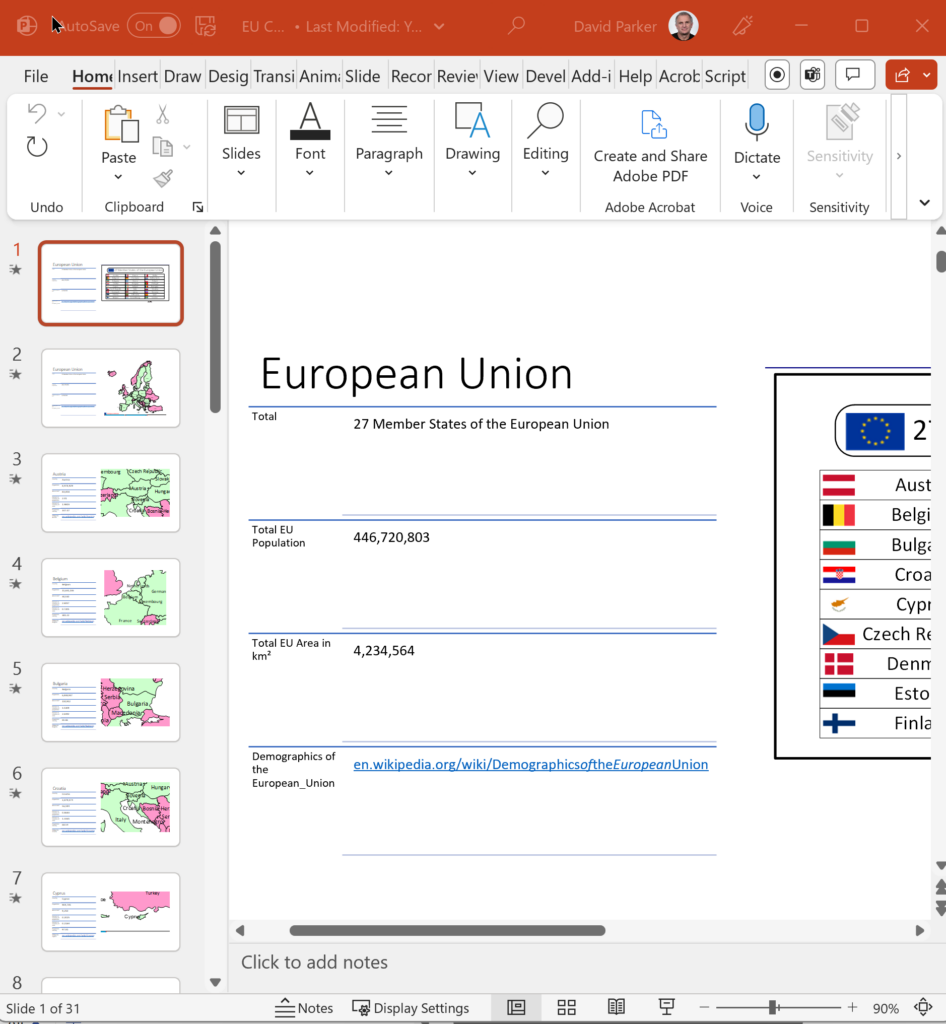
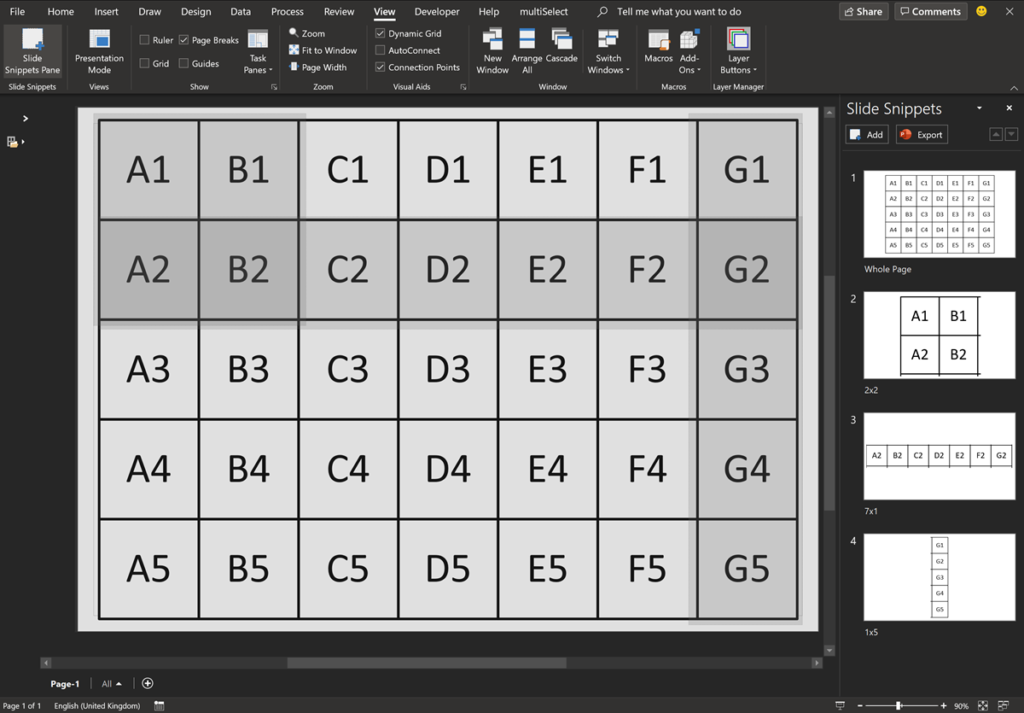
Microsoft Visio Plan 2 has a cool feature, Slide Snippets, that can create a PowerPoint slide show from special rectangle shapes placed around the pages of a Visio document. Unfortunately, there is currently an issue with distortion of the images in PowerPoint, so I will show how this can be fixed manually…