Visio desktop has multiple ways to specify the folder where docked stencils can be found, but, as far as I am aware, Visio for the Web only has one. I mostly create VSTO add-ins for Visio desktop, and I use Visio desktop as a studio for creating templates for Visio for the Web. Often, I leave the Document Stencil in the template open because users can then drag and drop from there, but when I create an installation with custom stencils then they normally go into the application folder, or a sub-folder of it. An alternative is to install them into the My Shapes folder in the users desktop Documents folder. These will appear in the Visio desktop UI. Also, there is the ability to set the Stencils folder using File | Options | Advanced | File Locations. Finally, the desktop edition will always first check the folder that the Visio document is in for any docked stencils. Visio for the Web does not have all these options, so how do you get any custom docked stencils to appear when you use Visio for the Web to edit a document?
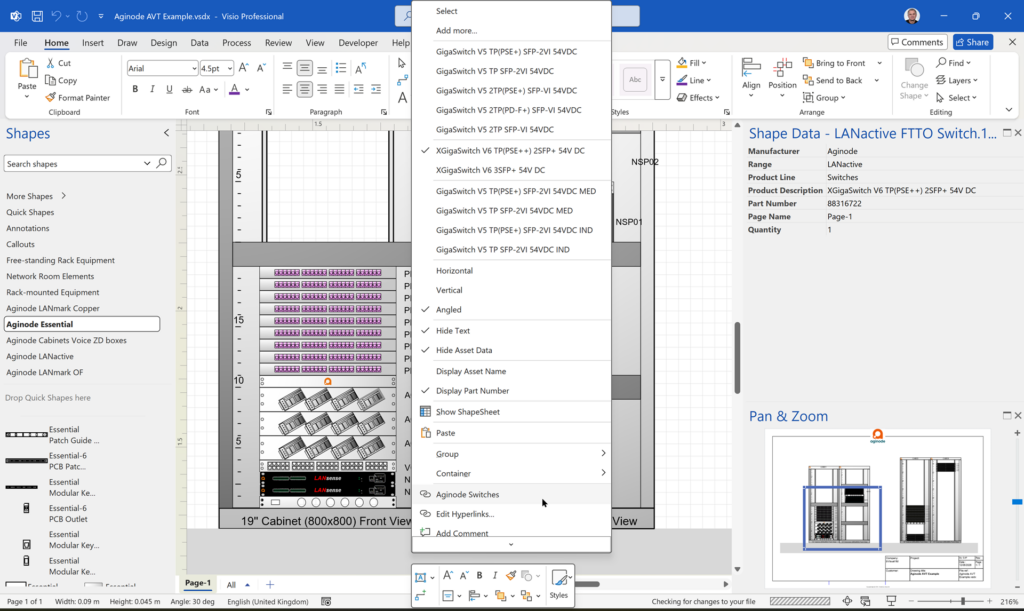
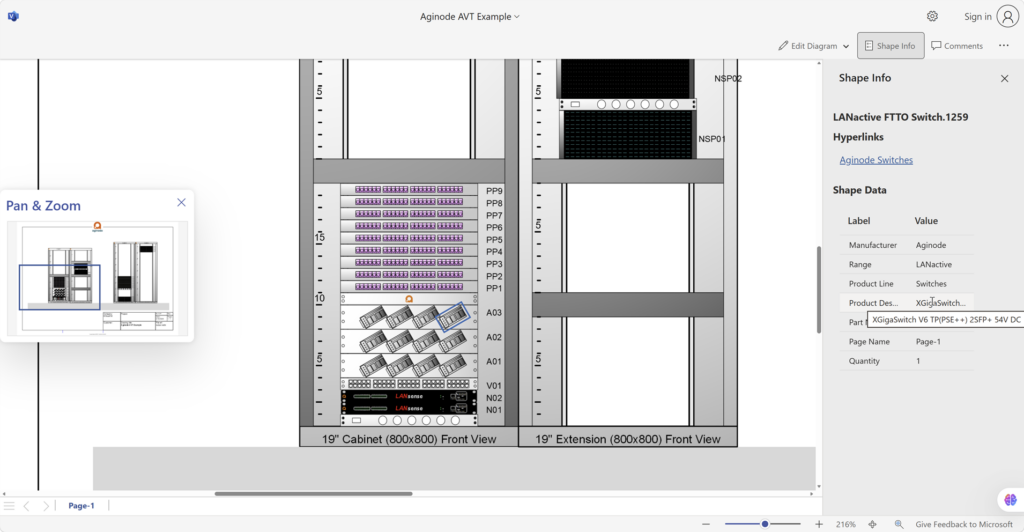
Docked Stencils in Visio for the Web
[Read more…] about Docked Stencils in Visio for the Web