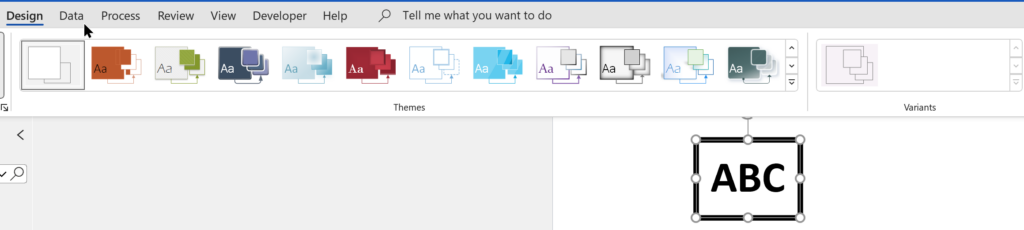
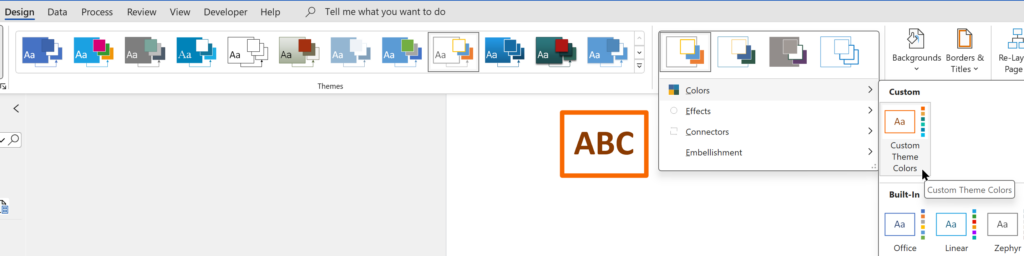
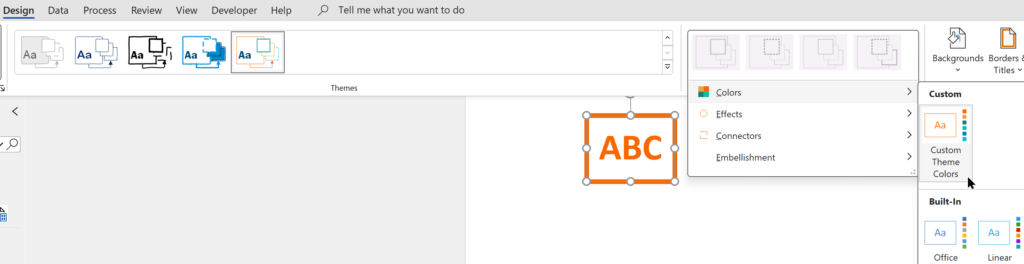
I was recently looking into custom color themes for corporate branding in desktop Microsoft Visio and became re-aware how different Visio still is from the rest of the Microsoft Office applications. A Visio page or document does not need to have any theme applied, but the documents of the other Office applications always have a theme. This means that custom theme colors are not available in Visio until a theme is selected, because custom theme colors rare a variation of a theme. This should not be necessary all the time, so I tried to produce a way of having an approved swatch of colours in a document, from which the individual colors can be copied.
[Read more…] about Custom Color Themes in Visio?Color
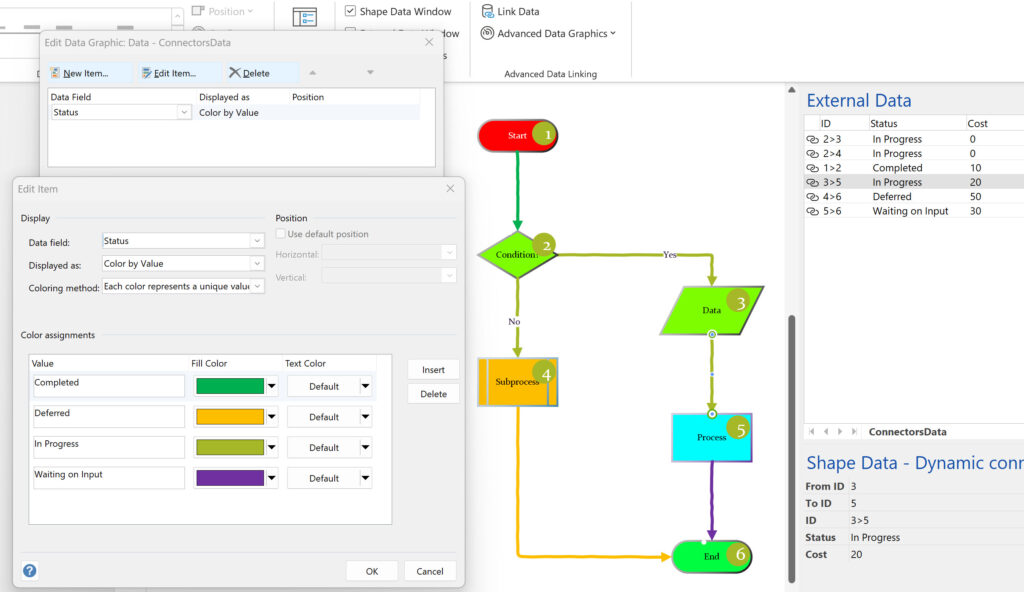
Using Visio Color by Value on Connectors
Data Graphics in Visio Plan 2 and Visio Professional is great, but it only enables us to use them with 2D shapes in Visio, i.e. not on connectors. So, what if you want to change the line colour of the connectors between the 2D shapes because of the data flowing between them? Well, it is possible … with a little preparation!
Testing Regional Settings in Visio
There are times that I have been caught out by assuming that everyone speaks “proper” English, like what I do (sic), and forgetting that there are other languages with their own formatting conventions. I think most of the world is bemused at the USA date format where they put the month before the day and the year. So illogical to everyone else, and I can’t help thinking that it was done on purpose just to catch us Brits out, like when they decided to drive on the wrong side of the road just to make it more difficult to sell cars across the border. It seems that some parts of Visio get confused if I enter the dates in the correct “dd/mm/yyyy” format, so I now type dates in the “d mmm yyyy” format in the Shape Data window calendar control because, at least, that always works. Also Visio‘s internal units are inches, and every time I see it referred to as US Units, rather than the Imperial Units that I grew up with, makes me think “so, this is what it has come to!”.
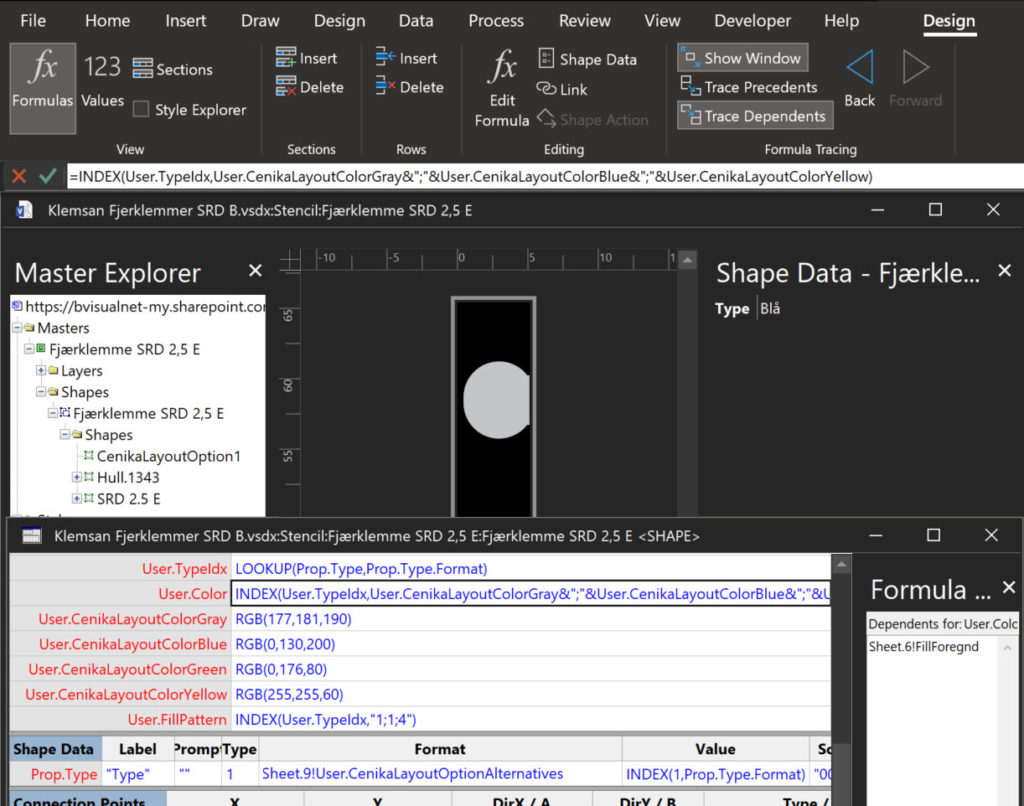
So today I was embarrassed by a Norwegian client because I forgot (again) to take extra care when using the RGB(…) function. The result was that the displayed colours were appearing black in Norwegian (and doubtless many other languages), but correctly grey (gray if you are in the USA), blue, green and yellow in English (both UK and US).
[Read more…] about Testing Regional Settings in Visio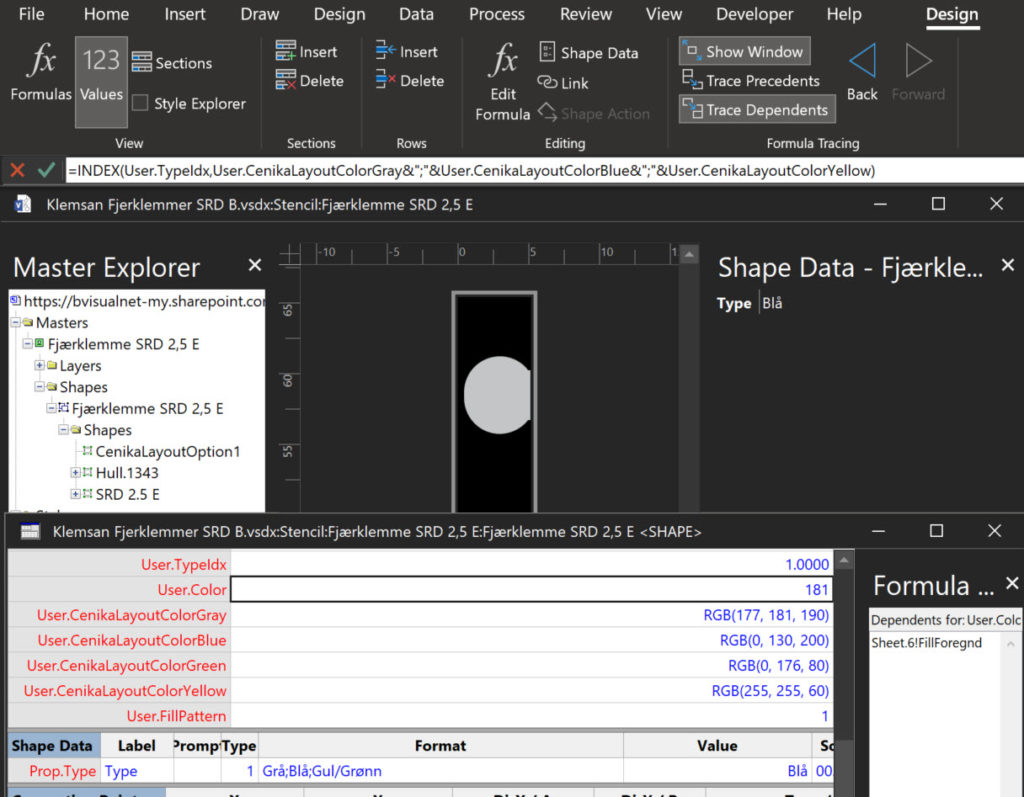
Testing Visio shape text for WCAG 2.0 pass
The Web Content Access Guidelines (WCAG) 2.0 provides the current recommendations for making web content accessible to users with vision impairment, but how do you test if your Visio shapes pass? There are several web sites out there that provide this capability, but all of them require the HEX values, rather than the RGB or HSL that Visio provides natively. Therefore, I have created a Visio callout shape that can be associated with a target shape to report on the values of each of its main color elements and provides hyperlinks to automatically check the contrast ratio on WebAIM.
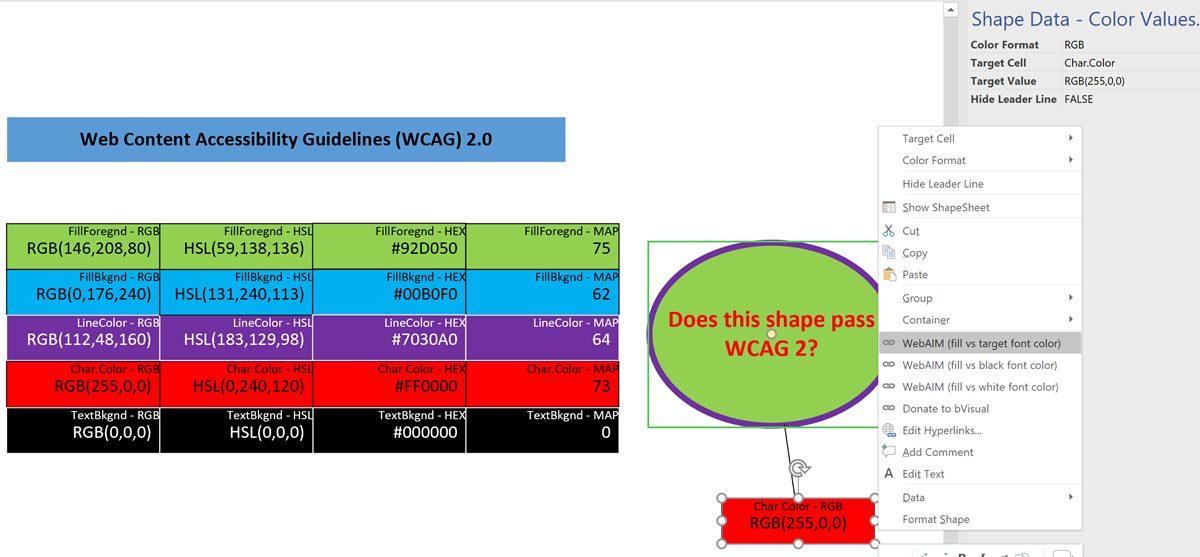
The colour formats that can be selected from either the Shape Data window or the right mouse menu are:
Formatting SharePoint Columns with RGB Color
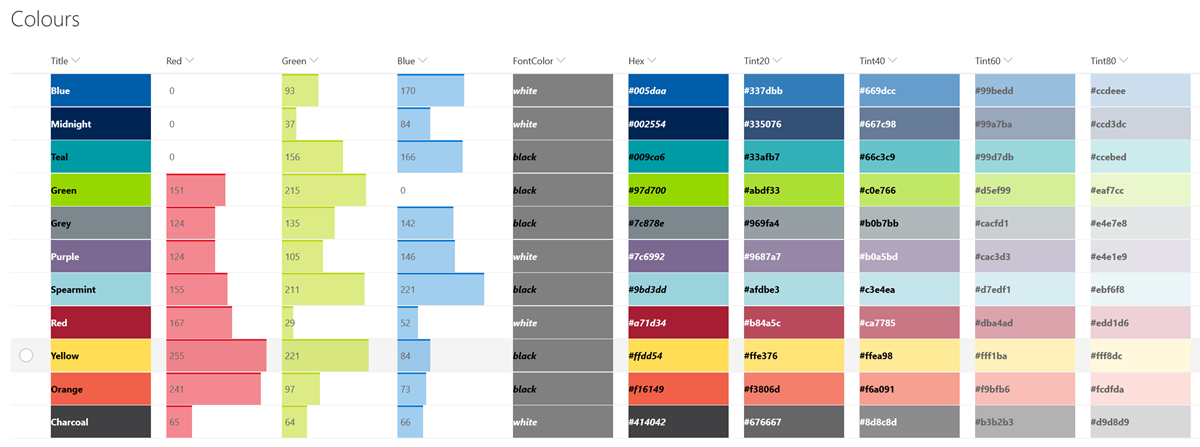
I wrote about ensuring high contrast between text and the background of Visio shapes in my last article. The RGB values actually came from an imported SharePoint list that has a lookup to a list that contains the RGB values of named colours. Having solved how to display the correct text colour for high contrast in Visio, I wanted to the same in a SharePoint column, but first I had to learn how to use the RGB values to format the background colour.
My good friend Chris Roth, aka VisGuy, has already produced Visio ShapeSheet formulas to convert RGB values to Hex values. so I adaptively re-used his idea to create a formula that I could use in a SharePoint calculated column, called Hex.
First, I compressed his multiple User-defined Cells rows into a single formula:
Ensuring High Contrast Text in Visio Shapes
I am working on a project where I need to ensure high contrast of the text in the Visio shapes for accessibility. At first, I attempted to write my own formula but a colleague pointed my to a website that confirms if the contrast is acceptable ( contrast-ratio.com ), and showed me that a few of my examples failed. So the search was on for a better formula than my own. This lead me to a Stack Exchange answer with just what I was looking for (Formula for Color Contrast between Text and Background). All I needed to do was to convert this into a ShapeSheet formula or two, and then I could apply it to the text inside the shapes.
Any text created with Data Graphic Text Callouts cannot have the high contrast formula applied to because they can be moved independent of the background. However any text added with Insert / Field inside the shape changes between black and white with respect to the FillForegnd value in its background.
Following the article above, it is necessary to calculate the lightness, L, of the FillForegnd, and then to check if black or white text is going to provide satisfactory contrast.