Microsoft Visio is the leading business diagramming application worldwide, and is part of the Office 365 eco-system. It therefore has all of the document management and security credentials that goes with Microsoft 365 environment. But Visio is much more than just diagramming because it is a complete data visualization application, due to its smart shapes and programming interface. All of Visio shapes are controlled by their ShapeSheet, which contains formulas just like a worksheet in Excel, and can be edited in much the same way. If that is not enough, then there are application programmers interfaces (API) that can be utilised in Visio add-ins and applications, and even in web pages.
Custom Visio templates can speed up productivity dramatically, and really embody your business requirements and corporate branding.
Visio documents and shapes can be linked to data so that they always reflect the one truth by automatically updating the text, icons, databars, colors, and more, if necessary.
This will enable you to visualize your business in an intelligent and insightful way, that has never been previously possible. We can show you how to ensure that you are creating and utilizing these Visio data graphics in the most efficient manner.
Visio for Web can now be integrated in SharePoint pages or Teams to ensure that everybody can benefit from a visual interactive dashboard.
Latest blog articles about Visio
Docked Stencils in Visio for the Web
Visio desktop has multiple ways to specify the folder where docked stencils can be found, but, as far as I am aware, Visio for the Web only has one. I mostly create VSTO add-ins for Visio desktop, and I use Visio desktop as a studio for creating templates for Visio for the Web. Often, I…
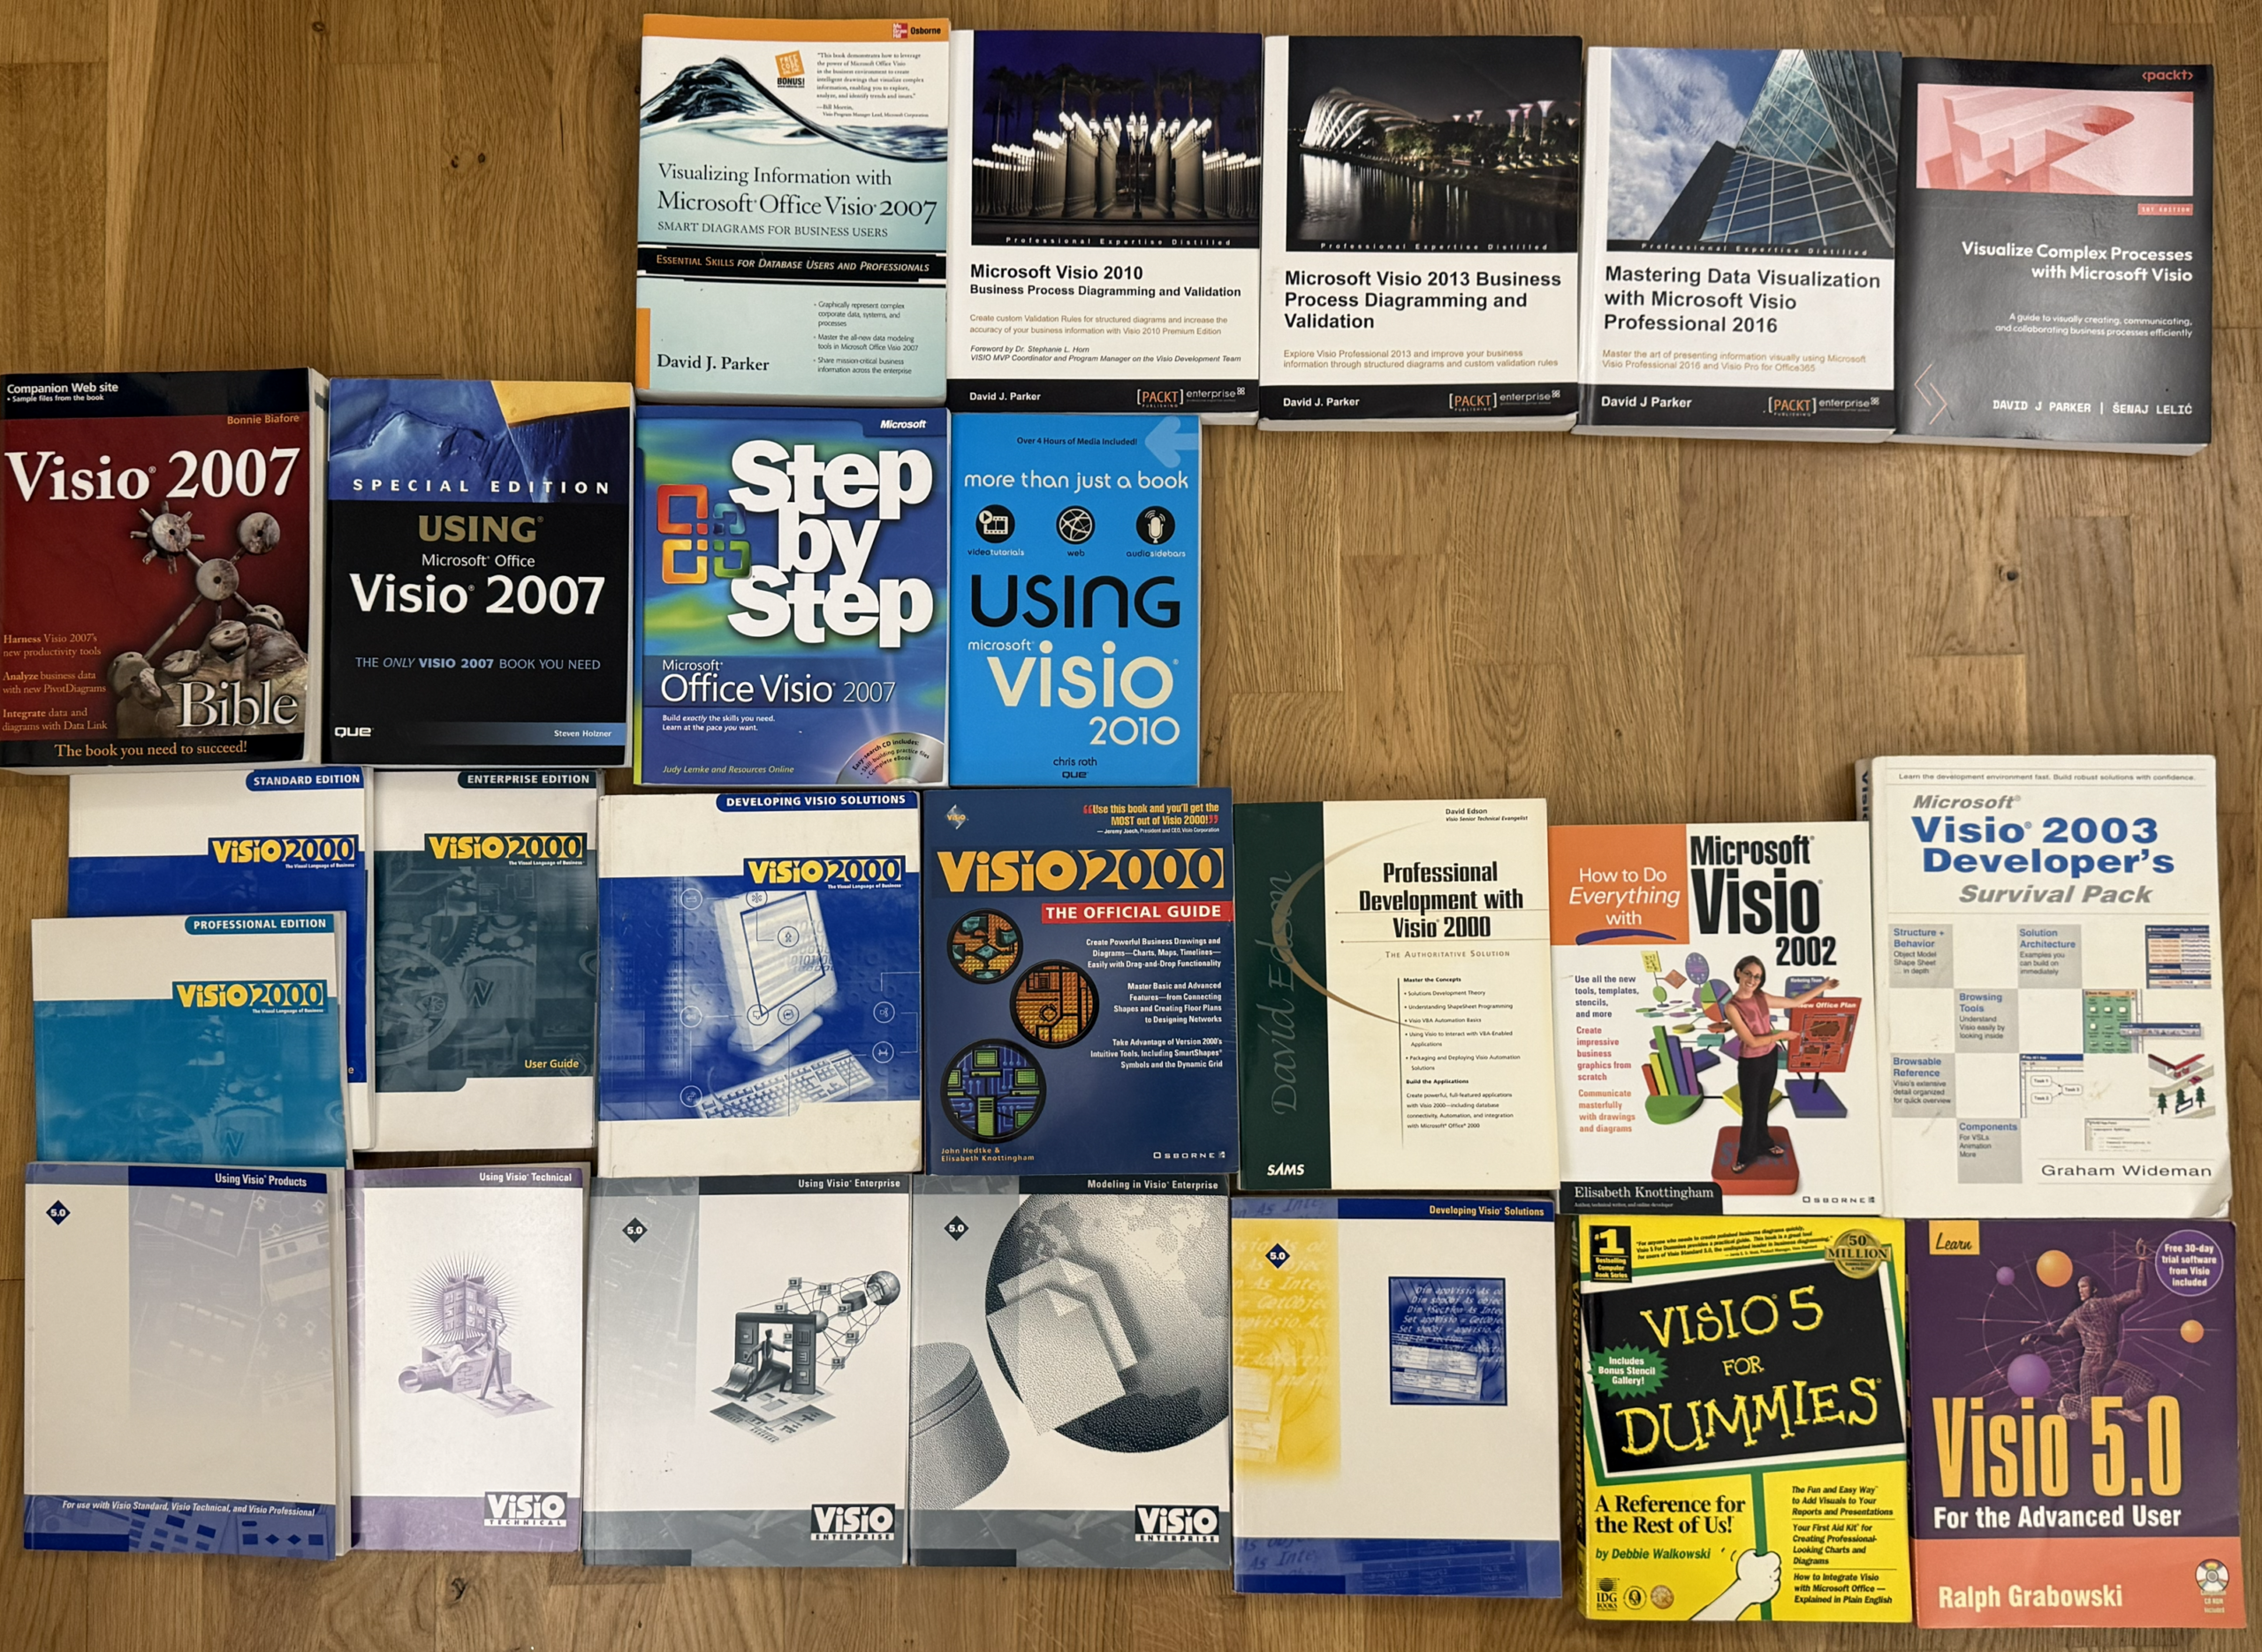
My Visio Books and Old pre-C# Work
We, as a family, are in the process of de-cluttering our house for hopefully a move closer to the south coast, so I decided to take a photo of my Visio books collection, and as you can see, back in the mid-1990’s, I started reading and learning from other peoples works, and then progressed to…

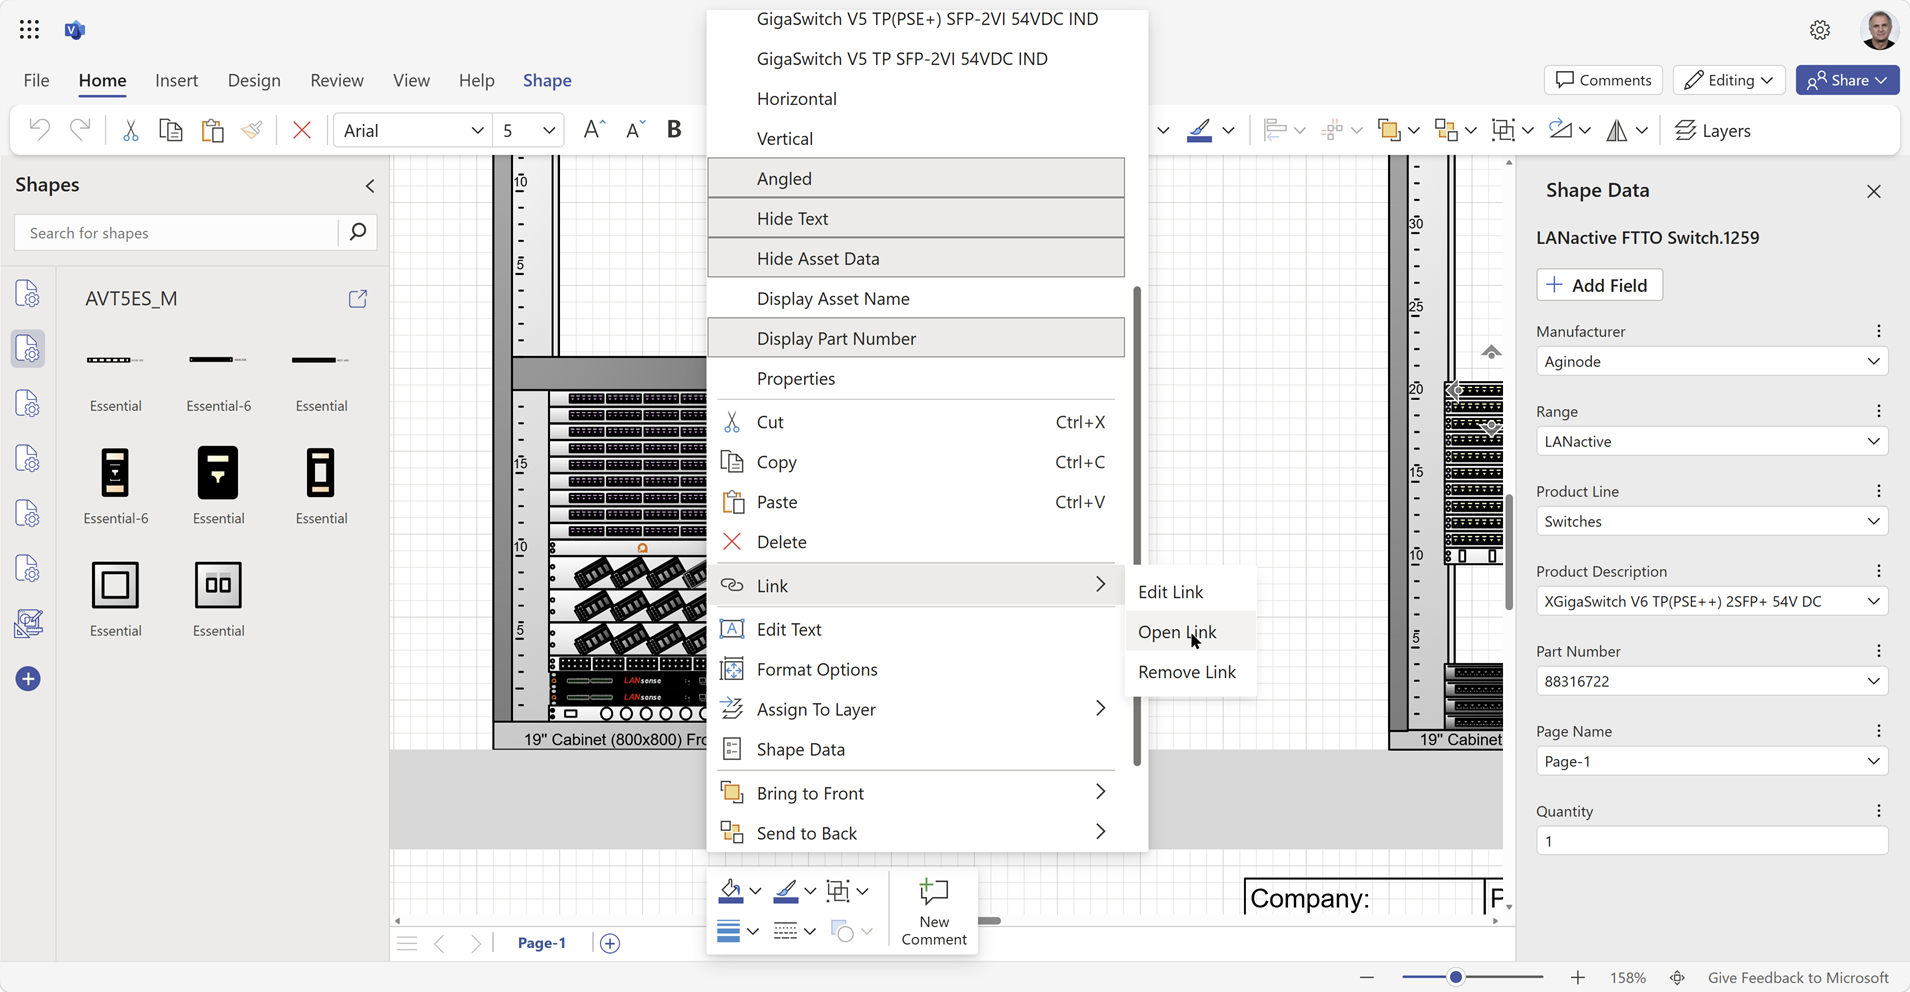
Creating Boolean Context Menus in Visio
Over the many, many years that I have been creating Microsoft Visio solutions, I have had to create numerous right-mouse context menus for shapes to control their Shape Data values. Over that time, patterns emerge, so this article is highlighting three different appearances for simple Boolean values, otherwise known as True/False or Yes/No values, and…

A visual exploration of Penrose Tiling in Visio
Maybe it is because I used to be a building architect, but I have always been fascinated by the relationship between numbers and visualisations. Perhaps the most famous one is the Golden Ratio which has been used as the basis of many building designs and art pieces. It is often recognised to create a harmony…
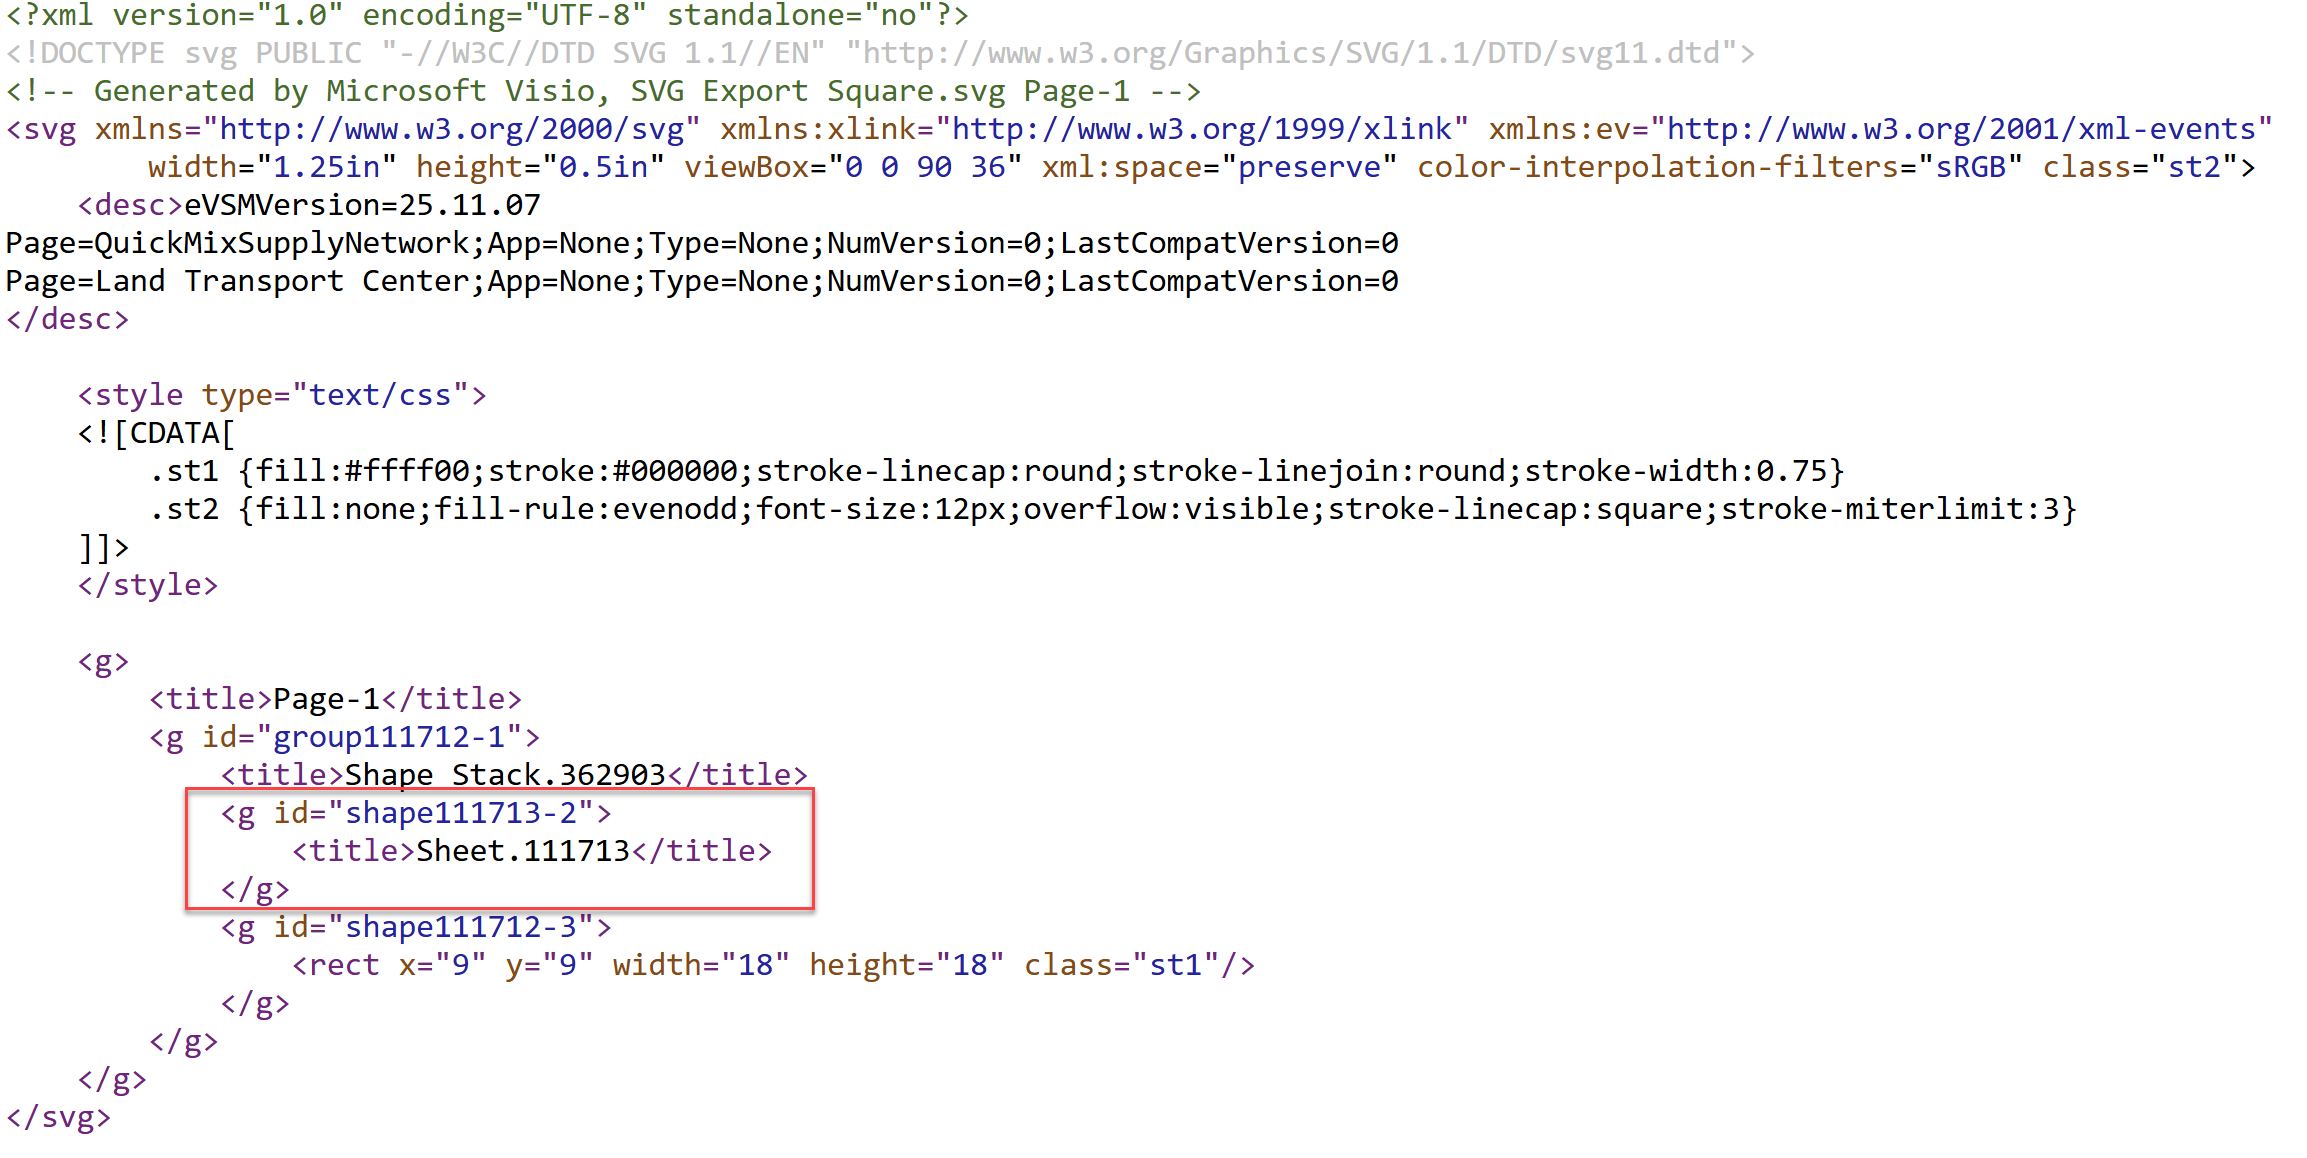
How SVG in Visio can cause a Shape.BoundingBox(…) error
I have used Visio’s Shape.BoundingBox(…) for many, many years and I cannot ever recall it failing, but I have now managed to create some shapes that cause it to error. This caused many hours of confusion, so I nearly abandoned using the method, until I discussed it with my fellow Visio MVP, John Goldsmith (see…

Post-Processing Paste from Clipboard in Visio
One of my current Visio VSTO add-in projects requires me to react to users pasting custom shapes in the Visio page from the clipboard. The process involves registering the ExitScope event and then checking the Clipboard contents. Initially, I was merely testing for a line in the DataObject that started with the word “Visio “,…