I have been creating Microsoft Visio solutions for 30 years now … my first was in 1996! I have been an advocate for custom Masters from the very start, every since I learnt how editing the Master can automatically update all of its instance shapes can be automatically updated throughout the document. Whenever you drag and drop a Master from a Stencil into a document for the first time, it copies that Master to the Document Stencil, and from then on it will use the local Master in the Document Stencil to create new shape instances that reference the local Master. If you need to customise the local Master, then you should ensure that the Match master by name on drop is checked. All of the provided stencils contain Masters where this property is not checked. The main exception to this is the Dynamic connector Master. Not only is this Master provided with this property checked, it is also automatically created when you do certain actions. This article explains when this is done in the UI and in code.
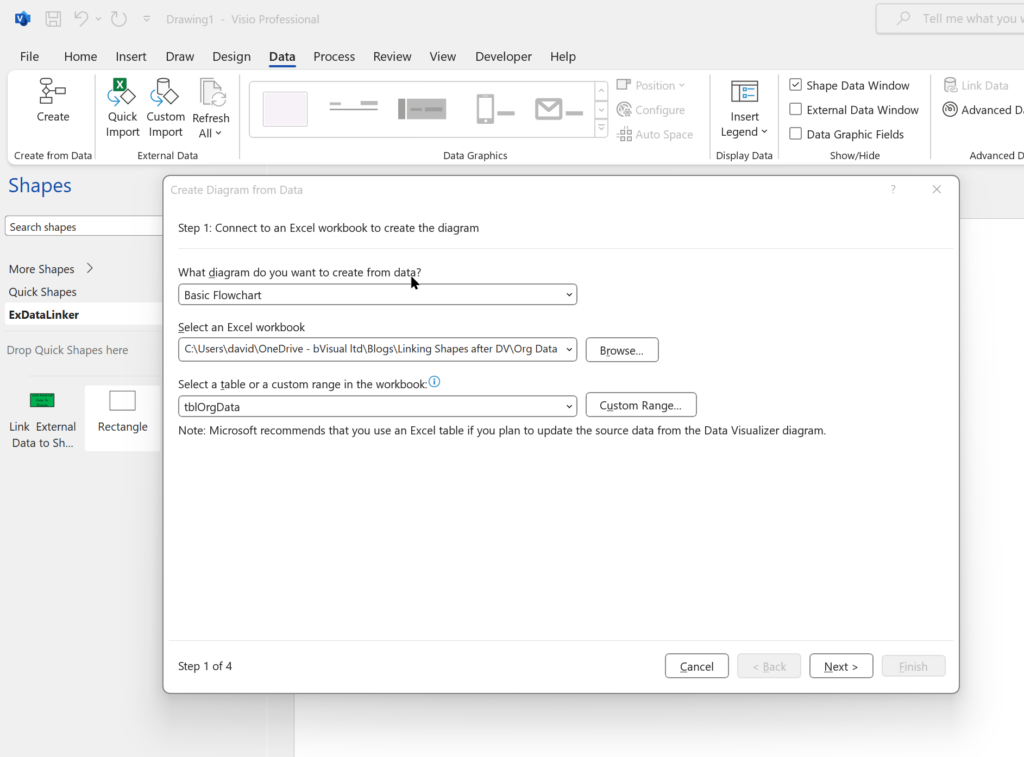
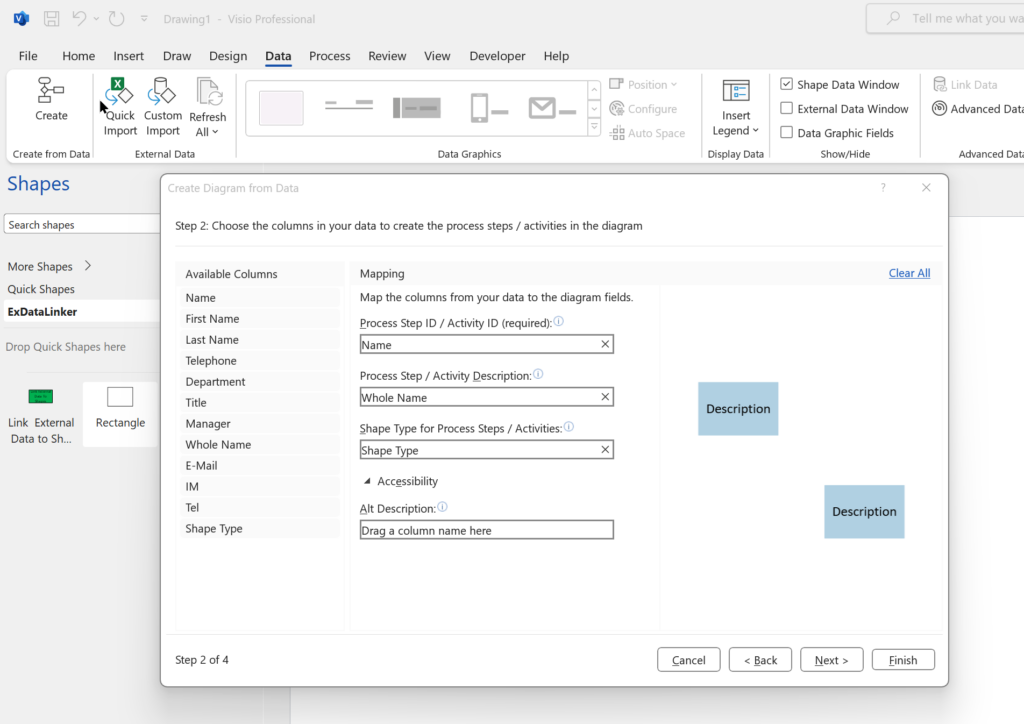
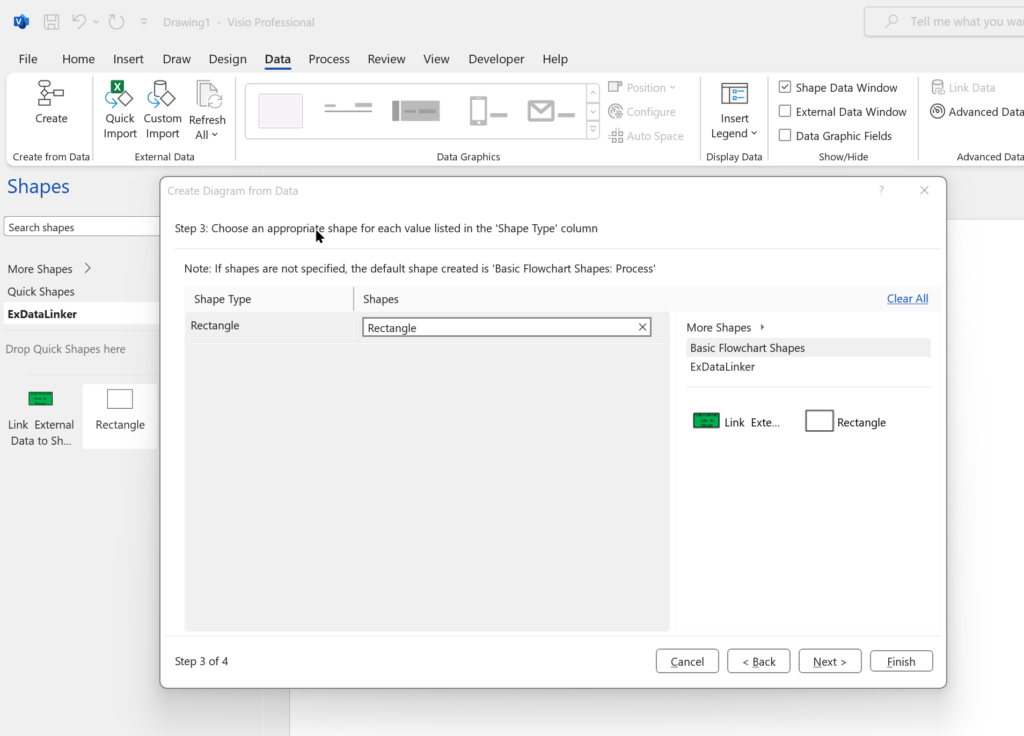
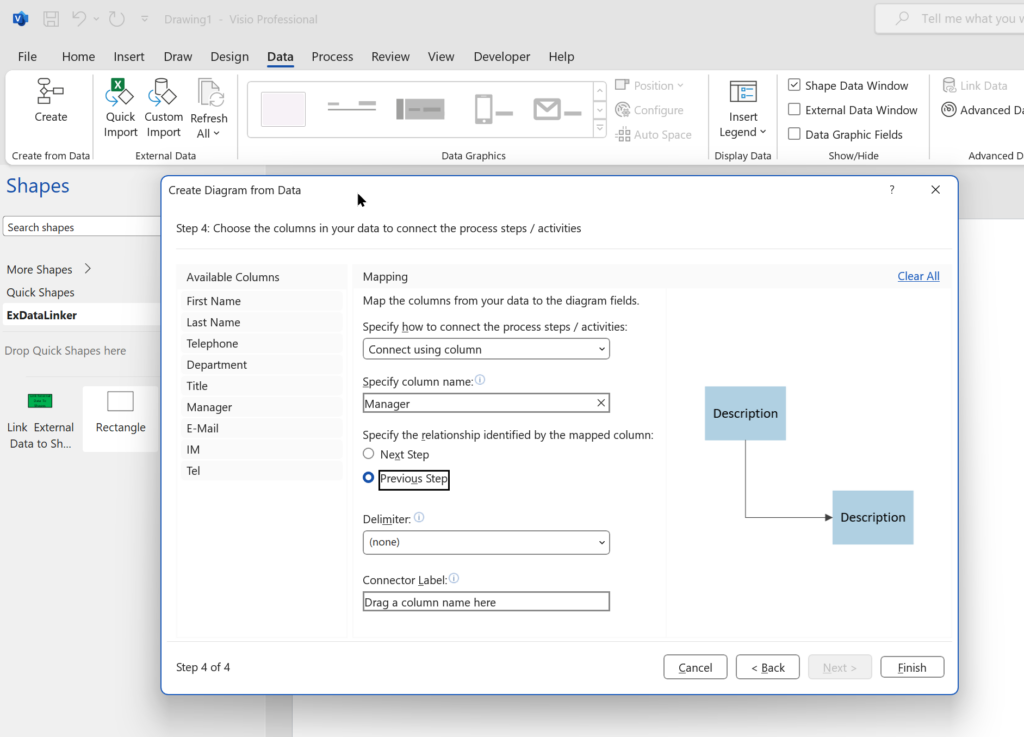
Creating a Dynamic connector master automatically
[Read more…] about Creating a Dynamic connector master automatically