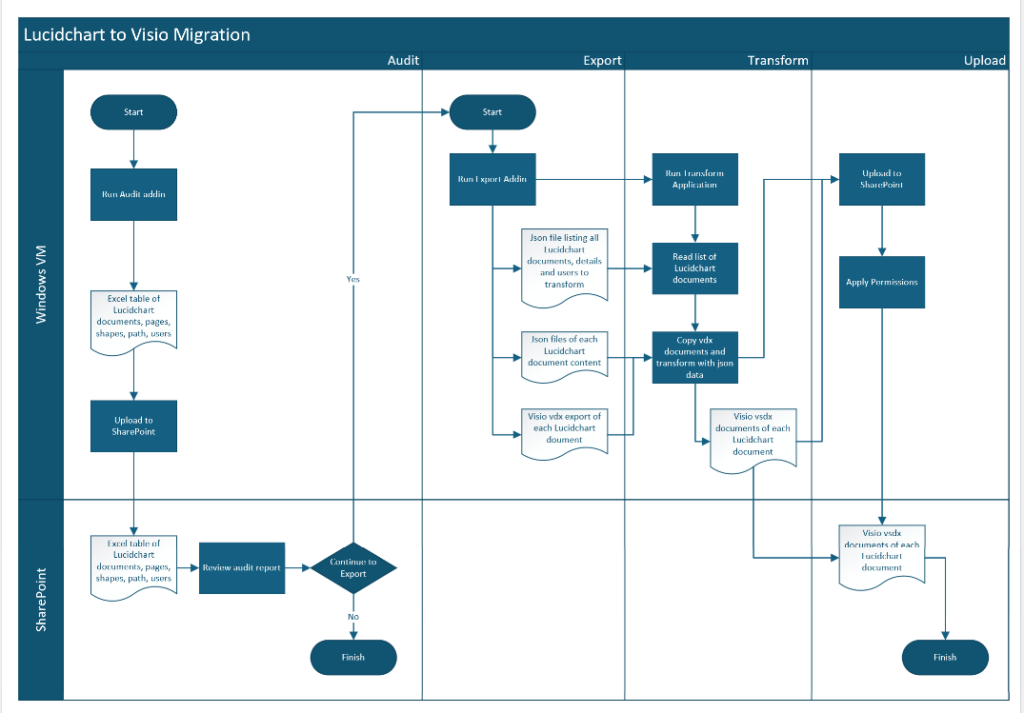
• Skip to main content
  • Skip to primary sidebar
  • Skip to footer

bVisual

  • Home
  • Services
    • How Visio smartness can help your business
    • Visio visual in Power BI
    • Visio Consulting Services
    • Visio Bureau Services
    • Visio Training and Support Services
  • Products
    • Visio Shape Report Converter
    • SS Plus
    • LayerManager
    • visViewer
    • Metro Icons
    • Rules Tools for Visio
    • The Visio 2010 Sessions App
    • Multi-Language Text for Visio
    • Document Imager for Visio
    • multiSelect for Visio
    • pdSelect for Visio
  • Case Studies
    • Case studies overview
    • Visualizing Construction Project Schedules
    • Visio Online Business Process Mapping
    • Nexans Visio Template
    • CNEE Projects, WorldCom
    • Chase Manhattan Bank
  • News
    • Recent news
    • News archive
  • Resources
    • Articles➡
      • ShapeSheet Functions A-Z
      • Comparing Visio for the Web and Desktop
      • Customising Visio Shapes for the Web App
      • Key differences between the Visio desktop and web apps
      • Using the Visio Data Visualizer in Excel
      • Using Visio in Teams
      • Creating Visio Tabs and Apps for Teams with SharePoint Framework (SPFx)
      • Designing Power Automate Flows with Microsoft Visio
      • Innovative uses of Visio Lists
    • Webcasts ➡
      • Visio in Organizations
      • My session and other Visio sessions at MSIgnite 2019
      • Power up your Visio diagrams
      • Vision up your Visio diagrams
      • The Visio 2010 MVP Sessions
    • Visio Web Learning Resources
    • Books➡
      • Mastering Data Visualization with Microsoft Visio
      • Microsoft Visio Business Process Diagramming and Validation
      • Visualizing Information with Microsoft Visio
  • Blog
    • Browse blog articles
    • Visio Power BI articles
    • Visio for Web articles
    • A history of messaging and encryption
  • About us
    • About bVisual
    • Testimonials
    • Bio of David Parker
    • Contact Us
    • Website Privacy Policy
    • Website terms and conditions
    • Ariba Network

Connectors

Published on January 9, 2023 by David Parker

Pushing Data Visualizer in Visio beyond its limits

My last post was about some of the lessons learnt when trying to push Data Visualizer to its limits, but this one has some ways of overcoming these limitations. The main lesson learnt is that DV binds the shapes within the DV container shape, CFF Data Visualizer, and controls some of the ShapeSheet cells that are normally available for customization. The label of the connector is bound to the respective column in the Excel table, and that, combined with the ability to modify the Dynamic connector master shape provides a way of overcoming some of the limitations discovered.

So, given that we want to use DV, and we need to have multiple flows between the same shapes, then they cannot be separate connectors. We need to combine multiple flows onto the same connector, and then find a way to selectively display different flows somehow by controlling the visibility of the connectors. However, we cannot make them invisible because they will be deleted by DV, so we need to control their transparency instead. We can do this by interpreting the label somehow, and we are going to modify the Dynamic connector to react to the text of the label, and we can also change the colour and line pattern too.

The following screenshots show the Excel table with the multiple flows between the same shapes concatenated with pipe characters, and the diagram created by Data Visualizer when this table is imported into a custom template using Data \ Create from Data \ Create:

[Read more…] about Pushing Data Visualizer in Visio beyond its limits

Filed Under: Connectors, Data Visualizer, Shape Data, Shape Reports, ShapeSheet Formulas, Uncategorized, Visio Plan 2 Tagged With: Connectors, Data Visualizer, ShapeSheet Functions

Published on January 3, 2023 by David Parker

Pushing Data Visualizer in Visio to the limits!

Regular readers of my blog will know that I like to use the Data Visualizer (DV) in Visio Plan 2, but I recently tried to help a user who really decided to push it to the limits. In this scenario, there were multiple connections, but with different labels, being created between the same flowchart shapes, and the plea was how to make it work! Well, I experimented with this, and found that DV does not really work well in this way, and then proposed an alternative approach, which I will explain in this article.

First, I will show how it fails by setting up an Excel table that does contains multiple connections, but fails to update the labels consistently.

Excel Table with Multiple Links

Lesson 1: Export from Excel to Visio is not the same as Import to Visio from Excel

The following screenshot was created by clicking Table Design / External Table Data / Export / Export Table to Visio Diagram… in Excel for the above table, and then choosing the Cross-Functional Flowchart (horizontal) option.

Default Export to Visio Diagram from Excel

I then chose Hierarchy / Top to Bottom the Design / Layout / Re-Layout Page gallery, and created a simple Shape Report to see the text on each Dynamic connector shape. It was then clear that I had to manually change some of the connectors to use static rather than dynamic glue so that I could see them all.

  • Re-laid out and Curved Connectors
  • Manually adjusted to see all connectors

The following screenshot, however, was created by creating a new Cross-Functional Flowchart – Data Visualizer in Visio, then choosing the above Excel table.

As before, I then chose Hierarchy / Top to Bottom the Design / Layout / Re-Layout Page gallery and created a simple Shape Report to see the text on each Dynamic connector shape. Again, it was then clear that I had to manually change some of the connectors to use static rather than dynamic glue so that I could see them all. Unfortunately, Visio sometimes gets confused about which connector should have which label, and can get it wrong, as shown below, where the same label has been duplicated.

  • Re-laid out and Curved Connectors
  • Manually adjusted to see all connectors

These errors can occur in the export from Excel too. I have also seen instances where the connector label becomes uneditable in Visio.

Therefore, my conclusion is that DV cannot handle multiple connectors between the same shapes.

Also, the template used by the export to Visio from Excel is different to the one used by import from Excel in Visio.

Lesson 2: Making Connectors Invisible is not the Same as Making Lines 100% Transparent

I added extra connection points to the Process shape so that all the connectors could be spaced out, and I edited the labels back to what they should have been, so finally I could display the connections clearly in the following screenshot.

However, this diagram needs to be used to display the alternative routes between Process shapes, and the user wanted to make some connectors invisible so that the desired connectors are shown clearly. My first thought was to move some connectors to a different layer, and then make the new layer invisible.

Unfortunately, DV automatically deleted all the connectors that were assigned to a layer that was made invisible!

  • Assign B connectors to new layer
  • Make new layer invisible
  • DV automatically deletes the invisible connectors

So, the alternative is to assign this new layer to a colour, and make the colour 100% transparent!

  • Assign Bs to new layer
  • Assign a transparent colour to layer
  • Transparent connectors remain

So, my conclusion is to never assign any DV controlled shapes to a transparent layer!

Lesson 3: Even choosing Color By Value using Data Graphic Fields causes a re-layout

There are times when I want to manually adjust the layout because DV does not do it quite right … However, if I then choose to use Data Design / Refresh Diagram or simply select a field in the Data Graphic Fields panel, then DV will automatically re-layout the diagram, even if all I wanted was to have Color by Value. This is because the Data Graphic Field row selection will try to guess what Graphic Item you may want, and this will change all the data-linked shapes to groups, if they are not already, and insert a Graphic Item sub-shape causing the bounding rectangle to be extended, and consequently forcing the layout to be re-spaced. Then, if you change it to the Color by Value that was really wanted, it is too late, the unrequired sub-shape is removed, and the re-layout is automatically performed again!

  • Manually adjusted layout
  • Select a Data Graphic Field
  • Changed to Color By Value

My next post will focus on a solution to overcome these issues with Data Visualizer... This will mean creating a modified Visio template to import from Excel!

Related Posts

Pushing Data Visualizer in Visio beyond its limits

My last post was about some of the lessons learnt when trying to push Data Visualizer to its limits, but this one has some ways of overcoming these limitations. The main lesson learnt is that DV binds the shapes within the DV container shape, CFF Data Visualizer, and controls some of the ShapeSheet cells that…

Teams Tuesday Podcast Recording about Visio

I am delighted to share the link to my recent demonstration and conversation with fellow MVP Peter Ward about Visio in Teams. We discussed more than just Visio … and I look a bit like Max Headroom! (more…)

Binding Visio and Excel with Data Visualizer

I re-vamped some of my content about the Visio Data Visualizer add-in for Excel in my last post, so I thought I should expand a bit more on the Data Visualizer feature in Visio for Desktop (Visio Plan 2) and Excel for Desktop. I have described it in detail in previous posts, but I never…

Editing Visio Data Visualizer in Excel

I have previously described how to use the Visio Data Visualizer add-in in Excel, but I didn’t make it clear how you can edit the diagram created if you have a Visio license. So, I have recorded three short videos to briefly explain this. (more…)

Visio Data Visualizer Tips

The Microsoft Visio product team have released a great video introduction to the Visio Data Visualizer, but even that does not reveal all of its power. So, here are some tips about using the Microsoft Visio Data Visualizer add-in in Excel. Firstly, the add-in currently offers three different types of diagram, and each have a…

Using some Visio Shape Data in Visio for the Web

Like a lot of UK TV viewers last week, I watched Quiz, a drama about Major Charles Ingram who apparently cheated his way to the jackpot in Who Wants to be a Millionaire. Some of the questions that he was asked were quoted in that show, and I was surprised how easy the last two…

Filed Under: Connectors, Data Visualizer, External Data, Layers, Shape Data, Shape Reports, ShapeSheet Formulas, Visio Plan 2 Tagged With: Data Visualizer, Visio

Published on March 19, 2018 by David Parker

What is the difference between a line and a [dynamic] connector in Visio?

When I have reviewed some of the criticisms of connecting shapes in Visio on the web, it has been clear that some users have a misunderstanding about lines and connectors. It is not surprising really because the Microsoft Visio help documentation does not currently make the distinction clear. A connector shape is used to connect two shapes together, whereas a line is normally just a straight line. As usual with Visio though, this is not the whole story because a line can be used to connect two shapes together, and it can be turned into a dynamic connector. I will try to explain myself in this article.
The normal way to connect two shapes together is to use the Connector tool (CTRL+3) on the Home / Tools  ribbon, and a line is drawn with the Line (CTRL+6) drop-down menu in the same ribbon group.

[Read more…] about What is the difference between a line and a [dynamic] connector in Visio?

Filed Under: Connectors, Visio, Visio 2016 Tagged With: Connectors, ShapeSheet

Published on August 9, 2016 by David Parker

Understanding Visio Connections

A reader recently asked if I could explain how to programmatically get the shapes connected to a shape in Visio. So, I thought I would have a go, because there are alternatives, depending upon which functions are used, and what parameters are passed to them. The following animated gif is rotating around the different types of selections that can be made from the lower Decision shape. Normally, two 2D shapes are connected together using a 1D shape. The 1D shape has a direction because it starts from “BeginX” and finishes at “EndX”. This is irrespective of an arrowheads that the user may have chosen to adorn the 1D connector with at either end.

multiSelect Children and Parents

[Read more…] about Understanding Visio Connections

Filed Under: C#, Connections, Connectors, Visio Tagged With: Connections

Published on May 21, 2013 by David Parker

Getting the Name of Glued Connection Points

A Visio developer asked me if it is possible to get the name of connection points that a connector is glued to in Visio. Well, it is not possible directly from the ShapeSheet, but is easy if you use a little code.

First of all, I created a simple Block shape with 3 named connection points on either side of it. I added a little text to the block to display the shape name, and to remind me where the named connection points are.


image


[Read more…] about Getting the Name of Glued Connection Points

Filed Under: Connections, Connectors, VBA, Visio 2010, Visio 2013 Tagged With: Connectors, Visio

Published on October 15, 2012 by David Parker

Adding More Smartness to Visio Connectors

Whenever I have been asked why I like Visio so much, I have usually cited its ability to connect shapes together; its ability to link to data; and its programmability. Visio 2010 formally added a structured diagram concept and API, and the premium edition introduced diagram validation. So many different types of Visio diagrams require elements to be connected together correctly, and I often have to add a little extra into the connectors to make them smarter.

What is a connector?

A connector is a Visio shape that has 1-D behavior. The most used example is the Dynamic connector shape, which not only connects elements together, but can also re-route itself according to the layout and routing options selected for a page.

[Read more…] about Adding More Smartness to Visio Connectors

Filed Under: Connectors, ShapeSheet Formulas, Visio Tagged With: Connectors, ShapeSheet Functions

  • Go to page 1
  • Go to page 2
  • Go to Next Page »

Primary Sidebar

  • LinkedIn
  • Twitter

Recent Posts

  • Pushing Data Visualizer in Visio beyond its limits
  • Pushing Data Visualizer in Visio to the limits!
  • Teams Tuesday Podcast Recording about Visio
  • Linking Data to Visio Shapes in Code
  • Editing Visio Layer Colours with LayerManager

Categories

Tags

Accessibility Add-Ins Connectors Containers Data Export Data Graphics Data Import Data Visualizer Educational Excel GraphDatabase Hyperlinks Icon Sets JavaScript Layers Legend Link Data to Shapes Lists MSIgnite MVP Office365 Org Chart PowerApps PowerBI PowerQuery Processes Shape Data Shape Design ShapeSheet ShapeSheet Functions SharePoint 2013 SQL Teams Themes Validation VBA Video Visio Visio 2007 Visio 2013 Visio for the Web Visio Online Visio Services Visio Viewer Webinar

Footer

bVisual Profile

The UK-based independent Visio consultancy with a worldwide reach. We have over 25 years experience of providing data visualization solutions to companies around the globe.

Learn more about bVisual

  • LinkedIn
  • Twitter

Search this website

Recent posts

  • Pushing Data Visualizer in Visio beyond its limits
  • Pushing Data Visualizer in Visio to the limits!
  • Teams Tuesday Podcast Recording about Visio
  • Linking Data to Visio Shapes in Code
  • Editing Visio Layer Colours with LayerManager

Copyright © 2023 · Executive Pro on Genesis Framework · WordPress · Log in