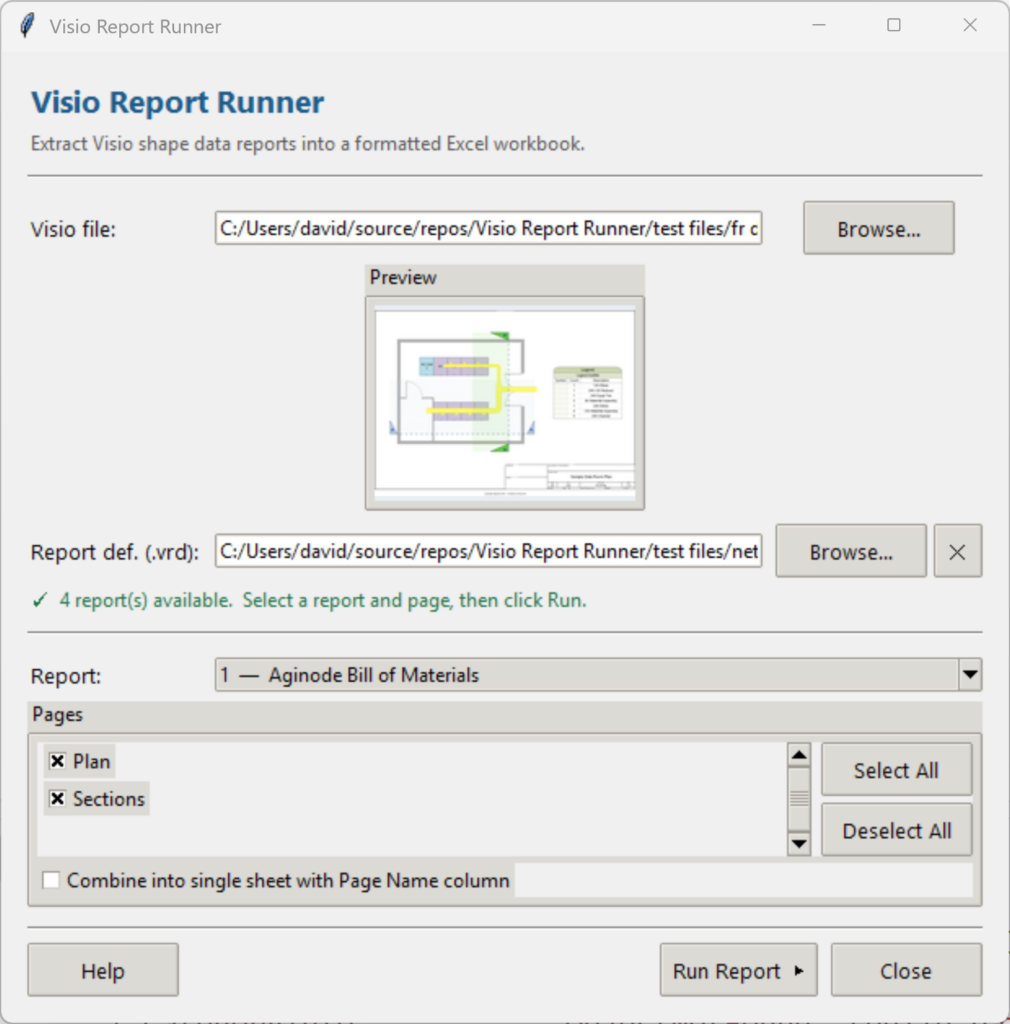
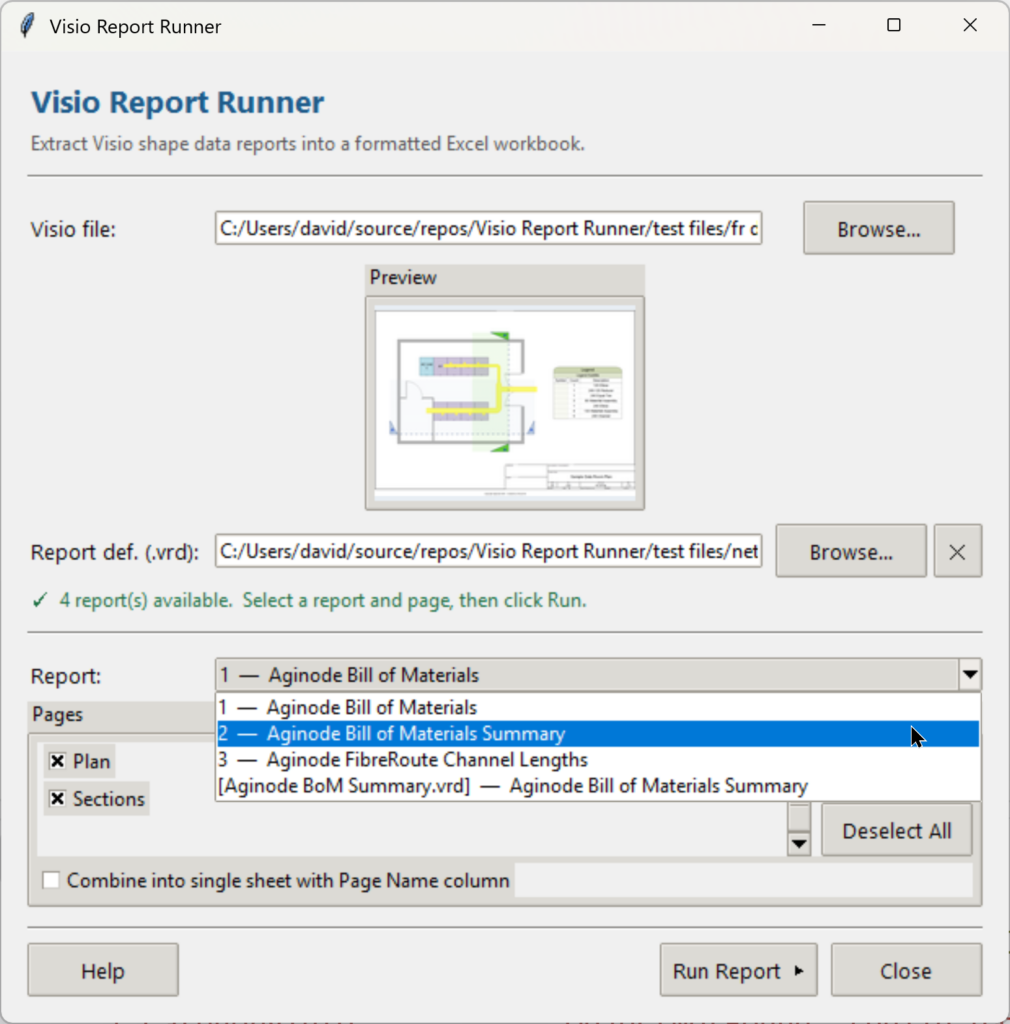
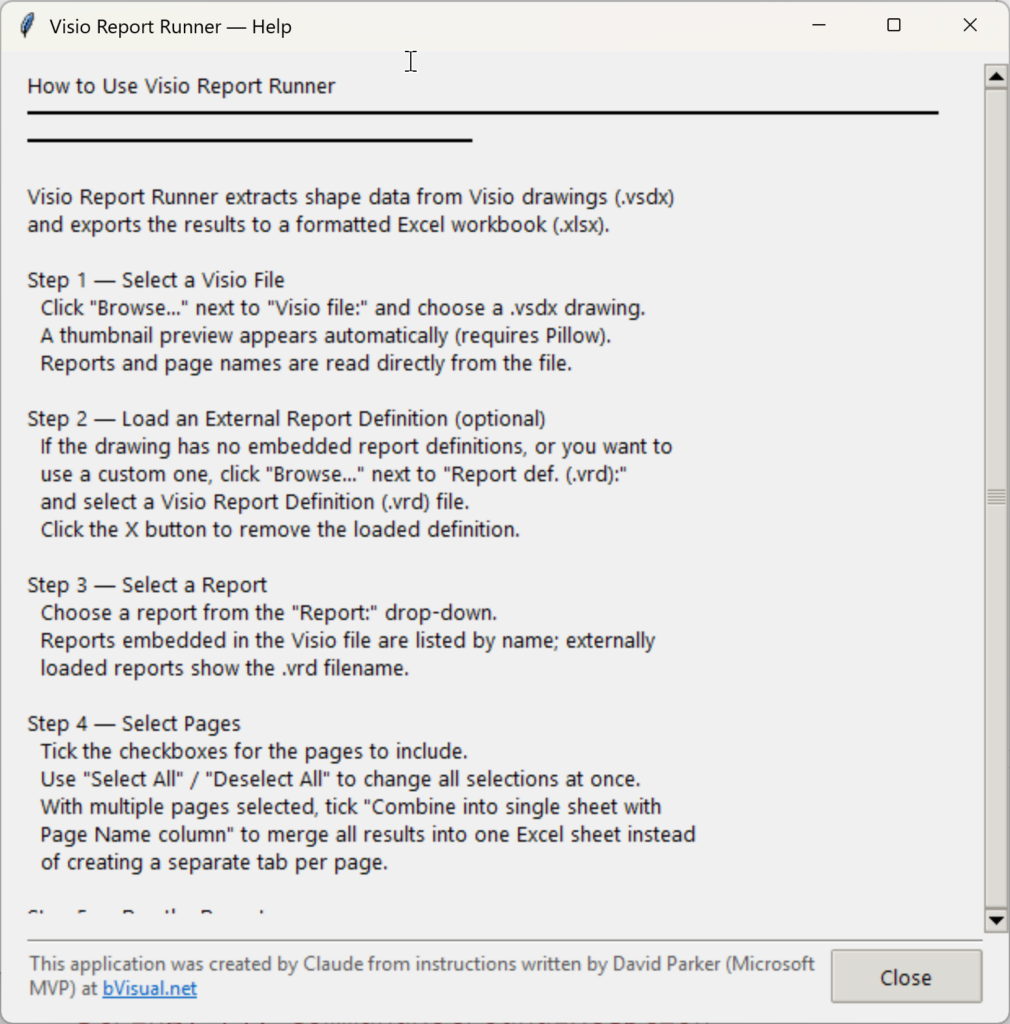
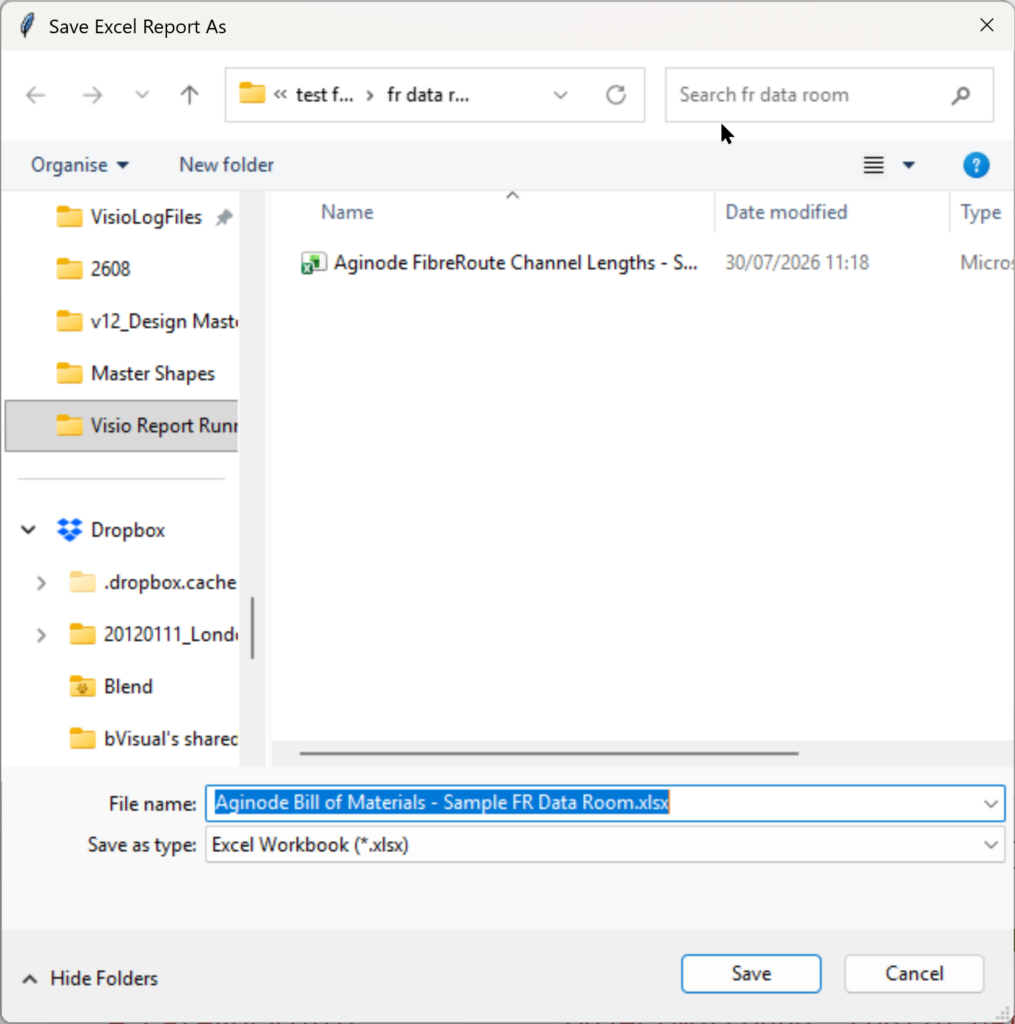
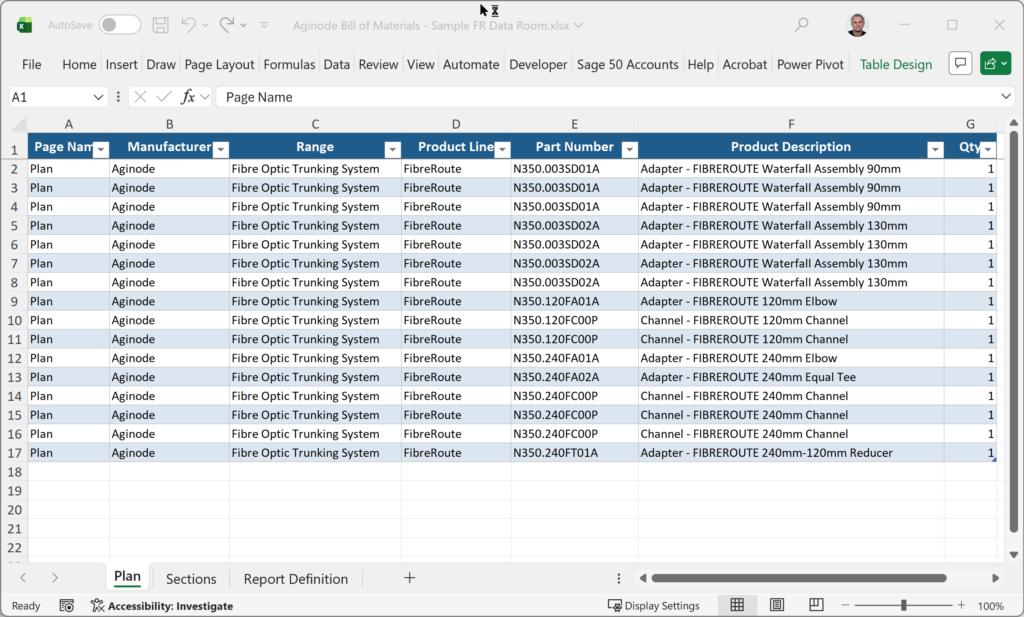
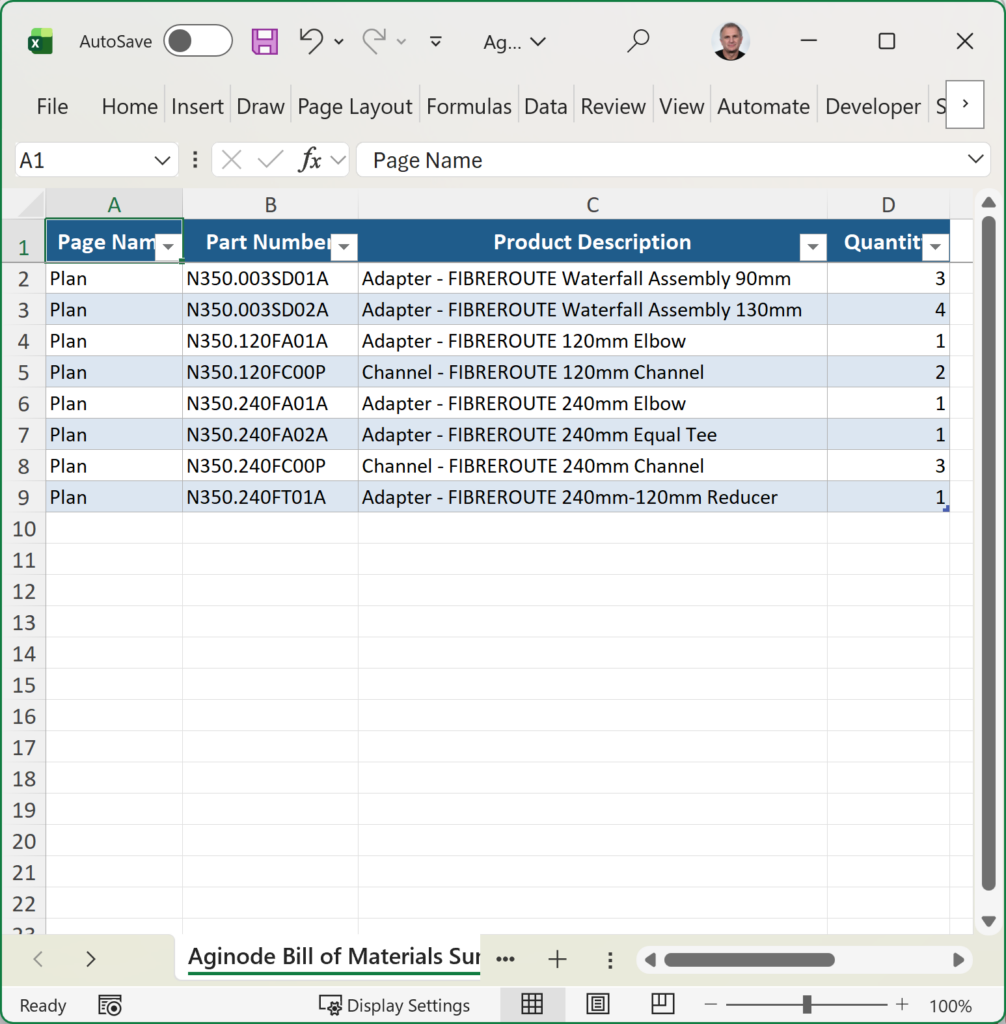
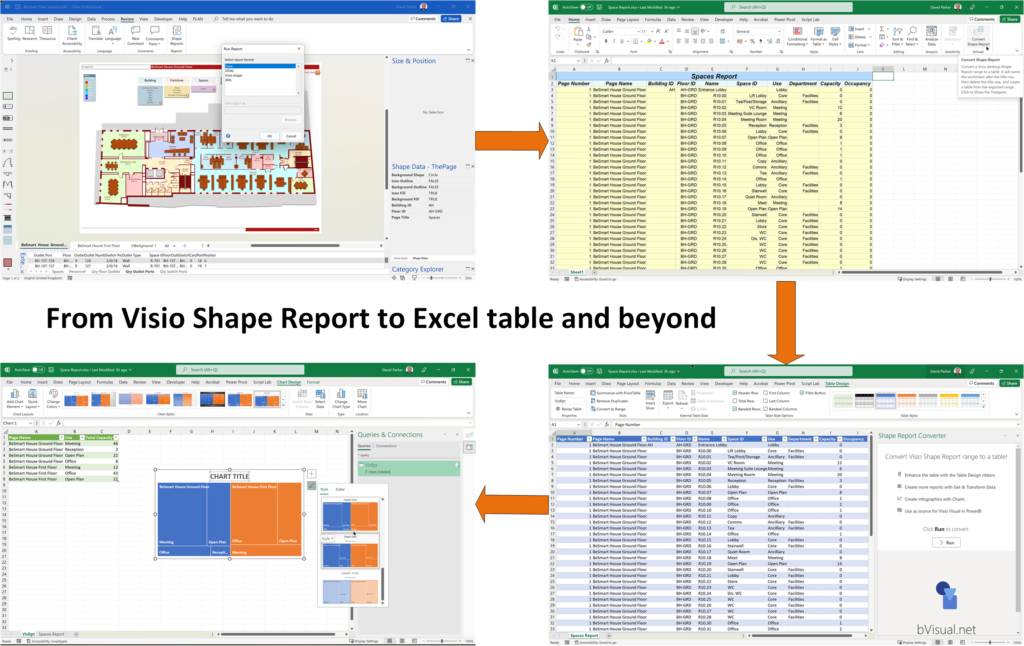
AI is changing the world and how we should approach it. So I decided to see if I could get Claude Sonnet 4.6 Agent to completely write an application for me, and I mean completely. The application is written in Python by Claude, and I have not written a single line. The code is available at github.com/davidjpp/Visio-Report-Runner/ and it enables any Windows user, with Microsoft Excel installed, to run some types of reports from any Visio document (*.vsdx).
[Read more…] about Introducing a free Visio Report Runner applicationShape Reports
Pushing Data Visualizer in Visio beyond its limits
My last post was about some of the lessons learnt when trying to push Data Visualizer to its limits, but this one has some ways of overcoming these limitations. The main lesson learnt is that DV binds the shapes within the DV container shape, CFF Data Visualizer, and controls some of the ShapeSheet cells that are normally available for customization. The label of the connector is bound to the respective column in the Excel table, and that, combined with the ability to modify the Dynamic connector master shape provides a way of overcoming some of the limitations discovered.
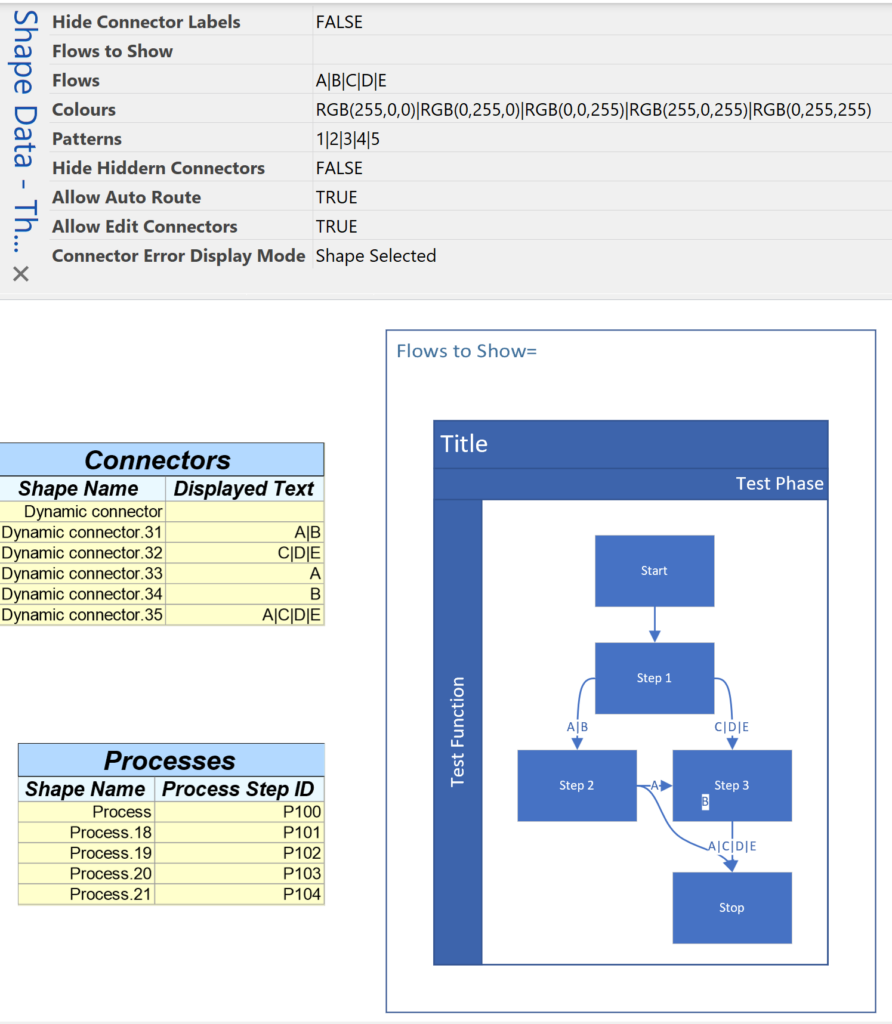
So, given that we want to use DV, and we need to have multiple flows between the same shapes, then they cannot be separate connectors. We need to combine multiple flows onto the same connector, and then find a way to selectively display different flows somehow by controlling the visibility of the connectors. However, we cannot make them invisible because they will be deleted by DV, so we need to control their transparency instead. We can do this by interpreting the label somehow, and we are going to modify the Dynamic connector to react to the text of the label, and we can also change the colour and line pattern too.
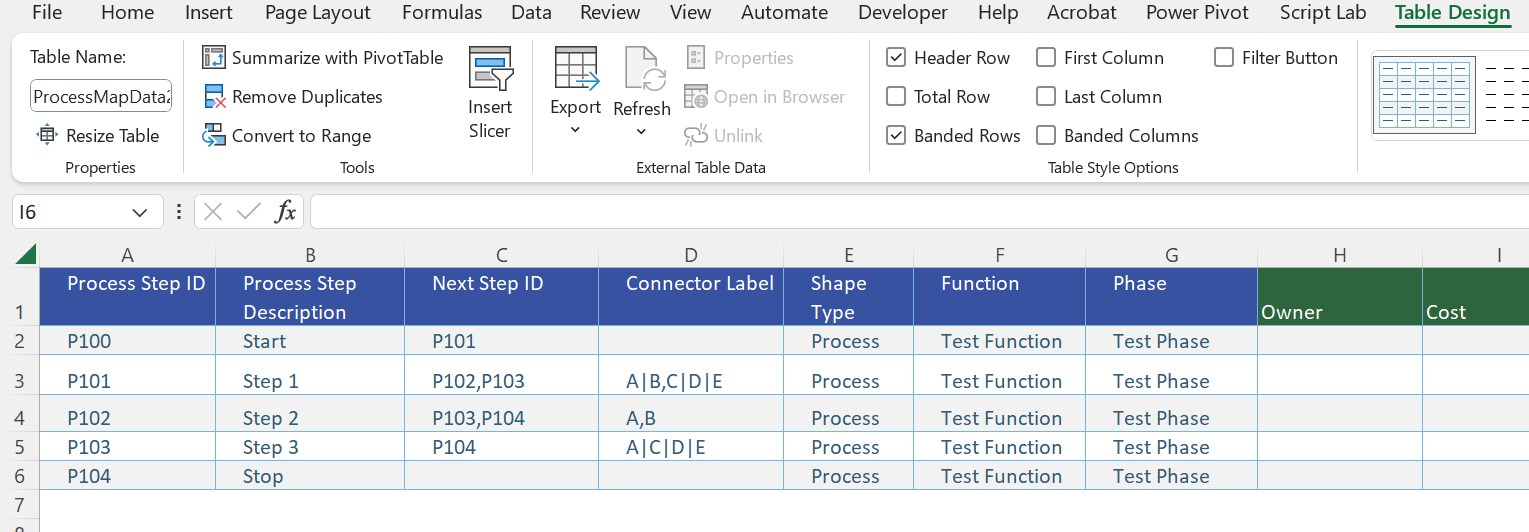
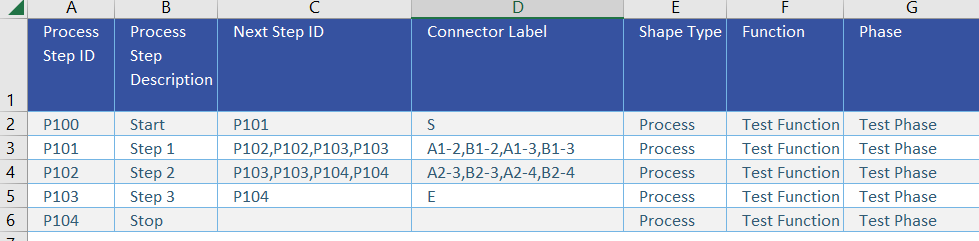
The following screenshots show the Excel table with the multiple flows between the same shapes concatenated with pipe characters, and the diagram created by Data Visualizer when this table is imported into a custom template using Data \ Create from Data \ Create:
[Read more…] about Pushing Data Visualizer in Visio beyond its limitsPushing Data Visualizer in Visio to the limits!
Regular readers of my blog will know that I like to use the Data Visualizer (DV) in Visio Plan 2, but I recently tried to help a user who really decided to push it to the limits. In this scenario, there were multiple connections, but with different labels, being created between the same flowchart shapes, and the plea was how to make it work! Well, I experimented with this, and found that DV does not really work well in this way, and then proposed an alternative approach, which I will explain in this article.
First, I will show how it fails by setting up an Excel table that does contains multiple connections, but fails to update the labels consistently.

Visio Shape Report Converter Excel add-in available
I am delighted to announce that I have just had my first Excel add-in accepted in the Office Add-ins Store! It is called Shape Report Converter because all it does is convert a Shape Report converted from Visio for Desktop to a modern Excel table with one click!

It isn’t a complicated add-in, and it doesn’t do anything that you can’t do manually, but it does save time, and ensures consistency … and it is free!
[Read more…] about Visio Shape Report Converter Excel add-in availableA Visio List Shape is also a Container
Structured diagrams have been around in Microsoft Visio since 2010 and I have always known that list shapes are a specialized container shape, however it still came as a surprise to me recently that a list shape can simultaneously act as a container shape!
There are a few examples of both container and list shapes in the Microsoft provided content in all versions of Visio desktop, and even in the subscription Visio for web. The most popular of these is the Cross-Functional Flowchart template which contains container shapes (the Swimlane and Separator shapes) within list shapes (Swimlane List and Phase List), which are within another container shape (CFF Container).
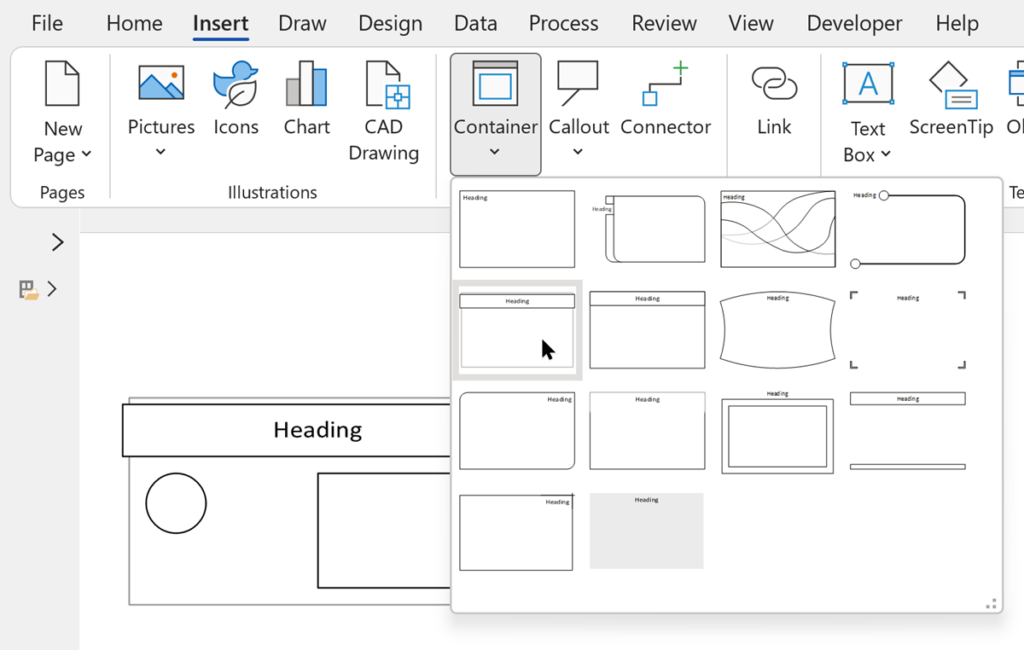
In Visio desktop, the Insert / Diagram Parts / Container allows you to choose from a number of pre-built container shapes. There is no button to insert a list shape, but you can create your own or easily modify one of the pre-built ones to behave as a list shape.

Automatic Line and Segment Lengths in Visio
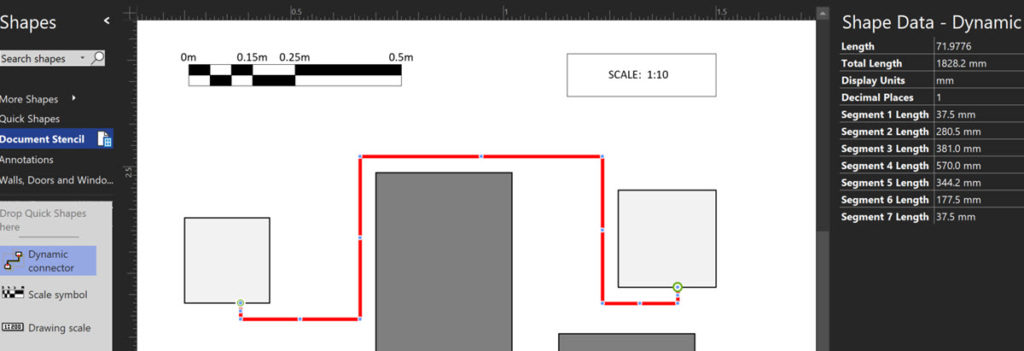
Many years ago, I wrote some VBA code to calculate the length of a multi-segment line in Visio, see Automating Area and Perimeter Length Shape Data , but Microsoft have since provided a handy ShapeSheet function, PATHLENGTH(…), to do the same without any VBA. The function is described on one of the pages in Visio ShapeSheet Functions O-R , but here is one way that it can be incorporated into a useful shape for, say, cabling or piping, and thus be available in Shape Reports. Moreover, the Shape Data can display the length of each of the segments in the line, in addition to the total length.