Many years ago, I wrote some VBA code to calculate the length of a multi-segment line in Visio, see Automating Area and Perimeter Length Shape Data , but Microsoft have since provided a handy ShapeSheet function, PATHLENGTH(…), to do the same without any VBA. The function is described on one of the pages in Visio ShapeSheet Functions O-R , but here is one way that it can be incorporated into a useful shape for, say, cabling or piping, and thus be available in Shape Reports. Moreover, the Shape Data can display the length of each of the segments in the line, in addition to the total length.
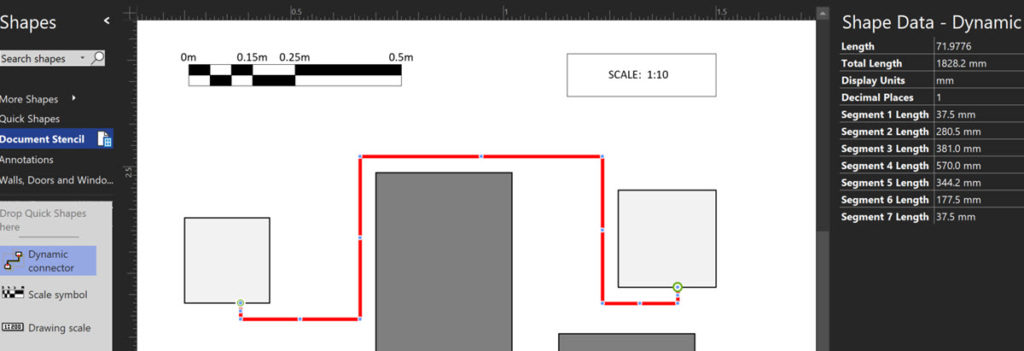
I chose to modify the Dynamic Connector master in this example, but it could be added to any 1D master shape.
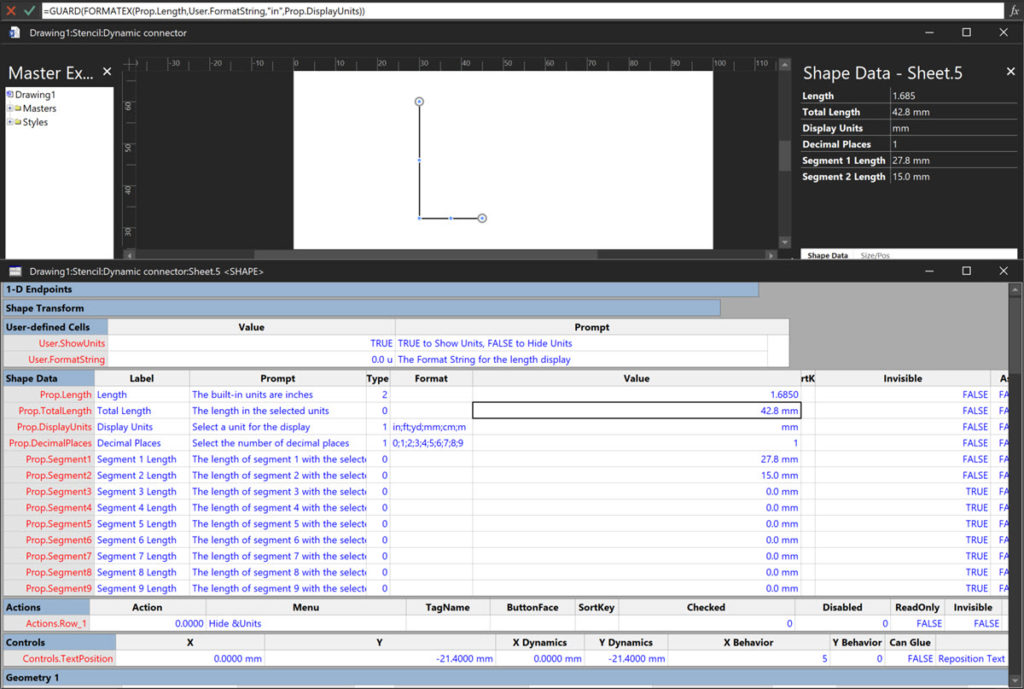
I also chose to add in the ability to select the display units and the number of decimal places. The following images are of the ShapeSheet in both Value and Formula display modes.
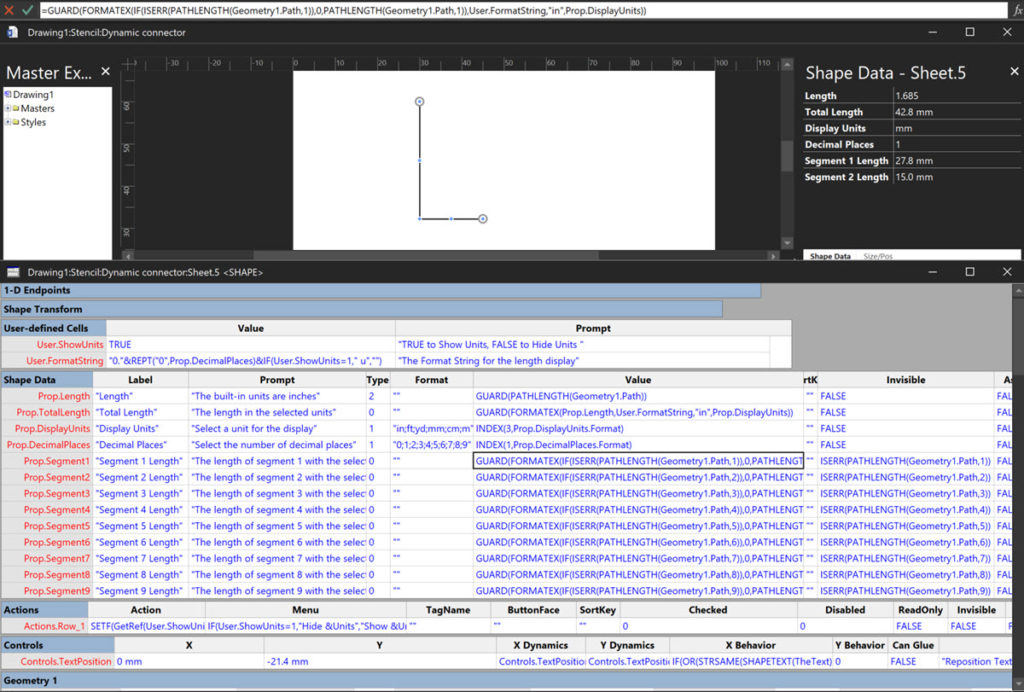
User-defined Cells
| Name | Value | Prompt |
| ShowUnits | TRUE | “TRUE to Show Units, FALSE to Hide Units “ |
| FormatString | “0.”& REPT(“0”,Prop.DecimalPlaces)& IF(User.ShowUnits=1,” u”,””) | “The Format String for the length display” |
The REPT(…) function will simply repeat the “0” character as many times as defined by the value of Prop.DecimalPlaces
Shape Data
| Name | Label | Prompt | Type | Format | Value | Invisible |
| Length | “Length” | “The built-in units are inches” | 2 | “” | GUARD( PATHLENGTH(Geometry1.Path) ) | FALSE |
| TotalLength | “Total Length” | “The length in the selected units” | 0 | “” | GUARD( FORMATEX( Prop.Length, User.FormatString, “in”, Prop.DisplayUnits) ) | FALSE |
| DisplayUnits | “Display Units” | “Select a unit for the display” | 1 | “in;ft;yd;mm;cm;m” | INDEX(3,Prop.DisplayUnits.Format) | FALSE |
| DecimalPlaces | “Decimal Places” | “Select the number of decimal places” | 1 | “0;1;2;3;4;5;6;7;8;9” | INDEX(1,Prop.DecimalPlaces.Format) | FALSE |
| Segmentn | “Segment n Length” | “The length of segment n with the selected unit and decimal places” | 0 | “” | GUARD( FORMATEX( IF( ISERR(PATHLENGTH(Geometry1.Path,n)), 0, PATHLENGTH(Geometry1.Path,n) ), User.FormatString, “in”, Prop.DisplayUnits) ) | ISERR(PATHLENGTH(Geometry1.Path,n)) |
Where n is from 1 to as many as you expect to be the maximum number of segments.
The Length Shape Data row could be Invisible=TRUE.
The invisibility or each of the multiple Segmentn rows is controlled by checking if there is an error returned by the PATHLENGTH(…) function.
Actions
| Action | Menu |
| SETF(GetRef(User.ShowUnits),NOT(User.ShowUnits)) | IF(User.ShowUnits=1,”Hide &Units”,”Show &Units”) |
That is all that is required!

Creating Boolean Context Menus in Visio
Over the many, many years that I have been creating Microsoft Visio solutions, I have had to create numerous right-mouse context menus for shapes to control their Shape Data values. Over that time, patterns emerge, so this article is highlighting three different appearances for simple Boolean values, otherwise known as True/False or Yes/No values, and…
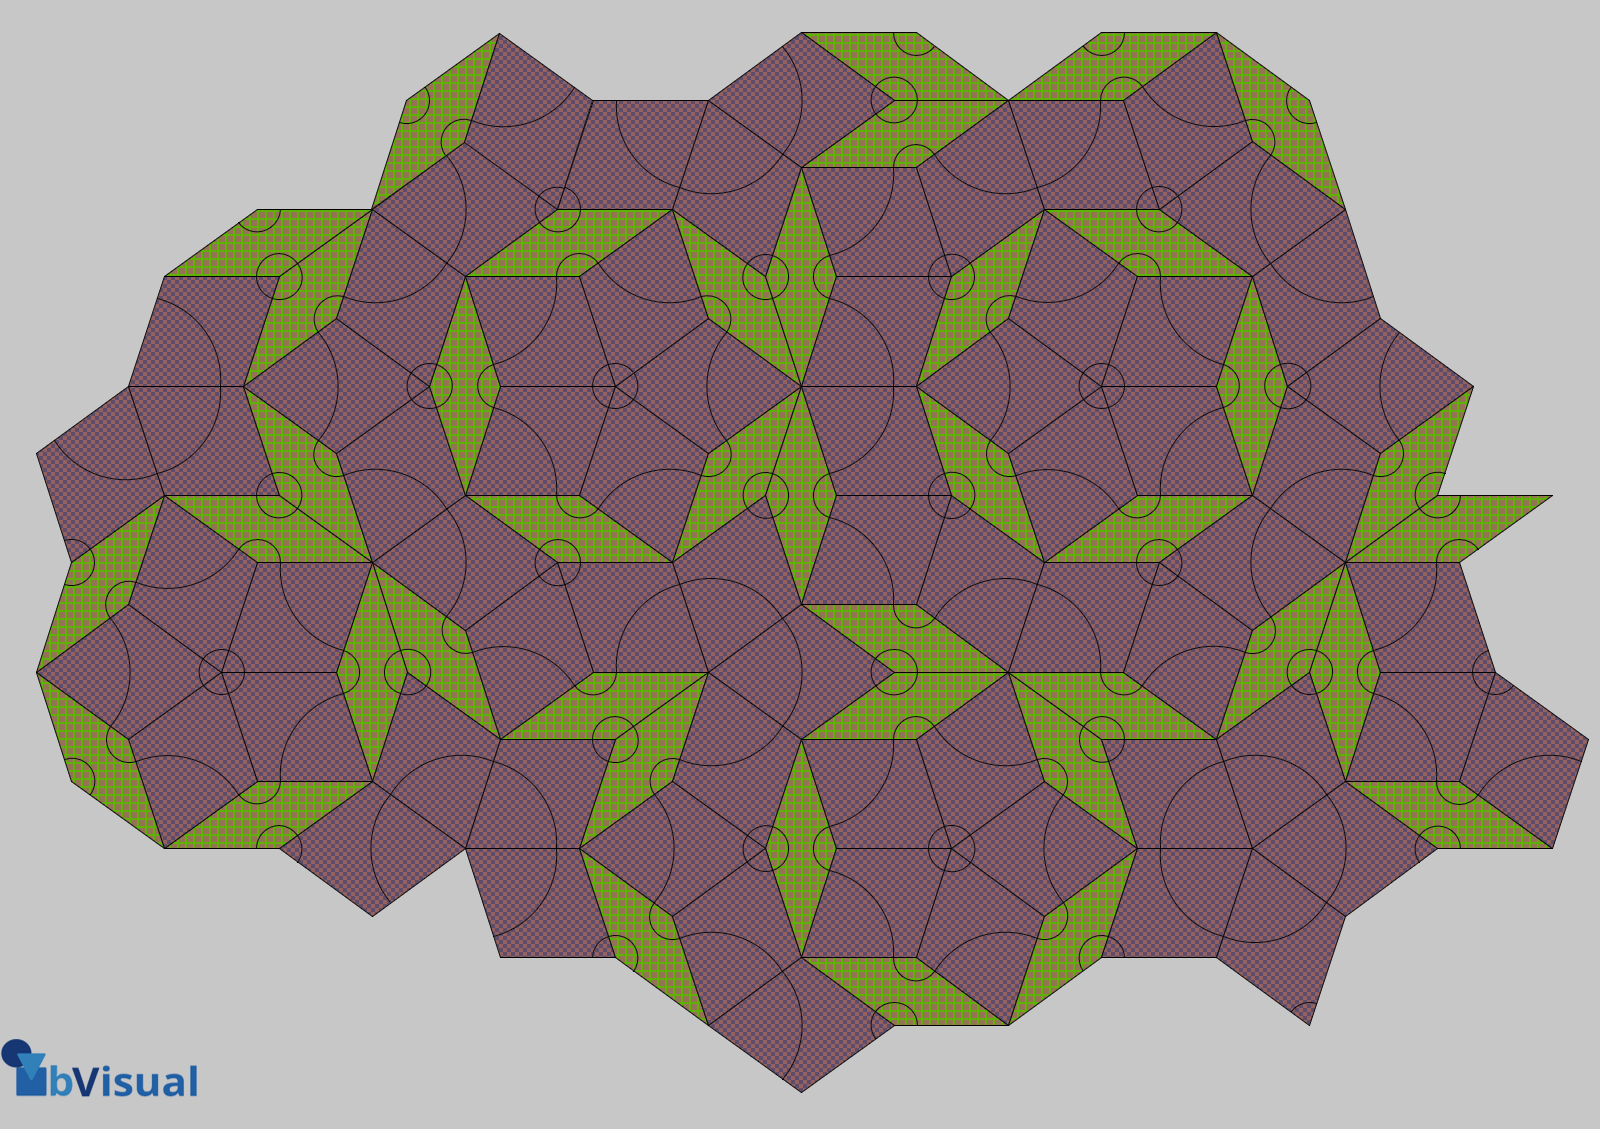
A visual exploration of Penrose Tiling in Visio
Maybe it is because I used to be a building architect, but I have always been fascinated by the relationship between numbers and visualisations. Perhaps the most famous one is the Golden Ratio which has been used as the basis of many building designs and art pieces. It is often recognised to create a harmony…
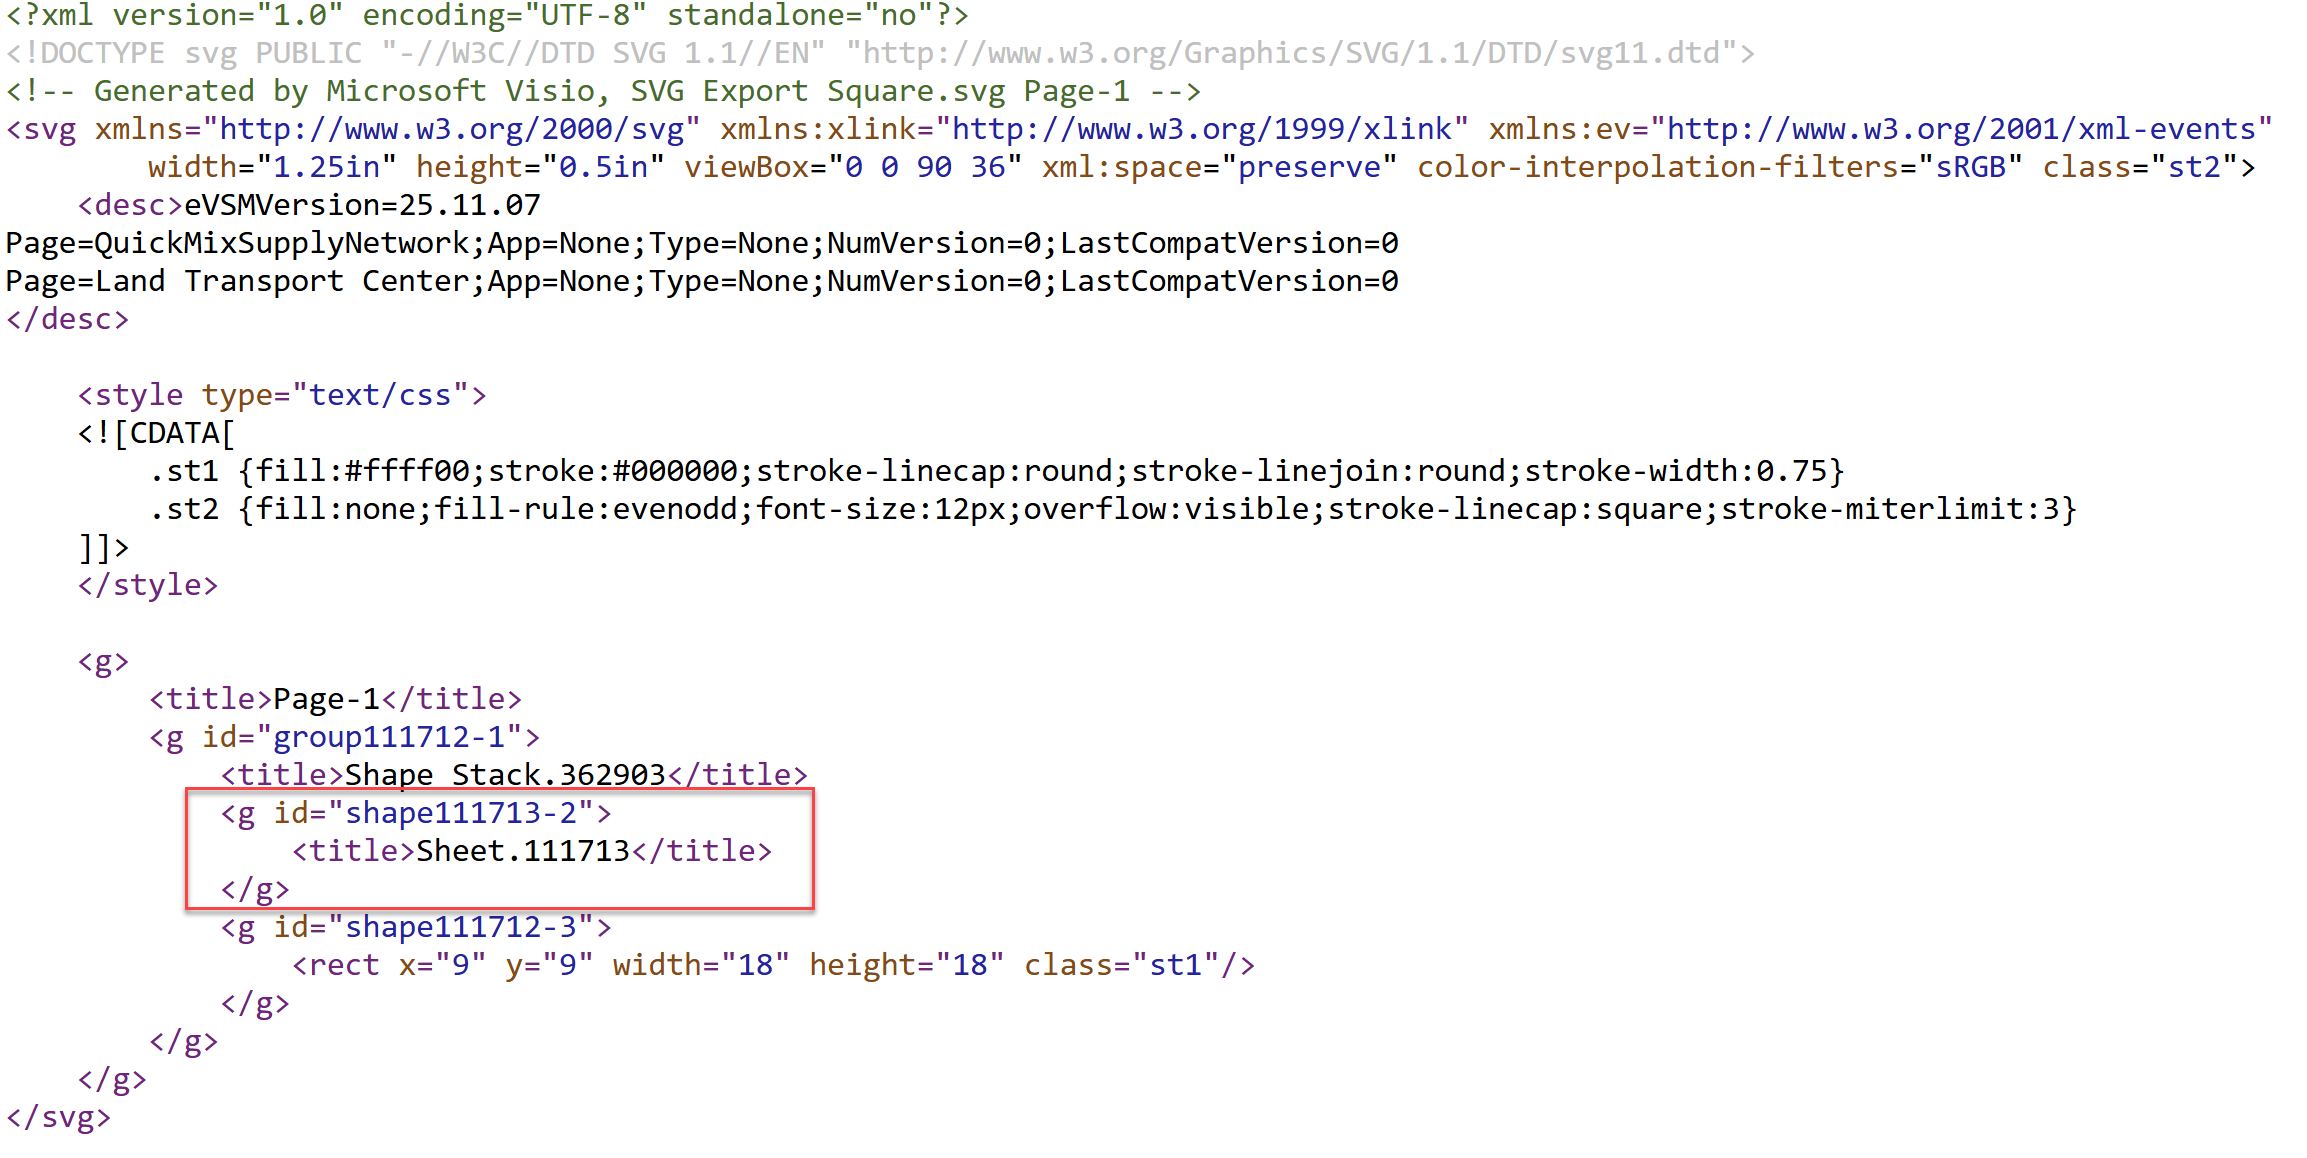
How SVG in Visio can cause a Shape.BoundingBox(…) error
I have used Visio’s Shape.BoundingBox(…) for many, many years and I cannot ever recall it failing, but I have now managed to create some shapes that cause it to error. This caused many hours of confusion, so I nearly abandoned using the method, until I discussed it with my fellow Visio MVP, John Goldsmith (see…

Jumping between Shapes in Visio
Many Visio diagrams get quite large, and sometimes it is useful to provide the ability to jump to another shape quickly in the same document, either on a different page or on the same one. Although there is an add-on provided in desktop Visio that is used by the Off-Page Reference shape provided in the…
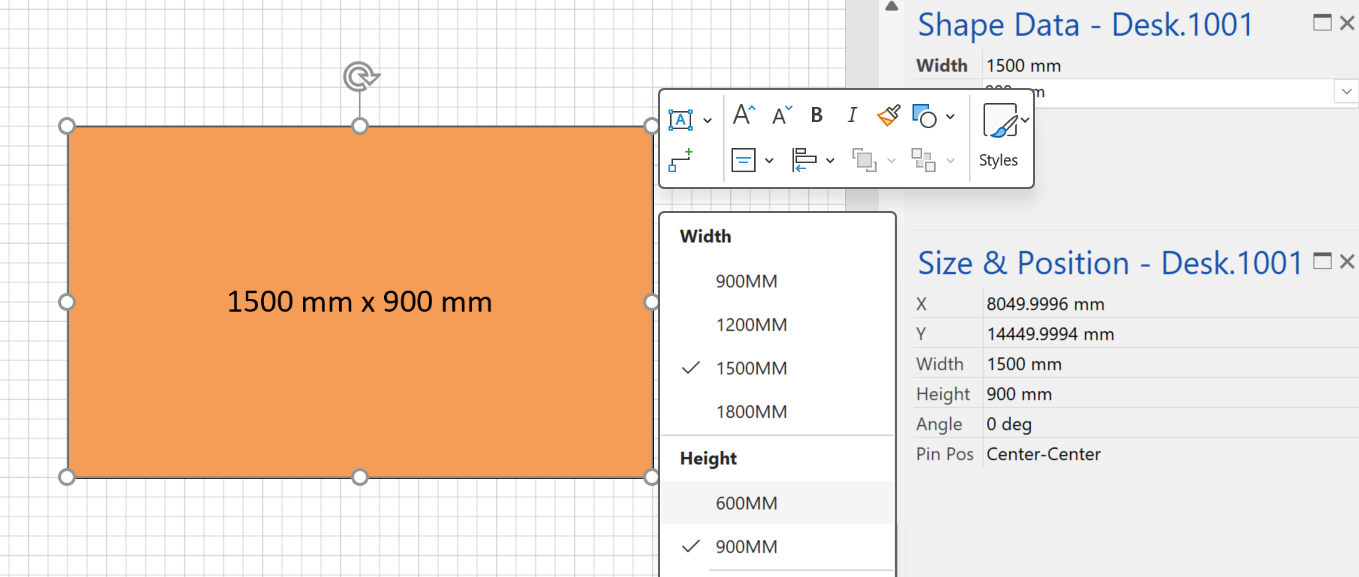
Fixing dimensions of 2D shapes
I am often asked what makes Visio unique and makes it stand out from the crowd, especially in today’s online world. Well, I think there are many reasons, but one of them is the ability to create scaled drawings with parametric components of specific dimensions. This was crucial for my adoption of Visio back in…
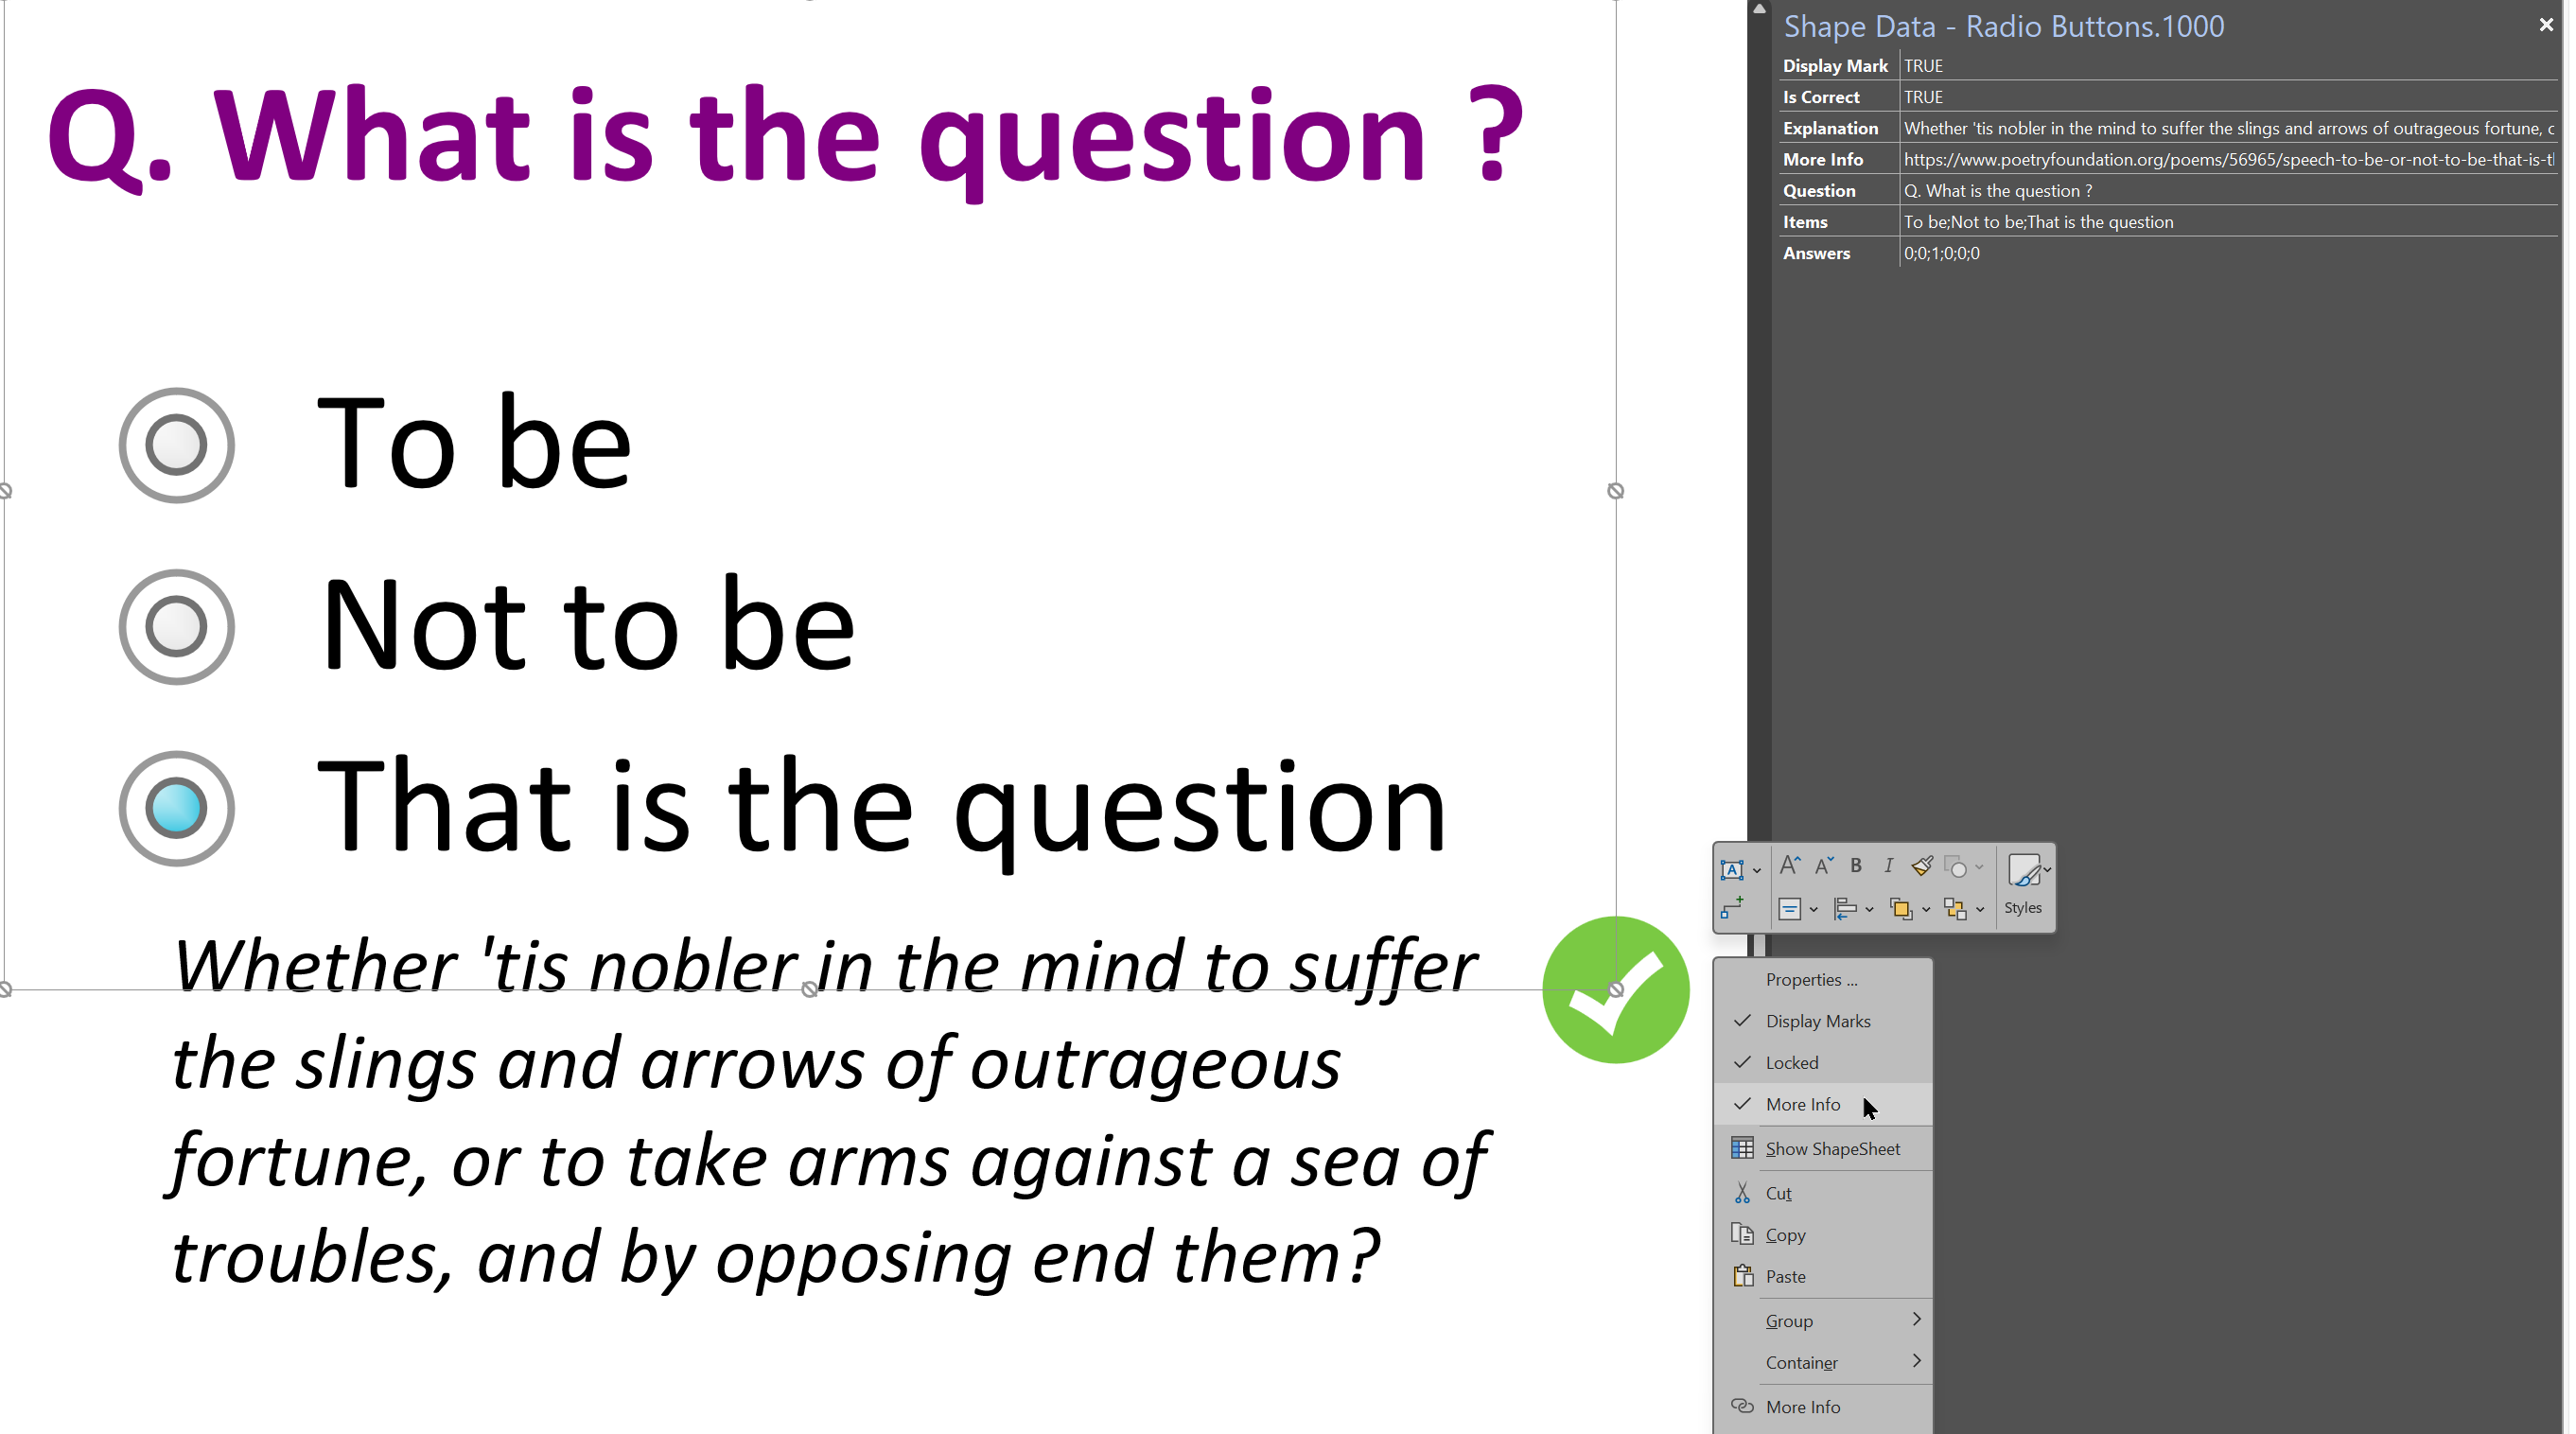
Smart Radio Buttons and Check Boxes in Visio
A recent project requires an interactive tutorial within Microsoft Visio desktop where a lot of the questions need a single answer using radio buttons, or multiple-choice answers using check boxes. I thought that this would be a great use of the list containers capability because the questions and answers could be part of the container…
Thanks for this example to make PATHLENGTH() work for my High Voltage line project!
A minor remark: PATHLENGTH() is not recalculated when you change the rounding of a line (e.g. the bending radius for a cable).
Work-around: change/add/delete a segment (or move a point of the path)
A question:
Can you specify in text how the contents of cell Controls.TextPosition.XBehavior looks like? The figures nor the tables show that information. I tried to figure it out, but my experience with controls is too limited, I am afraid…
Ah… I was using my own master (a HV cable), but should have used the Dynamic Connector master that was used in the example above.
In the Control section of my shape, I changed next cell:
Controls.TextPosition.Xbehavior=IF(OR(STRSAME(SHAPETEXT(TheText),””),HideText),5,0)
In the TextTransform section, I changed next cells:
TxtPinX=SETATREF(Controls.TextPosition)
TxtPinY=SETATREF(Controls.TextPosition.Y)
This works perfect for my master!
Thanks again for sharing your knowledge, David!
Regards – Evert
Ah… I was using my own master (a HV cable), but should have used the Dynamic Connector master that was used in the example above! That master comes with formulas that must be set when starting from scratch.
The answer to my question of February 12 is as follows:
1) Insert Prop.TotalLength as a Text Field
2) In the Control section, change next cells:
Controls.TextPosition.Xbehavior=IF(OR(STRSAME(SHAPETEXT(TheText),””),HideText),5,0)
3) In the TextTransform section, change next cells:
TxtPinX=SETATREF(Controls.TextPosition)
TxtPinY=SETATREF(Controls.TextPosition.Y)
Regards – Evert