My last post was about some of the lessons learnt when trying to push Data Visualizer to its limits, but this one has some ways of overcoming these limitations. The main lesson learnt is that DV binds the shapes within the DV container shape, CFF Data Visualizer, and controls some of the ShapeSheet cells that are normally available for customization. The label of the connector is bound to the respective column in the Excel table, and that, combined with the ability to modify the Dynamic connector master shape provides a way of overcoming some of the limitations discovered.
So, given that we want to use DV, and we need to have multiple flows between the same shapes, then they cannot be separate connectors. We need to combine multiple flows onto the same connector, and then find a way to selectively display different flows somehow by controlling the visibility of the connectors. However, we cannot make them invisible because they will be deleted by DV, so we need to control their transparency instead. We can do this by interpreting the label somehow, and we are going to modify the Dynamic connector to react to the text of the label, and we can also change the colour and line pattern too.
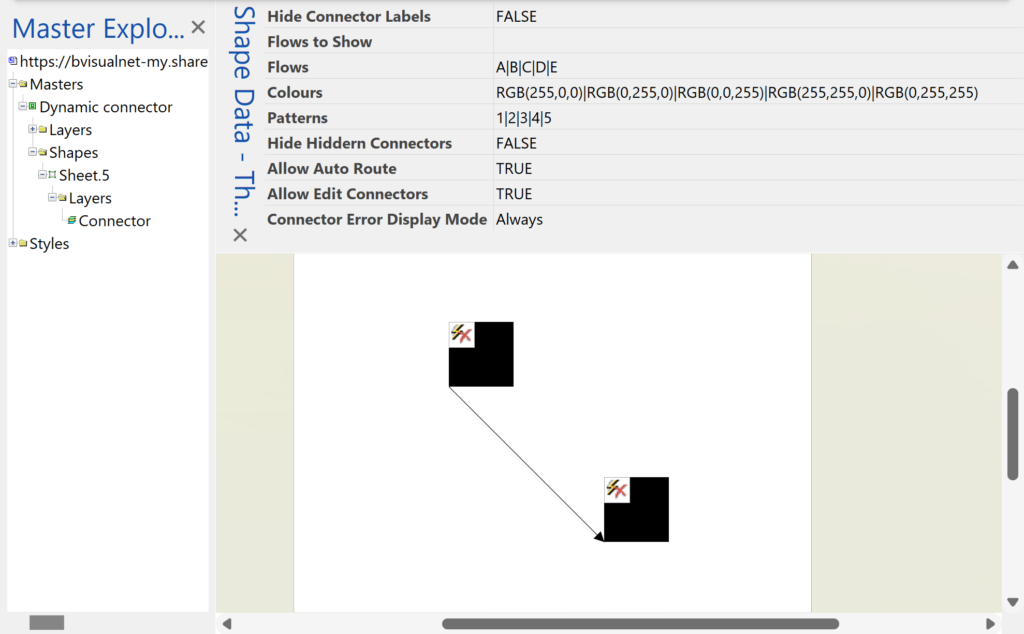
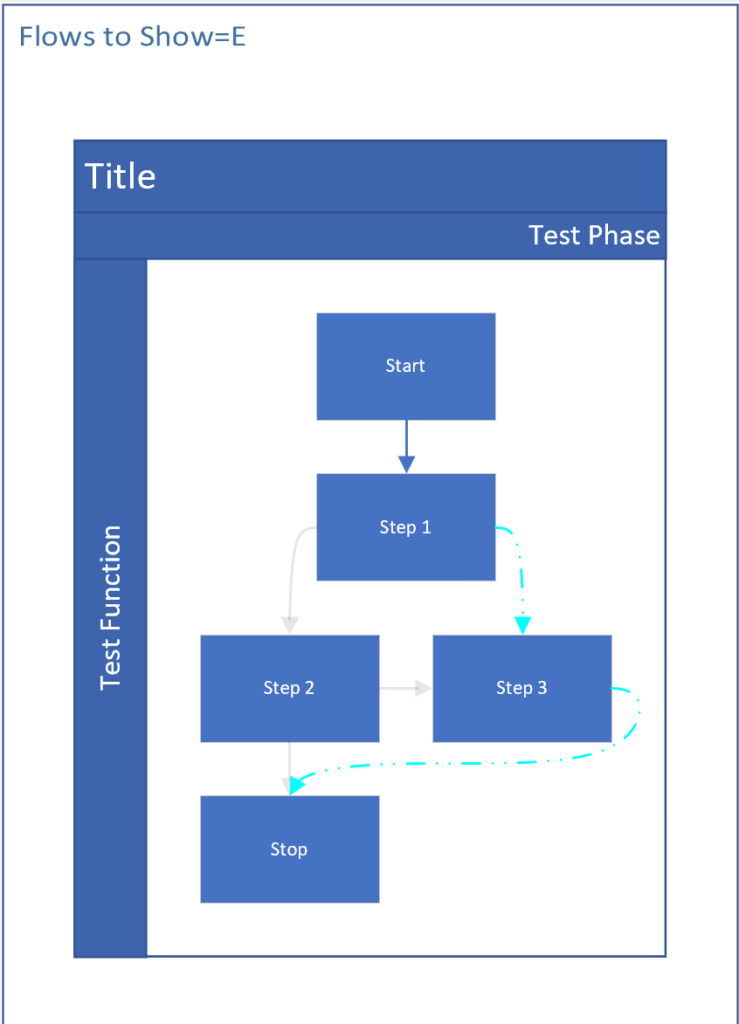
The following screenshots show the Excel table with the multiple flows between the same shapes concatenated with pipe characters, and the diagram created by Data Visualizer when this table is imported into a custom template using Data \ Create from Data \ Create:
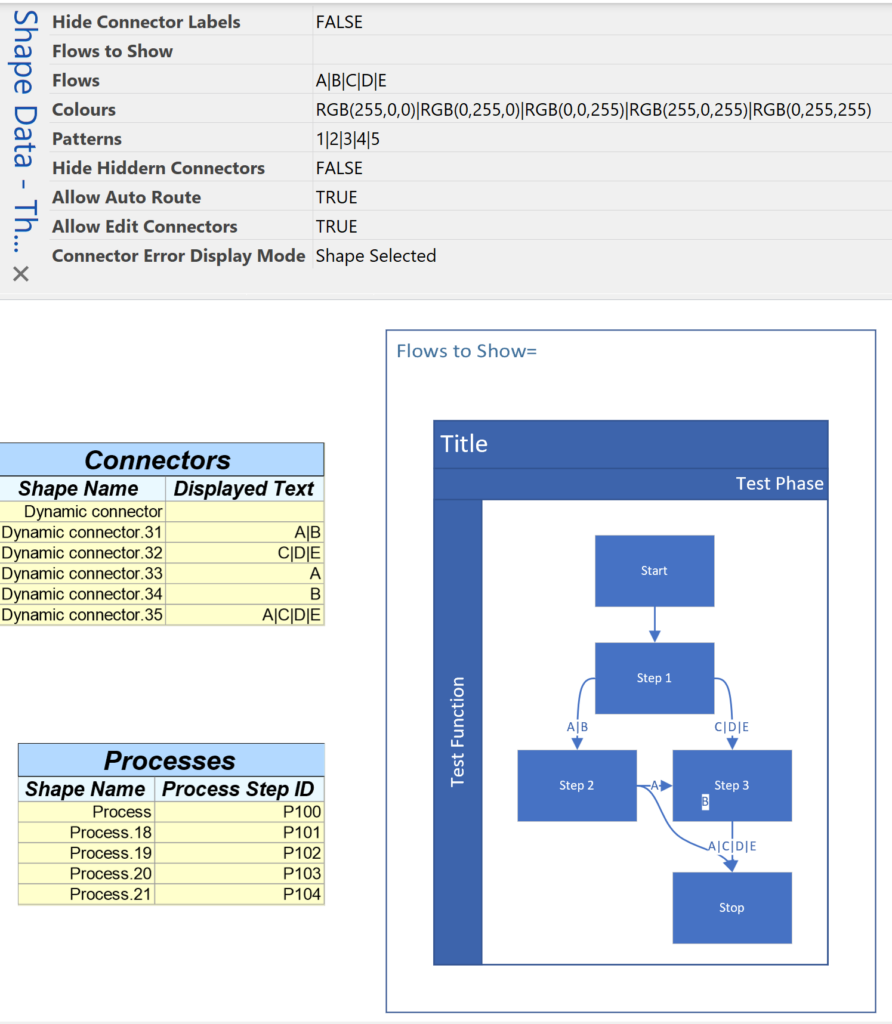
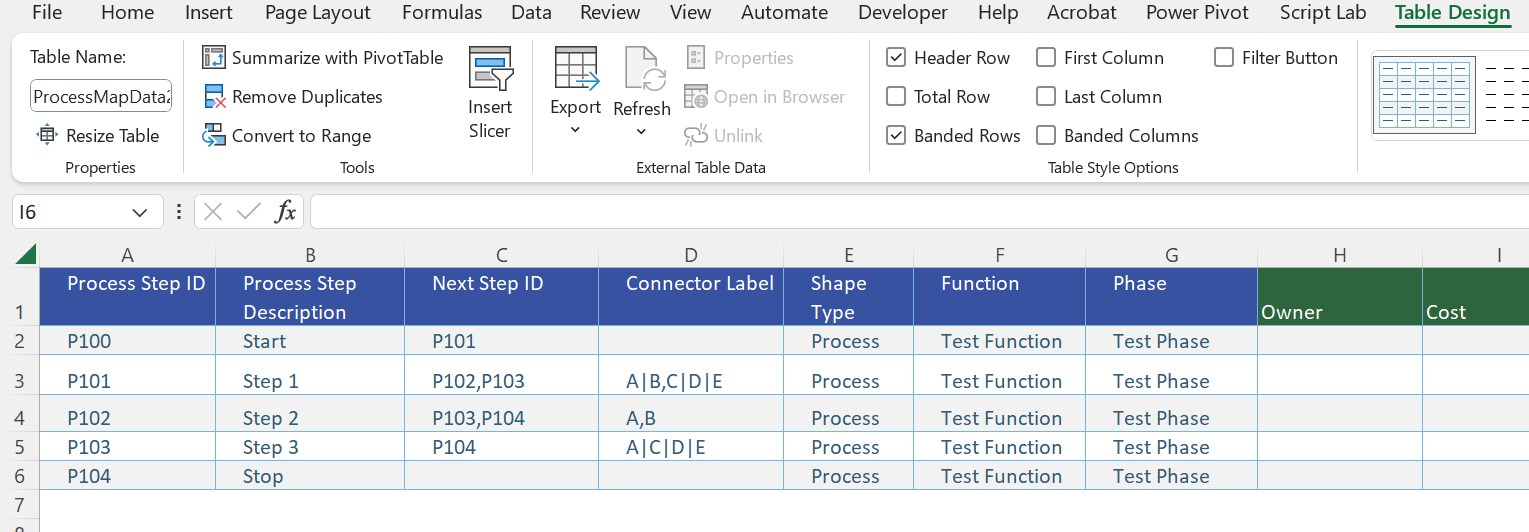
The above screenshot of the flowchart diagram as drawn by DV, with Shape Reports that simply lists the Dynamic connector shapes and the text on them and the Process shapes.
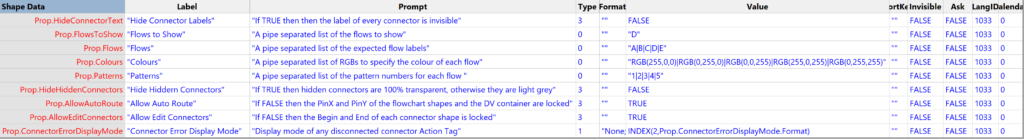
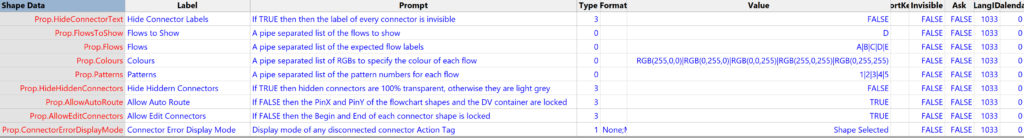
The page has Shape Data that controls various options:
- Hide Connector Labels – if TRUE then then the label of every connector is invisible
- Flows to Show – a semi-colon separated list of the flows to show
- Flows – a semi-colon separated list of the expected flow labels
- Colours – a semi-colon separated list of RGBs to specify the colour of each flow
- Patterns – a semi-colon separated list of the pattern numbers for each flow
- Hide Hidden Connectors – if TRUE then hidden connectors are 100% transparent, otherwise they are light grey
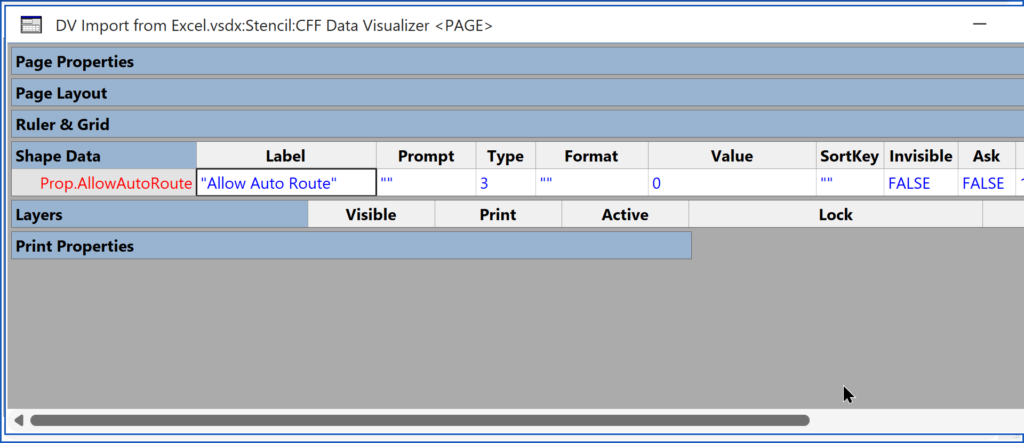
- Allow Auto Route – If FALSE then the PinX and PinY of the flowchart shapes and the DV container are locked
- Allow Edit Connectors – IF FALSE then the Begin and End of each connector shape is locked
- Connector Error Display Mode – Display mode of any disconnected connector Action Tag. See Enhancing the Built-In Containers in Visio for more information
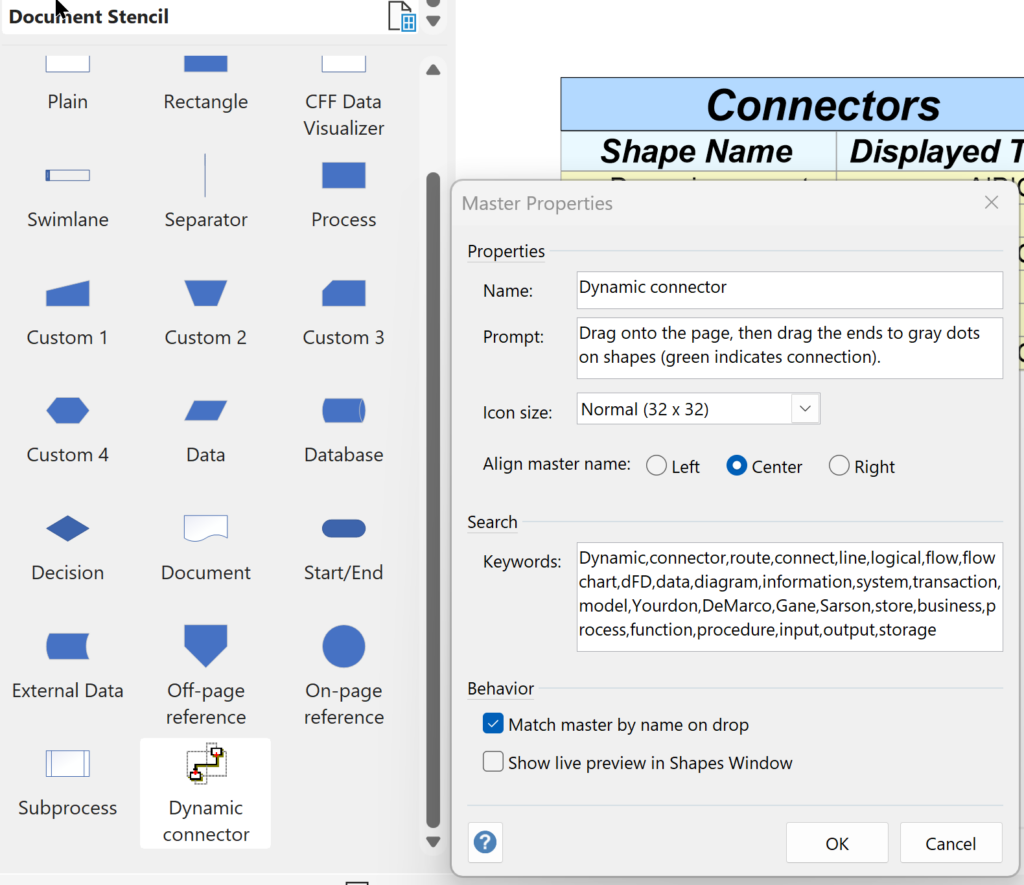
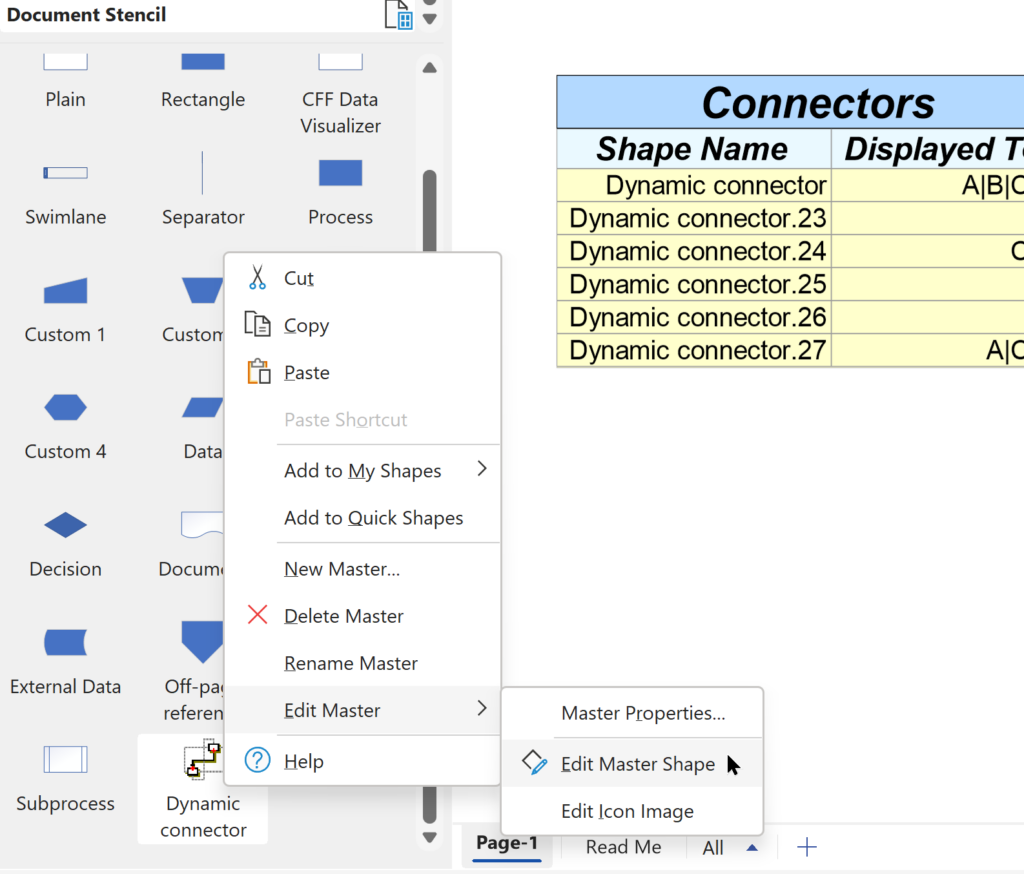
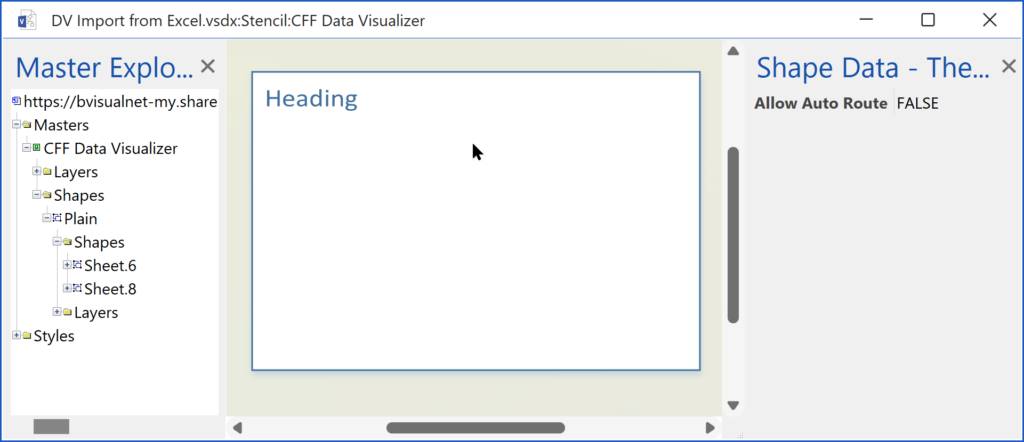
The Dynamic connector master shape customisations
So, as most of the customization was in the Dynamic connector master shape, the first task was to ensure that the Match master by name on drop option was ticked before opening the master shape in edit mode:
Dynamic connector master page customisations
Shape Data section
These rows will get copied to the page when a Dynamic connector is dropped on the page, if there is a reference in the shape cell formula to them.
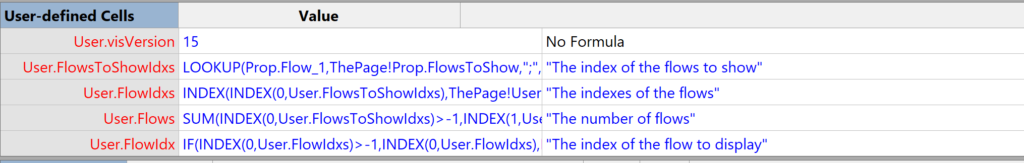
User-defined Cells section
The custom row in this section provides provides a semi-colon separated list of the indexes of the flows entered in the page Flows to Show Shape Data row.


The formula in the Value cell of the FlowIdxs row:
= LOOKUP(INDEX(0,Prop.FlowsToShow),Prop.Flows,”|”)&”;”& LOOKUP(INDEX(1,Prop.FlowsToShow),Prop.Flows,”|”)&”;”& LOOKUP(INDEX(2,Prop.FlowsToShow),Prop.Flows,”|”)&”;”& LOOKUP(INDEX(3,Prop.FlowsToShow),Prop.Flows,”|”)&”;”& LOOKUP(INDEX(4,Prop.FlowsToShow),Prop.Flows,”|”)
Dynamic connector master shape customisations
Shape Data section
This example works with just 5 Shape Data rows, but the actual solution has 25. These rows simply split the label text using the pipe character, and displays them separately on rows in the Shape Data window.
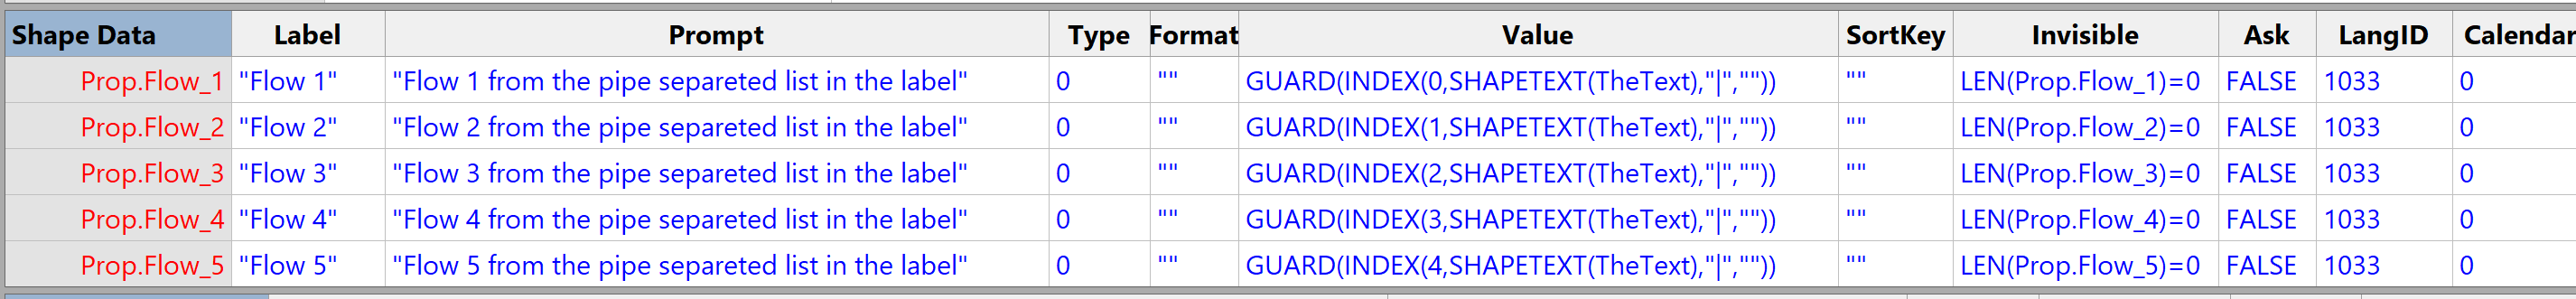
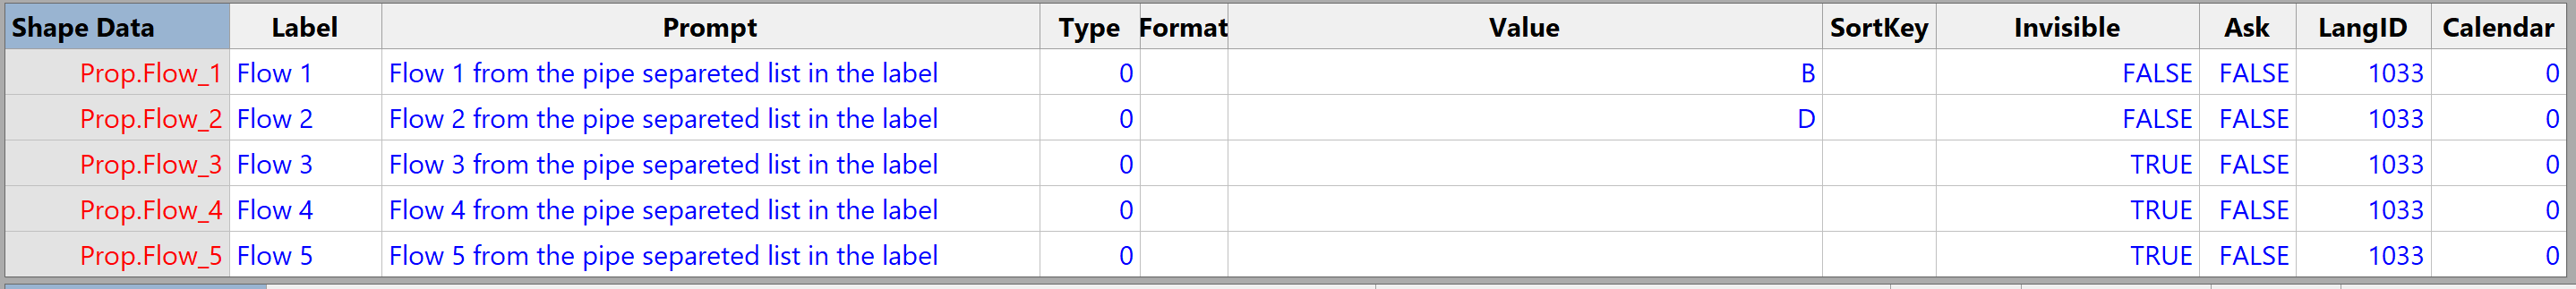
The formula in the Value cell extracts the zero-based item in the pipe separated label, and then makes it read-only:
=GUARD(INDEX(n-1,SHAPETEXT(TheText),"|",""))The formula in the Invisible cell simply makes the row invisible if there is nothing to show:
=LEN(Prop.Flow_n)=0User-defined Cells section
These formulas in this section uses the
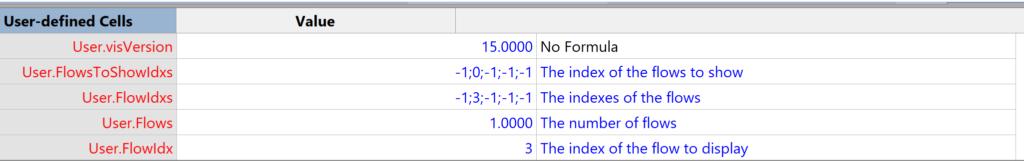
The formula in the Value cell of the FlowsToShowIdxs row creates a list of the indexes of the flows in the label that need to be displayed:
=
LOOKUP(Prop.Flow_1,ThePage!Prop.FlowsToShow,";",-1)&";"&
LOOKUP(Prop.Flow_2,ThePage!Prop.FlowsToShow,";",-1)&";"&
LOOKUP(Prop.Flow_3,ThePage!Prop.FlowsToShow,";",-1)&";"&
LOOKUP(Prop.Flow_4,ThePage!Prop.FlowsToShow,";",-1)&";"&
LOOKUP(Prop.Flow_5,ThePage!Prop.FlowsToShow,";",-1)
The formula in the Value cell of the Flows row provides a count of the number of flows in the label that need to be displayed:
=SUM(
INDEX(0,User.FlowsToShowIdxs)>-1,
INDEX(1,User.FlowsToShowIdxs)>-1,
INDEX(2,User.FlowsToShowIdxs)>-1,
INDEX(3,User.FlowsToShowIdxs)>-1,
INDEX(4,User.FlowsToShowIdxs)>-1)
The formula in the Value cell of the FlowIdxs row creates a list of the indexes of the flows in the label that need to be displayed:
=
INDEX(INDEX(0,User.FlowsToShowIdxs),ThePage!User.FlowIdxs,";",-1)&";"&
INDEX(INDEX(1,User.FlowsToShowIdxs),ThePage!User.FlowIdxs,";",-1)&";"&
INDEX(INDEX(2,User.FlowsToShowIdxs),ThePage!User.FlowIdxs,";",-1)&";"&
INDEX(INDEX(3,User.FlowsToShowIdxs),ThePage!User.FlowIdxs,";",-1)&";"&
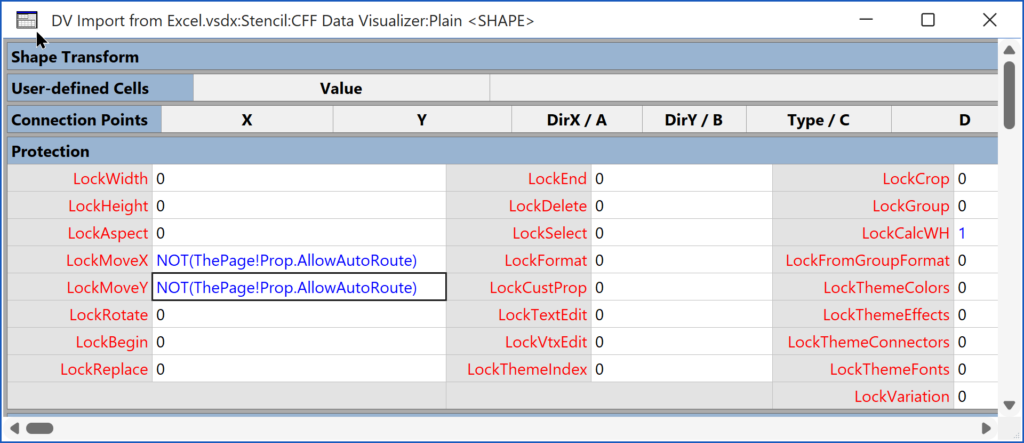
INDEX(INDEX(4,User.FlowsToShowIdxs),ThePage!User.FlowIdxs,";",-1)Protection section
This customization prevents the accidental disconnection of the connectors when the page Allow Edit Connectors Shape Data row value is FALSE.
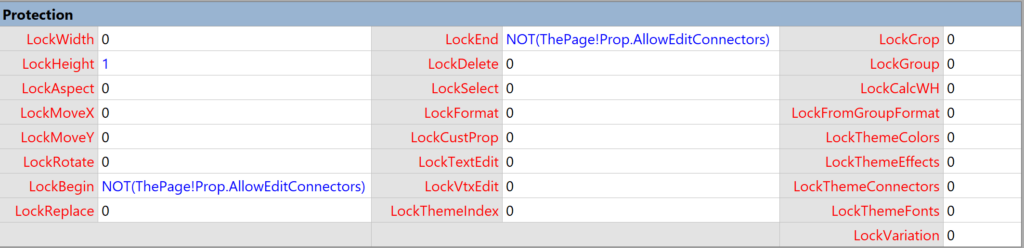
The formula in the LockBegin and LockEnd cells is:
=NOT(ThePage!Prop.AllowEditConnectors)Miscellaneous section
This customization hides the connector label, toggled the routability of the connectors, and updates the screen tip.
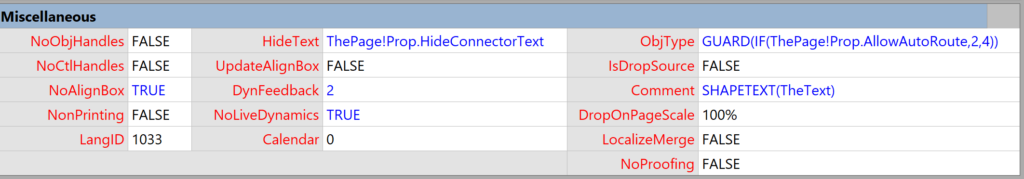
The HideText formula hides the label text if the page Hide Connector Text Shape Data row value is TRUE:
=ThePage!Prop.HideConnectorTextThe ObjType formula toggles the connector shape as routable and not routable when the page Allow Auto Route Shape Data row is toggled between TRUE (default) and FALSE:
=GUARD(IF(ThePage!Prop.AllowAutoRoute,2,4))The Comment formula simply displays the label as the screen tip:
=SHAPETEXT(TheText)Line Format section
The custom formulas in this section change the line pattern, weight, color and transparency by referencing the label text and the page User-defined Cells and Shape Data values.

The LinePattern formula gets the pattern associated with the first valid flow text.
=GUARD(
IF(OR(LEN(SHAPETEXT(TheText))=0,ThePage!User.FlowIdxs<0),
THEMEGUARD(IF(ISTHEMED(),THEMEVAL("ConnectorPattern"),1)),
INDEX(User.FlowIdx,ThePage!Prop.Patterns,"|",1))
)
The LineWeight formula reduces the line thickness if there are no flows:
=IF(User.Flows<1,
THEMEGUARD(IF(ISTHEMED(),THEMEVAL("ConnectorWeight"),0.0033)),
THEMEVAL("ConnectorWeight"))
The LineColor formula gets the colour associated with the first valid flow text.
=GUARD(
IF(OR(LEN(SHAPETEXT(TheText))=0,LEN(ThePage!Prop.FlowsToShow)=0),
THEMEGUARD(IF(ISTHEMED(),THEMEVAL("ConnectorColor"),0)),
INDEX(User.FlowIdx,ThePage!Prop.Colours,"|"))
)
The LineTransparency formula will either hide the connector completely if it has a label that does not contain any flows to display, or it will be 90% transparent if the page Hide Hidden Connectors value is FALSE:
=GUARD(
IF(OR(LEN(SHAPETEXT(TheText))=0,LEN(ThePage!Prop.FlowsToShow)=0),
0,
IF(User.FlowIdx>-1,0,IF(ThePage!Prop.HideHiddenConnectors,1,0.9)))
)
The CFF Data Visualizer master shape customisations
The CFF Data Visualizer master shape also needed to be customised with the same Allow Auto Route page Shape Data property as the Dynamic connector so that it can also be prevented from moving when this value is TRUE.
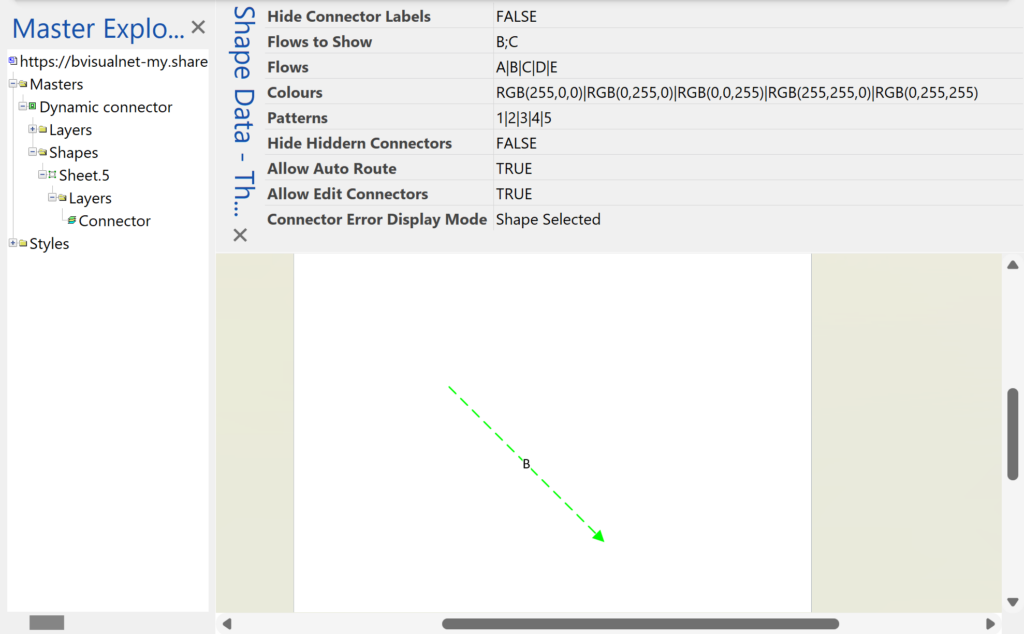
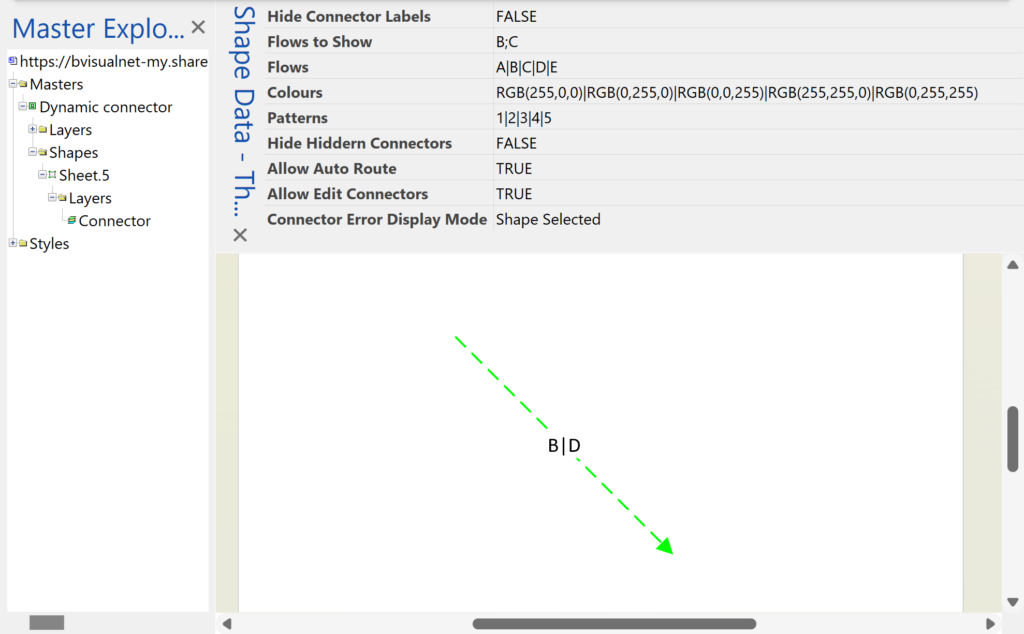
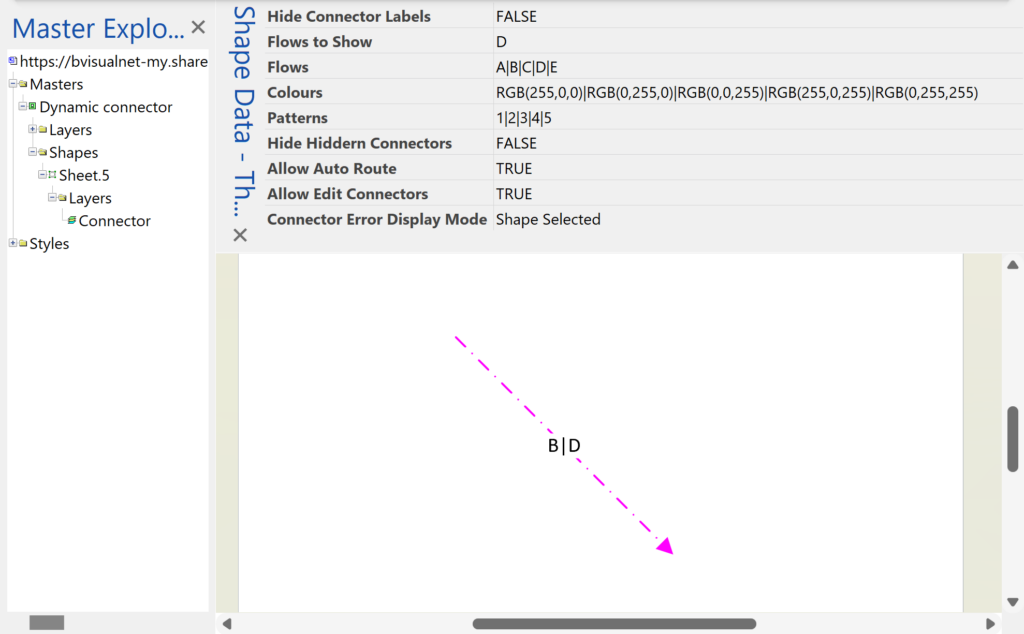
Highlighting one or more flows
I am now able to selectively display one or more flows in the diagram created by DV. I simply ensure that the page Flows, Colours and Patterns has a pipe-separated list of all the possible flows, their colours and patterns, before entering the desired value or semi-colon separated values in the Flows to Show Shape Data row.
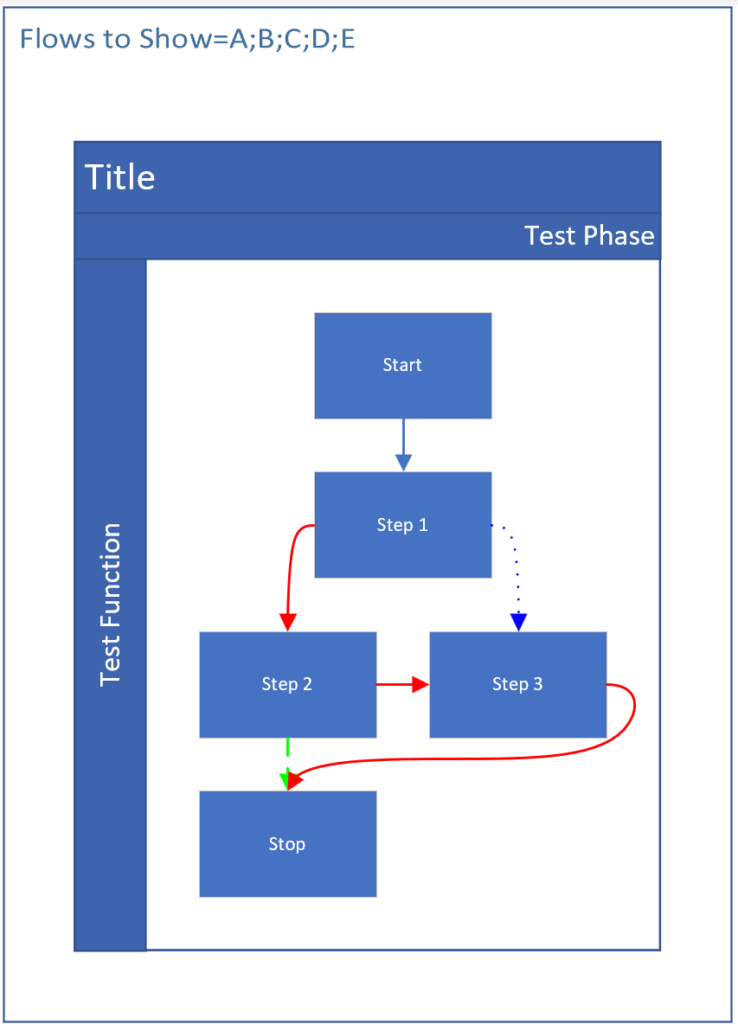
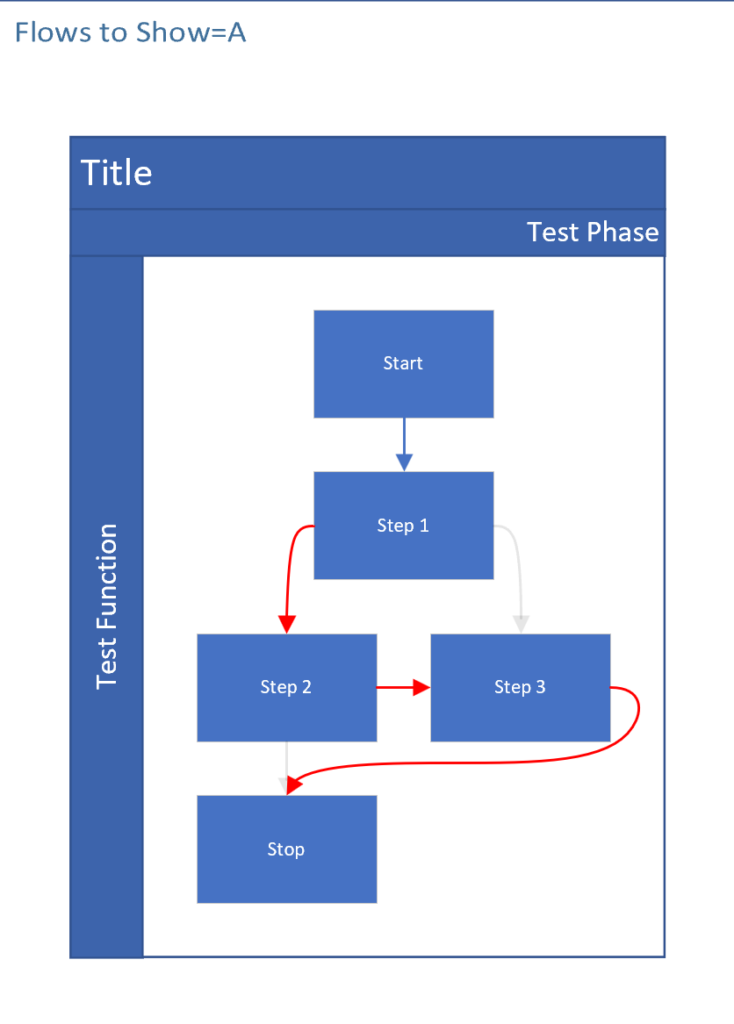
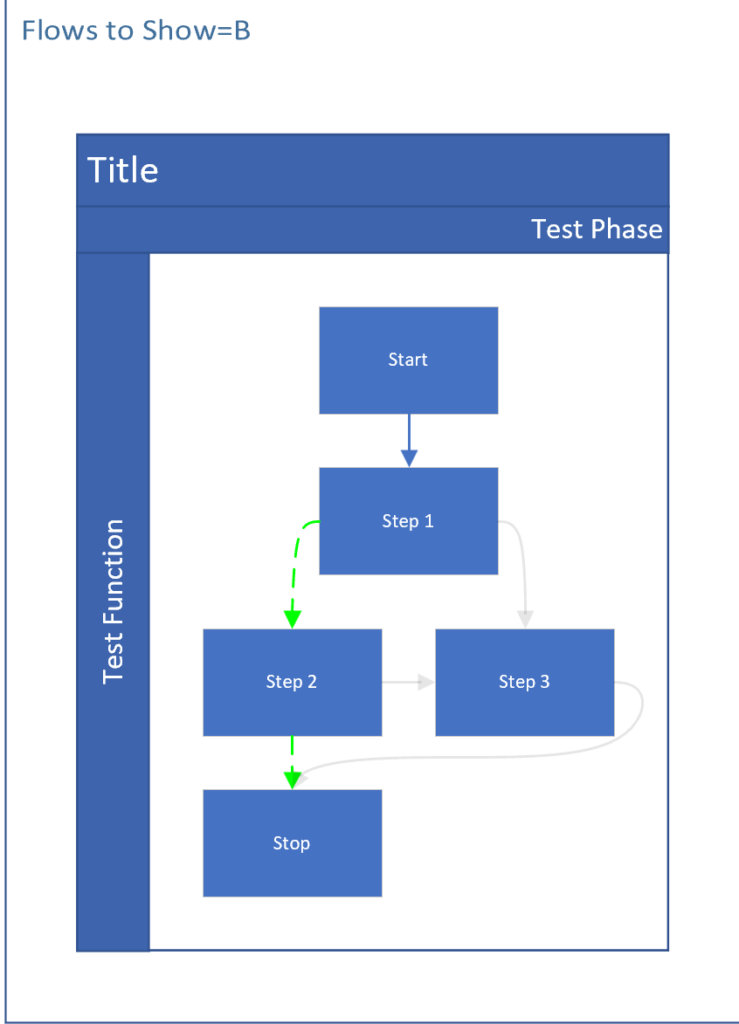
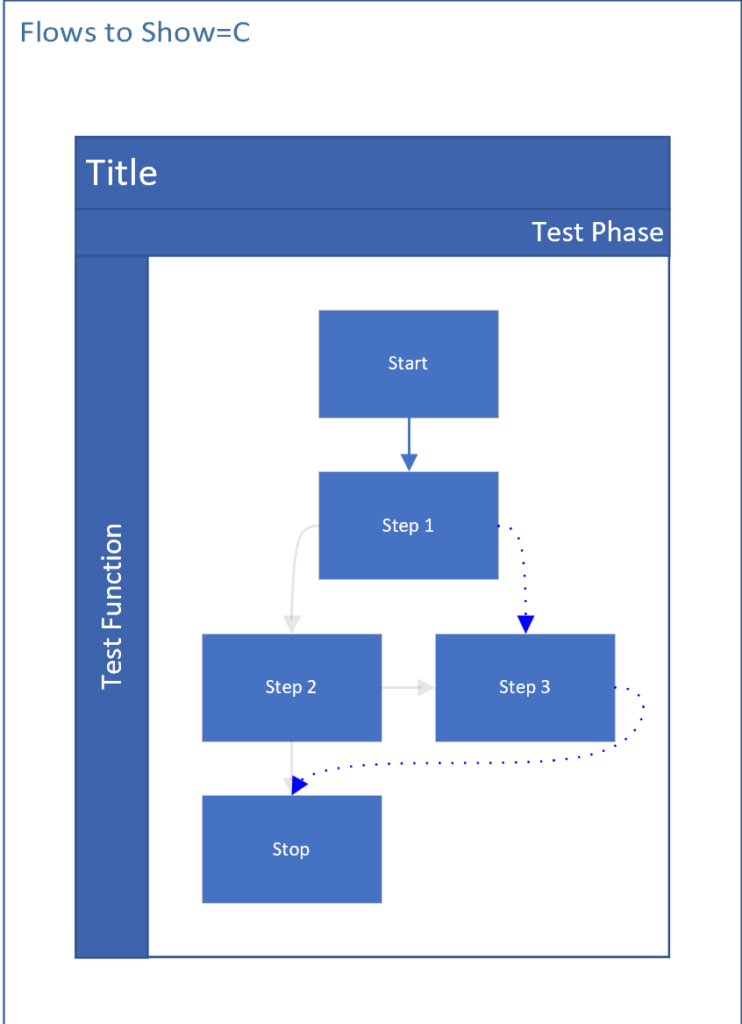
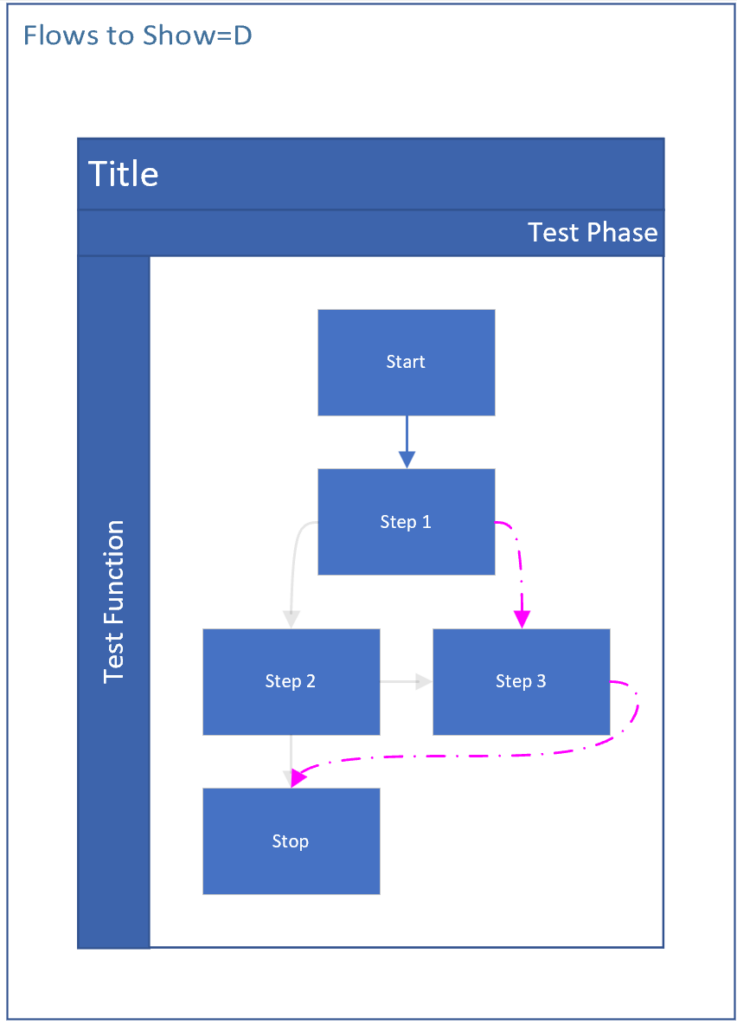
If there are no valid values in the Flows to Show Shape Data row, then all lines are displayed.
A peak at the original request
I have shown a trivial example with a single function and a single phase with just five process shapes, but the following screenshots are from the user’s actual project which has over 220 flowchart shapes and up to 22 flows through the same connectors.:
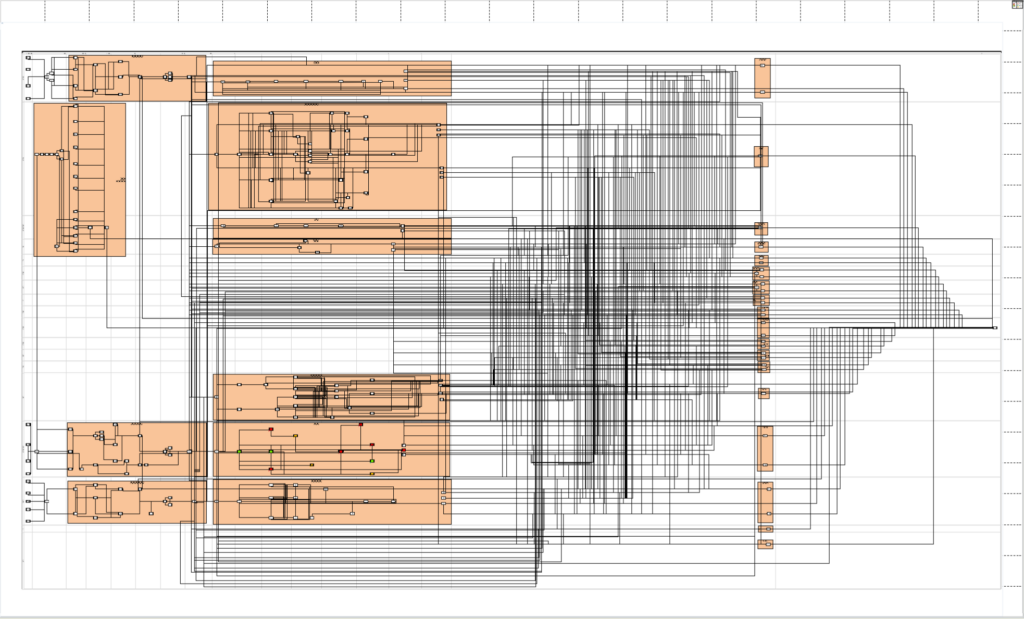
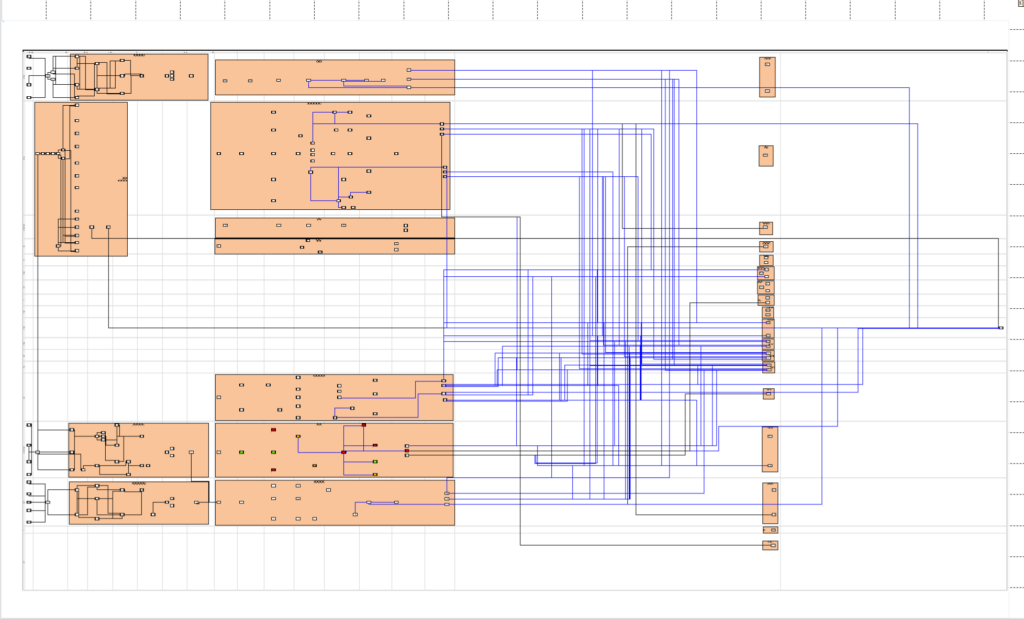
I have taken time to describe how this works because I believe it might be useful to anyone who needs selectively display flows through a diagram automatically created by Data Visualizer.
Related posts

Migrating from Lucidchart to Visio?
My fellow Visio MVP, Michel Laplane, and I recently converted and transformed 15k Lucidchart documents to Microsoft Visio for a large multi-national organization. This was approximately 4 years after they had moved from Visio to Lucidchart! I do not know the full reason behind these changes in technology, and I do not have a particular…

Creating a Dynamic connector master automatically
I have been creating Microsoft Visio solutions for 30 years now … my first was in 1996! I have been an advocate for custom Masters from the very start, every since I learnt how editing the Master can automatically update all of its instance shapes can be automatically updated throughout the document. Whenever you drag…
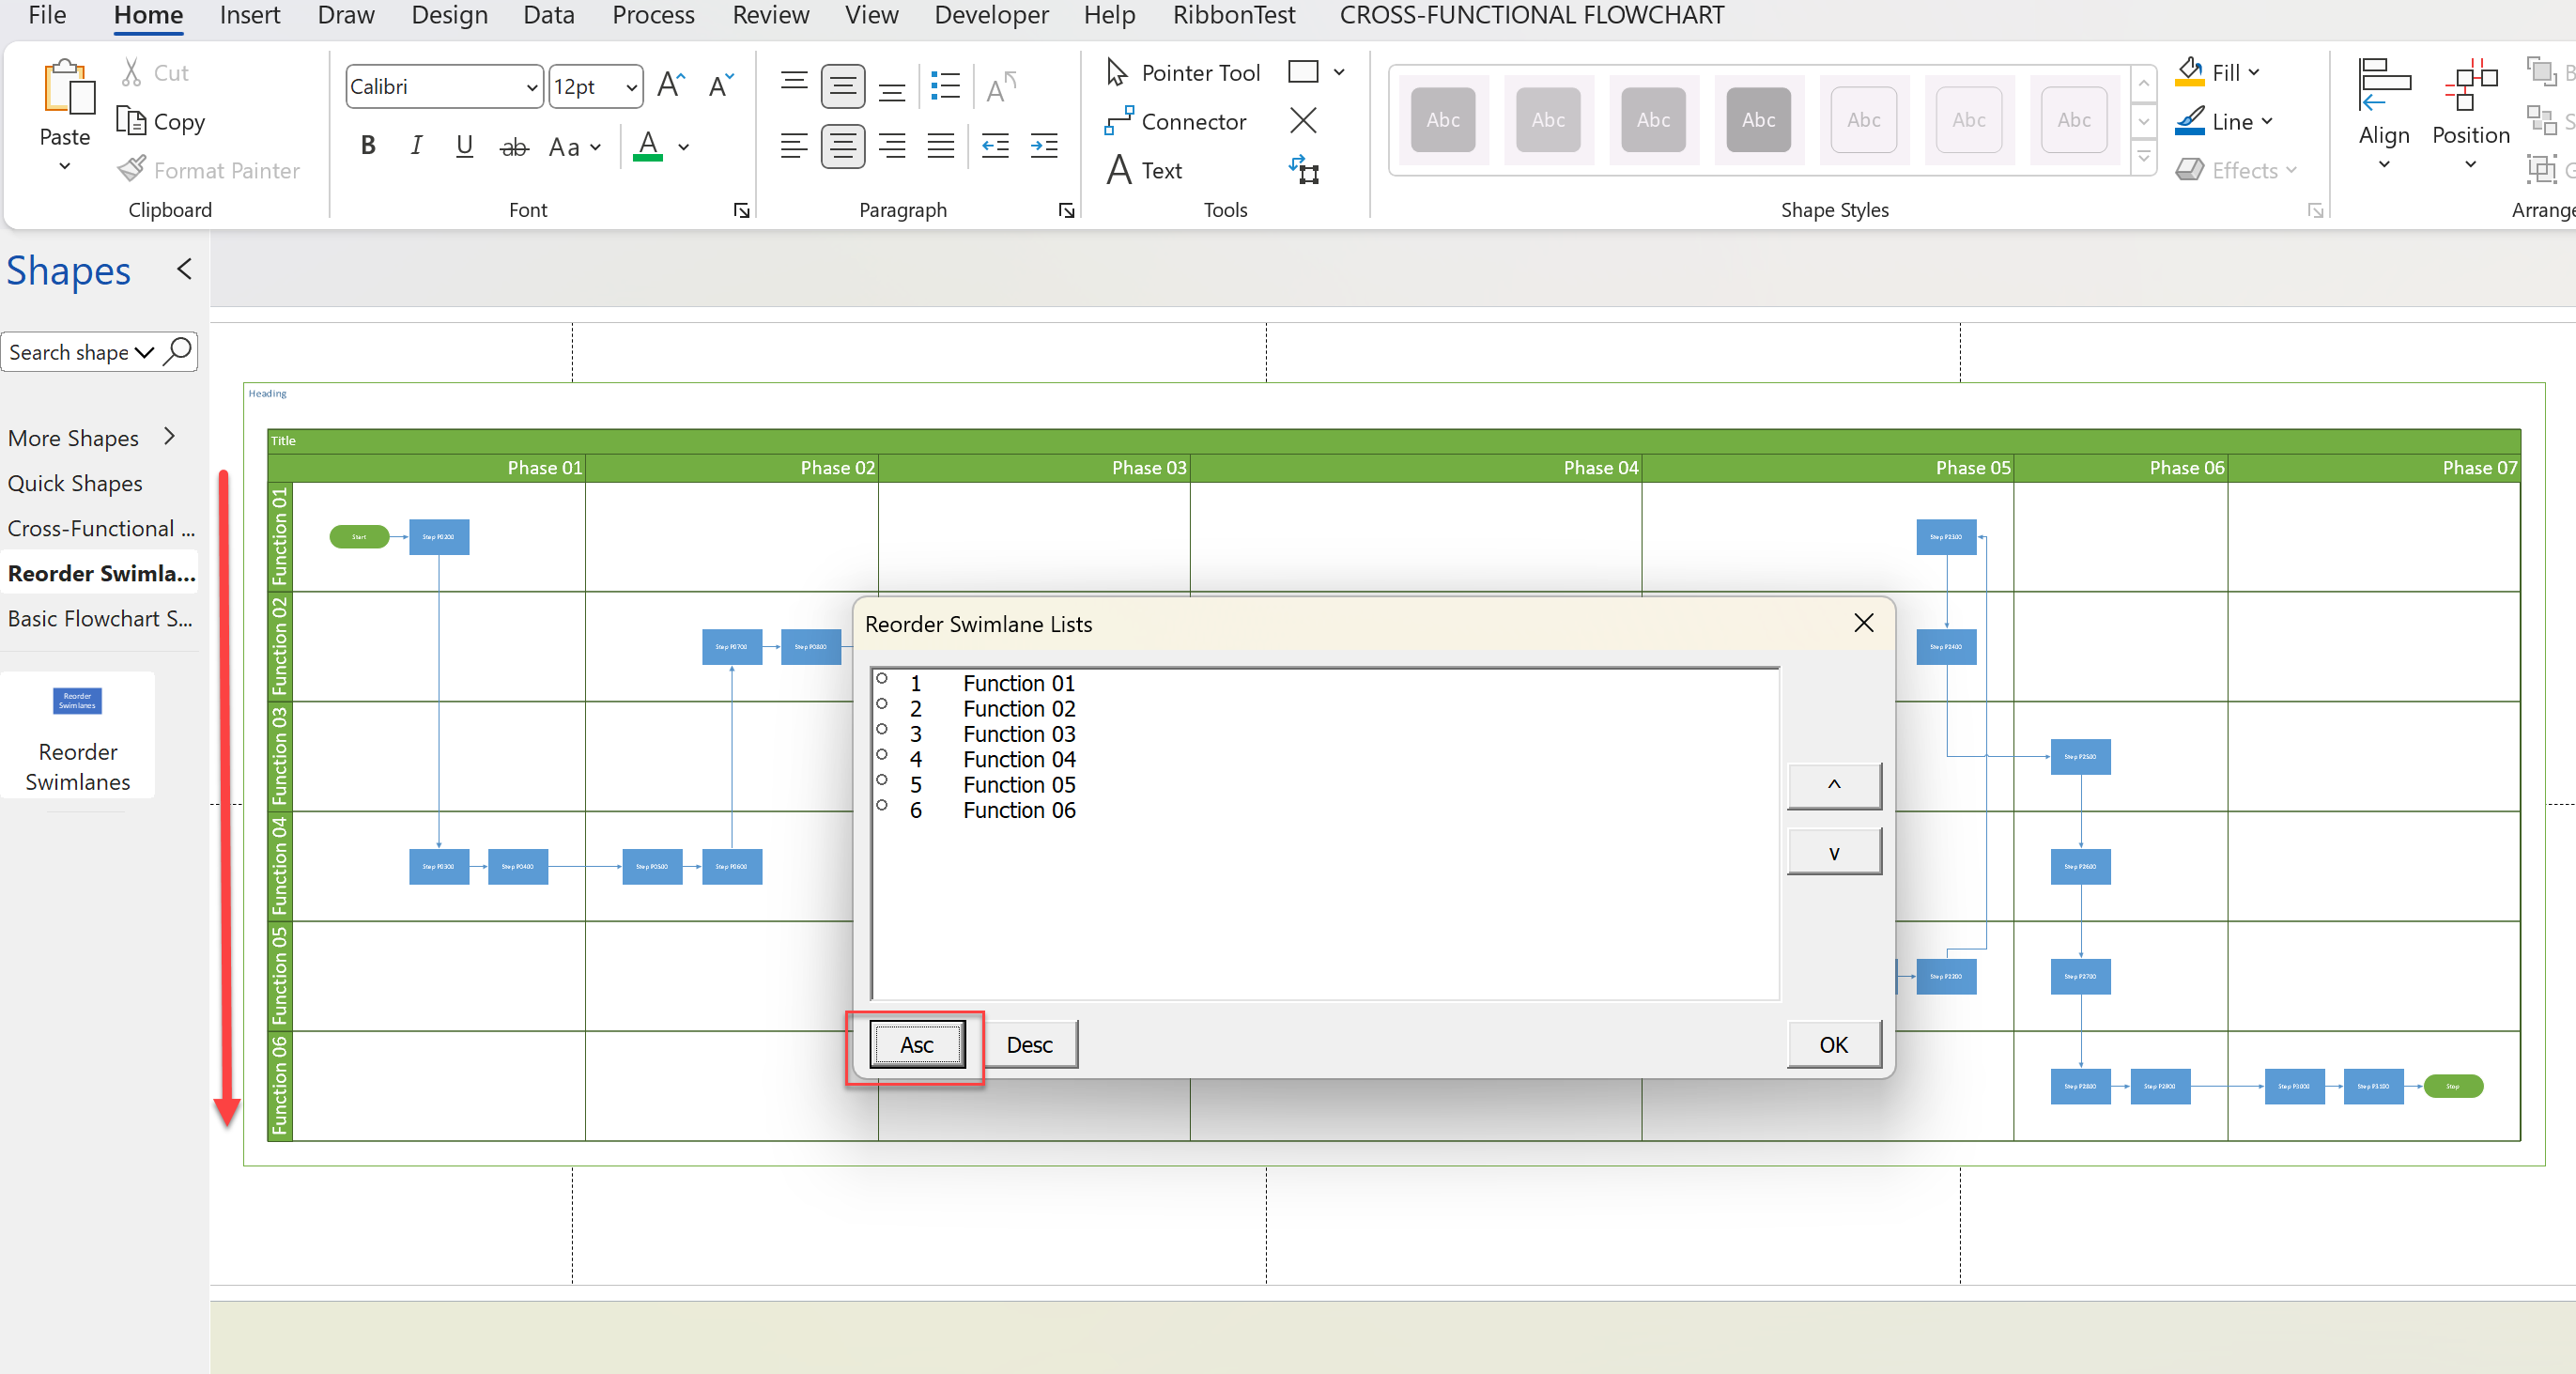
Optimize Visio Flowcharts: Swimlane Reordering Tips
Microsoft Visio desktop Plan 2 and Professional editions provides the ability to create and synchronize cross-functional flowcharts between the diagram and an Excel table. This is great, and widely used for many types of processes. The Excel table normally has a Function / Swimlane column that contains text that becomes labels on the swimlane containers,…
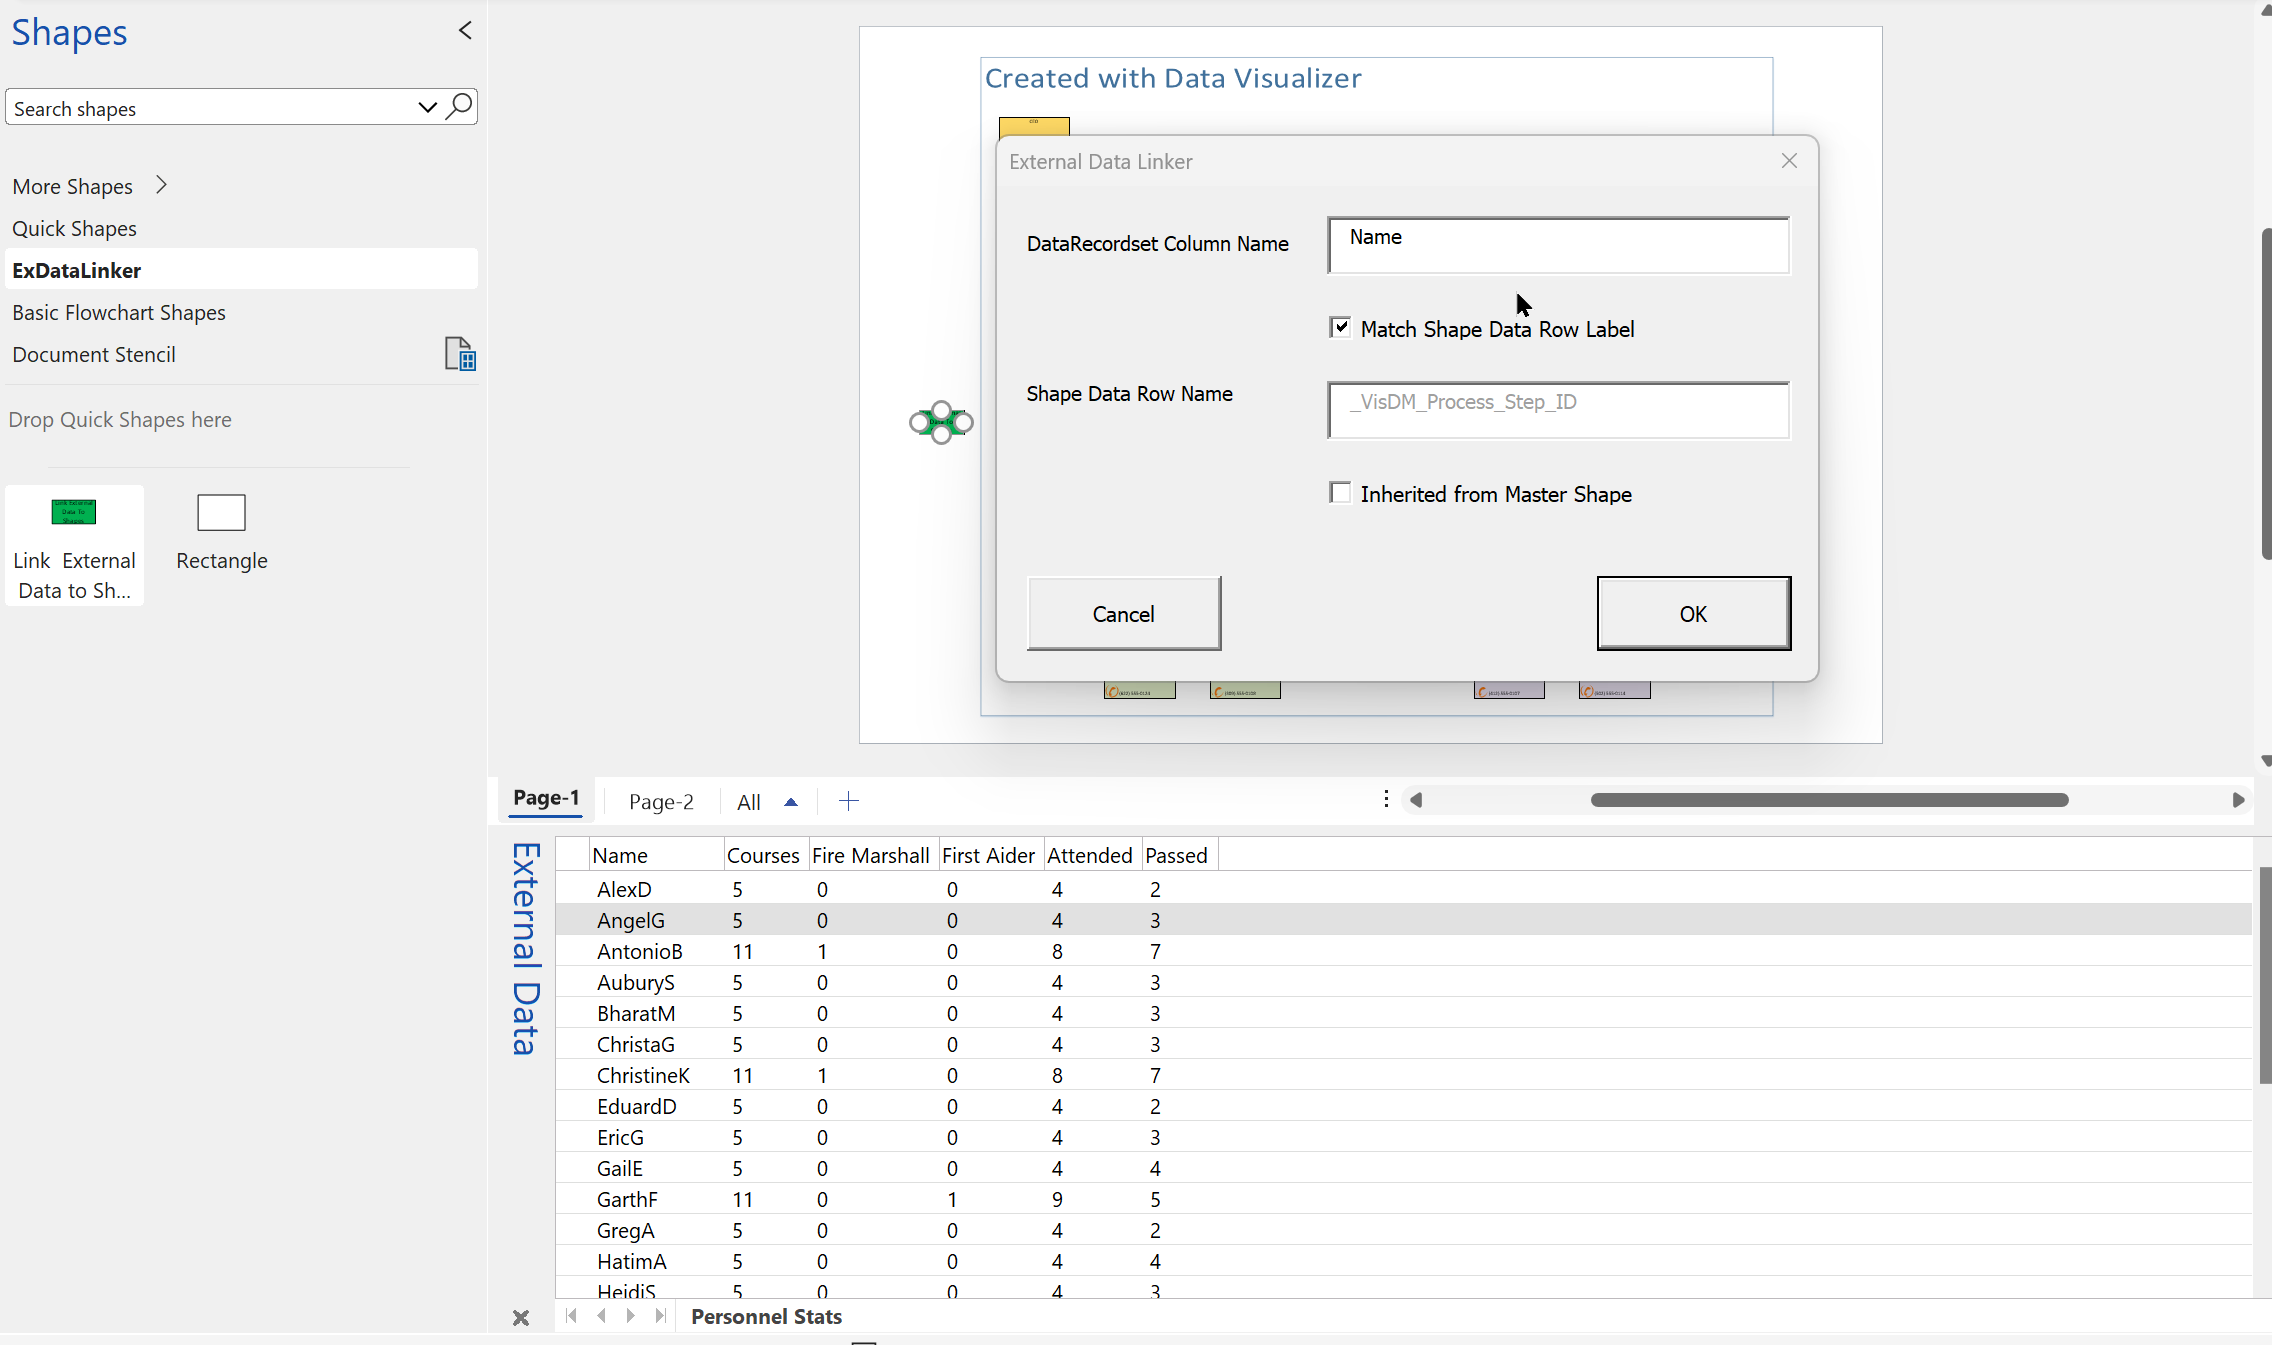
Linking Data to Shapes in Visio after using Data Visualizer
Data Visualizer (DV) in Visio Plan 2 (Data | Create from Data | Create ) is great because it provides a way of automatically creating a diagram from data, but it also prevents some of the other data-linking features in Visio from being used. This is because DV wants to take control of the data…
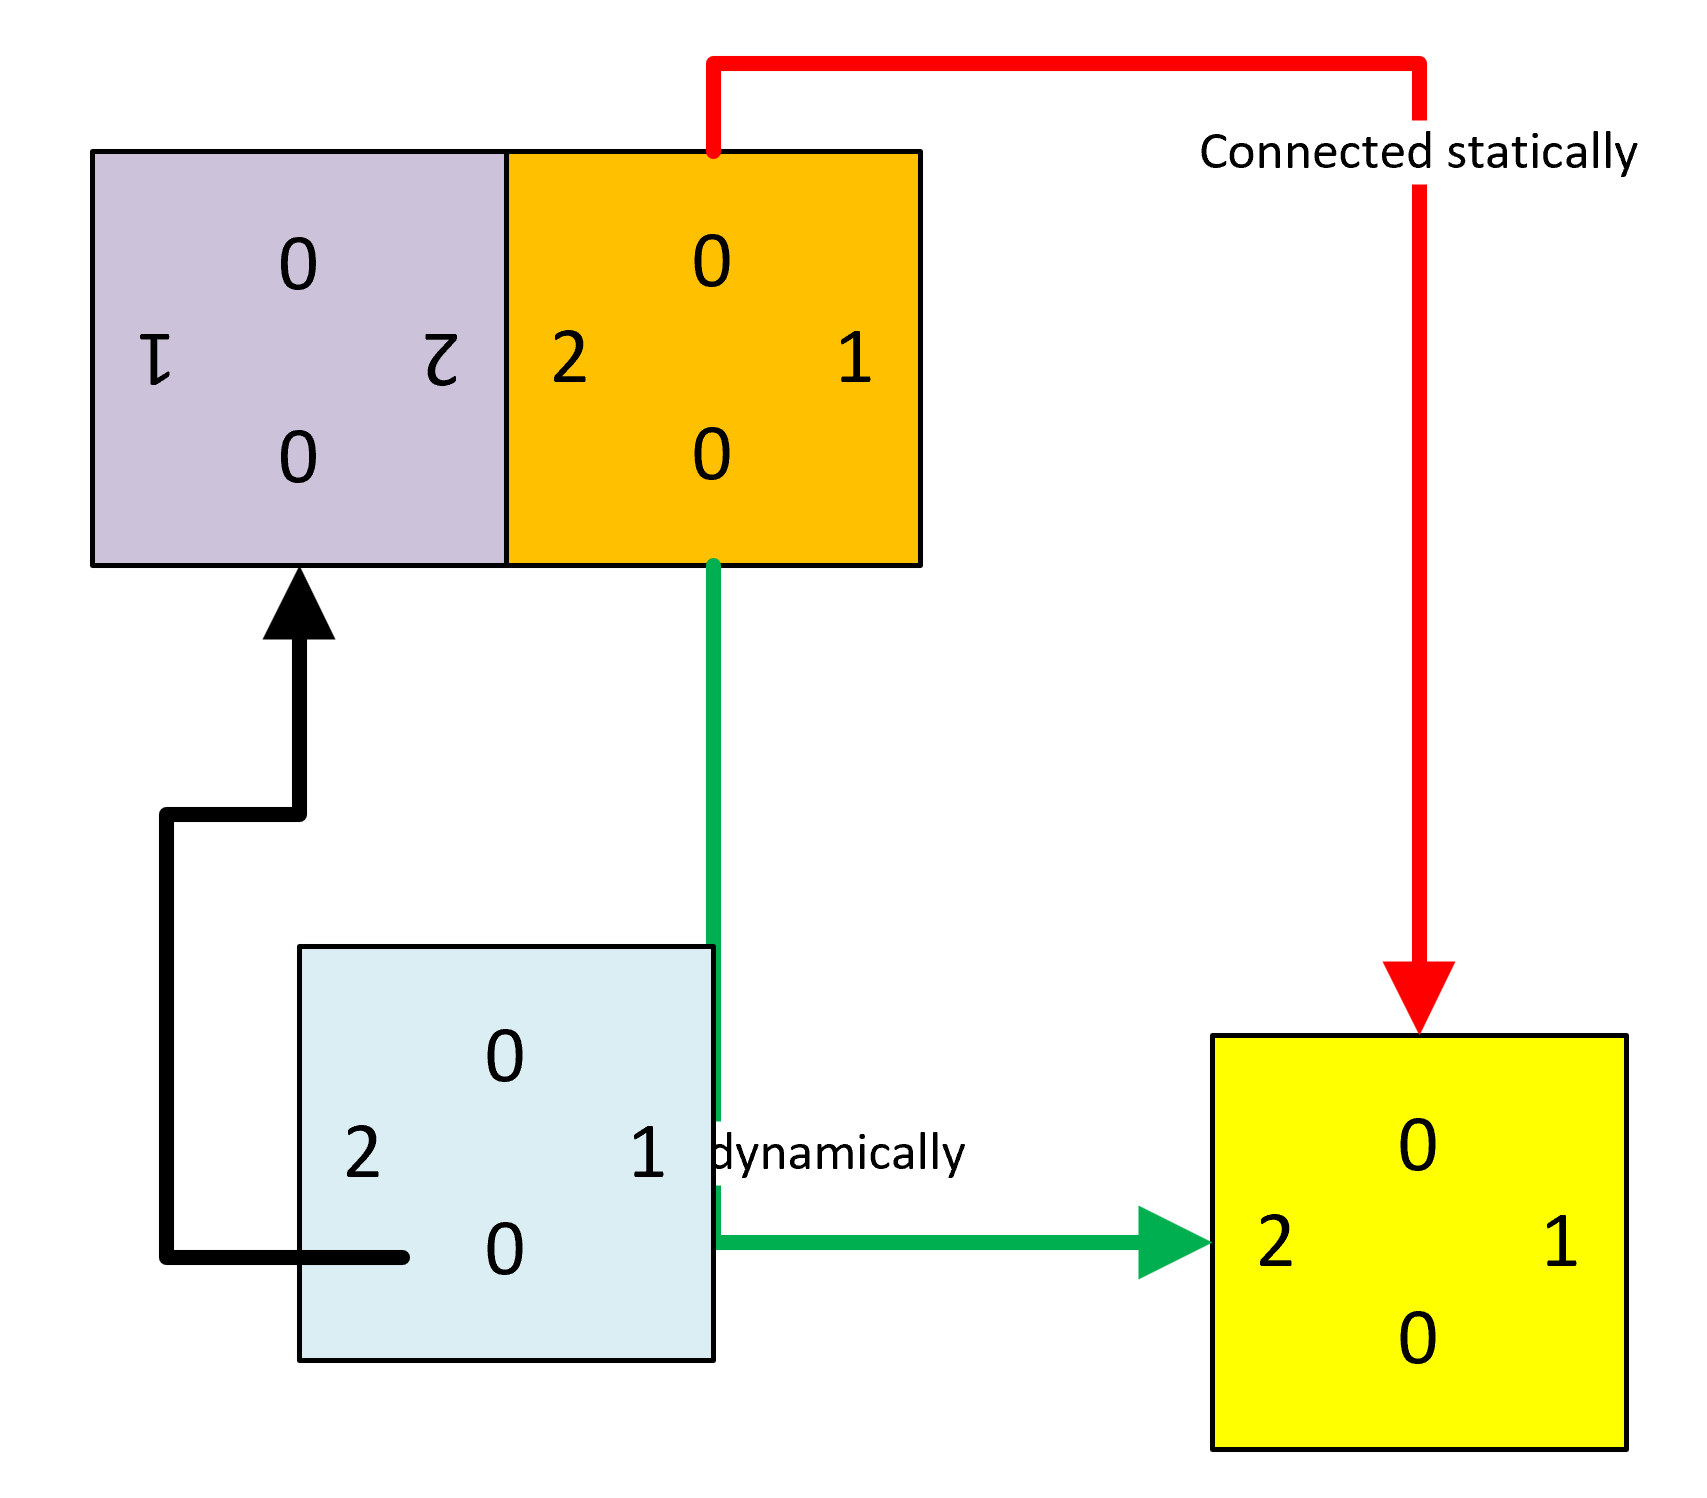
Counting glued and connected shapes in Visio
I got a surprise in one of my projects when I counted the shapes glued together using the Shape.GluedShapes(…) method … the sum of the filtered glued shapes just didn’t add up to the unfiltered count. So, I thought I should check the Shape.ConnectedShapes(…) method too … and there is a scenario where that has…

My new book on Visualizing Processes with Microsoft Visio has launched
Back in the early 1990s, there was an application called ABC Flowcharter that was the market leader for diagramming business flowcharts, but some of the brains behind Aldus PageMaker saw an opportunity to create something smarter, and left to write the Visio product, with the stated aim to overtake ABC Flowcharter within 2 years. They…
Hello David,
thank you, that is a very good article and guide. I’m planning and diagramming IP networks. Do you think, that it could be possible, to use the DV for drawing IP network diagrams?
Yes it could be done, but you will probably want to create a custom template with a different default layout setting, such as Radial or Circular
This was very informative and useful! I got lost for a bit because I didn’t realize objects had their own Page data, and I was trying to enter data into the master page data. Also, I was wondering if you had any thoughts on how to use other properties of a shape besides SHAPETEXT. For instance, I have a “Status” data field that gets added via Data Visualizer. I wanted to use a similar INDEX(LOOKUP()) methodology that you used for the custom coloring on the connectors to selectively make objects transparent. I could use the default data graphics if I have to, but I really hate how limited their options are. Overall, thank you so much for this article, it helped me beyond belief.