Back in the early 1990s, there was an application called ABC Flowcharter that was the market leader for diagramming business flowcharts, but some of the brains behind Aldus PageMaker saw an opportunity to create something smarter, and left to write the Visio product, with the stated aim to overtake ABC Flowcharter within 2 years. They did it in just 18 months and Visio expanded to cover more types of diagramming, especially organization charts and network diagramming. Visio became the default vector-based, data-diagramming application for the desktop, and so Microsoft acquired the company in 2000, who started to integrate it with Microsoft Office applications. Many imitators on the desktop tried to emulate Visio, but most fell by the wayside. There were constant requests for Visio to work on Apple Macs, but Microsoft resisted making a Mac specific version, and instead started to make Visio work in a web-browser, so it can work anywhere on any modern device. There are literally millions of lines of code on Visio, so it was never going to be straightforward or easy, but now we do have a light edition of Visio provided to all M365 business subscribers, and two extra subscription levels for more features and capabilities. We still have desktop Visio Standard and Professional, but the edition that straddles both the desktop and web is Visio Plan 2. It has some desktop only features delivered via web-services, and an enhanced browser-based editing experience. Visio Plan 2 is the edition for heavy or advanced users, but any of the desktop editions can be viewed as a design studio for content that can be used by the browser users because of Visio’s unique ShapeSheet feature that contains Excel-like formulas to control the properties of the shapes. Almost all of these formulas work in the web browser, but desktop Visio is required to write the formulas initially. This means that powerful customizations are possible without any web-scripting, and achievable by anyone who can write formulas in Excel!
So, this new book focuses on the original driver for Visio, process flowcharts, and explains how the different Visio editions can be used to create, edit, collaborate, comment, present, automate, export them, and finally how to customize them. Find out more at Visualize Complex Processes with Microsoft Visio!

I drafted in my longtime friend and fellow Visio MVP, Šenaj Lelić, of OneAssist.de to help with the chapter on Business Process Model Notation and security because of his experience in these areas.
Related posts

Creating Boolean Context Menus in Visio
Over the many, many years that I have been creating Microsoft Visio solutions, I have had to create numerous right-mouse context menus for shapes to control their Shape Data values. Over that time, patterns emerge, so this article is highlighting three different appearances for simple Boolean values, otherwise known as True/False or Yes/No values, and…

A visual exploration of Penrose Tiling in Visio
Maybe it is because I used to be a building architect, but I have always been fascinated by the relationship between numbers and visualisations. Perhaps the most famous one is the Golden Ratio which has been used as the basis of many building designs and art pieces. It is often recognised to create a harmony…
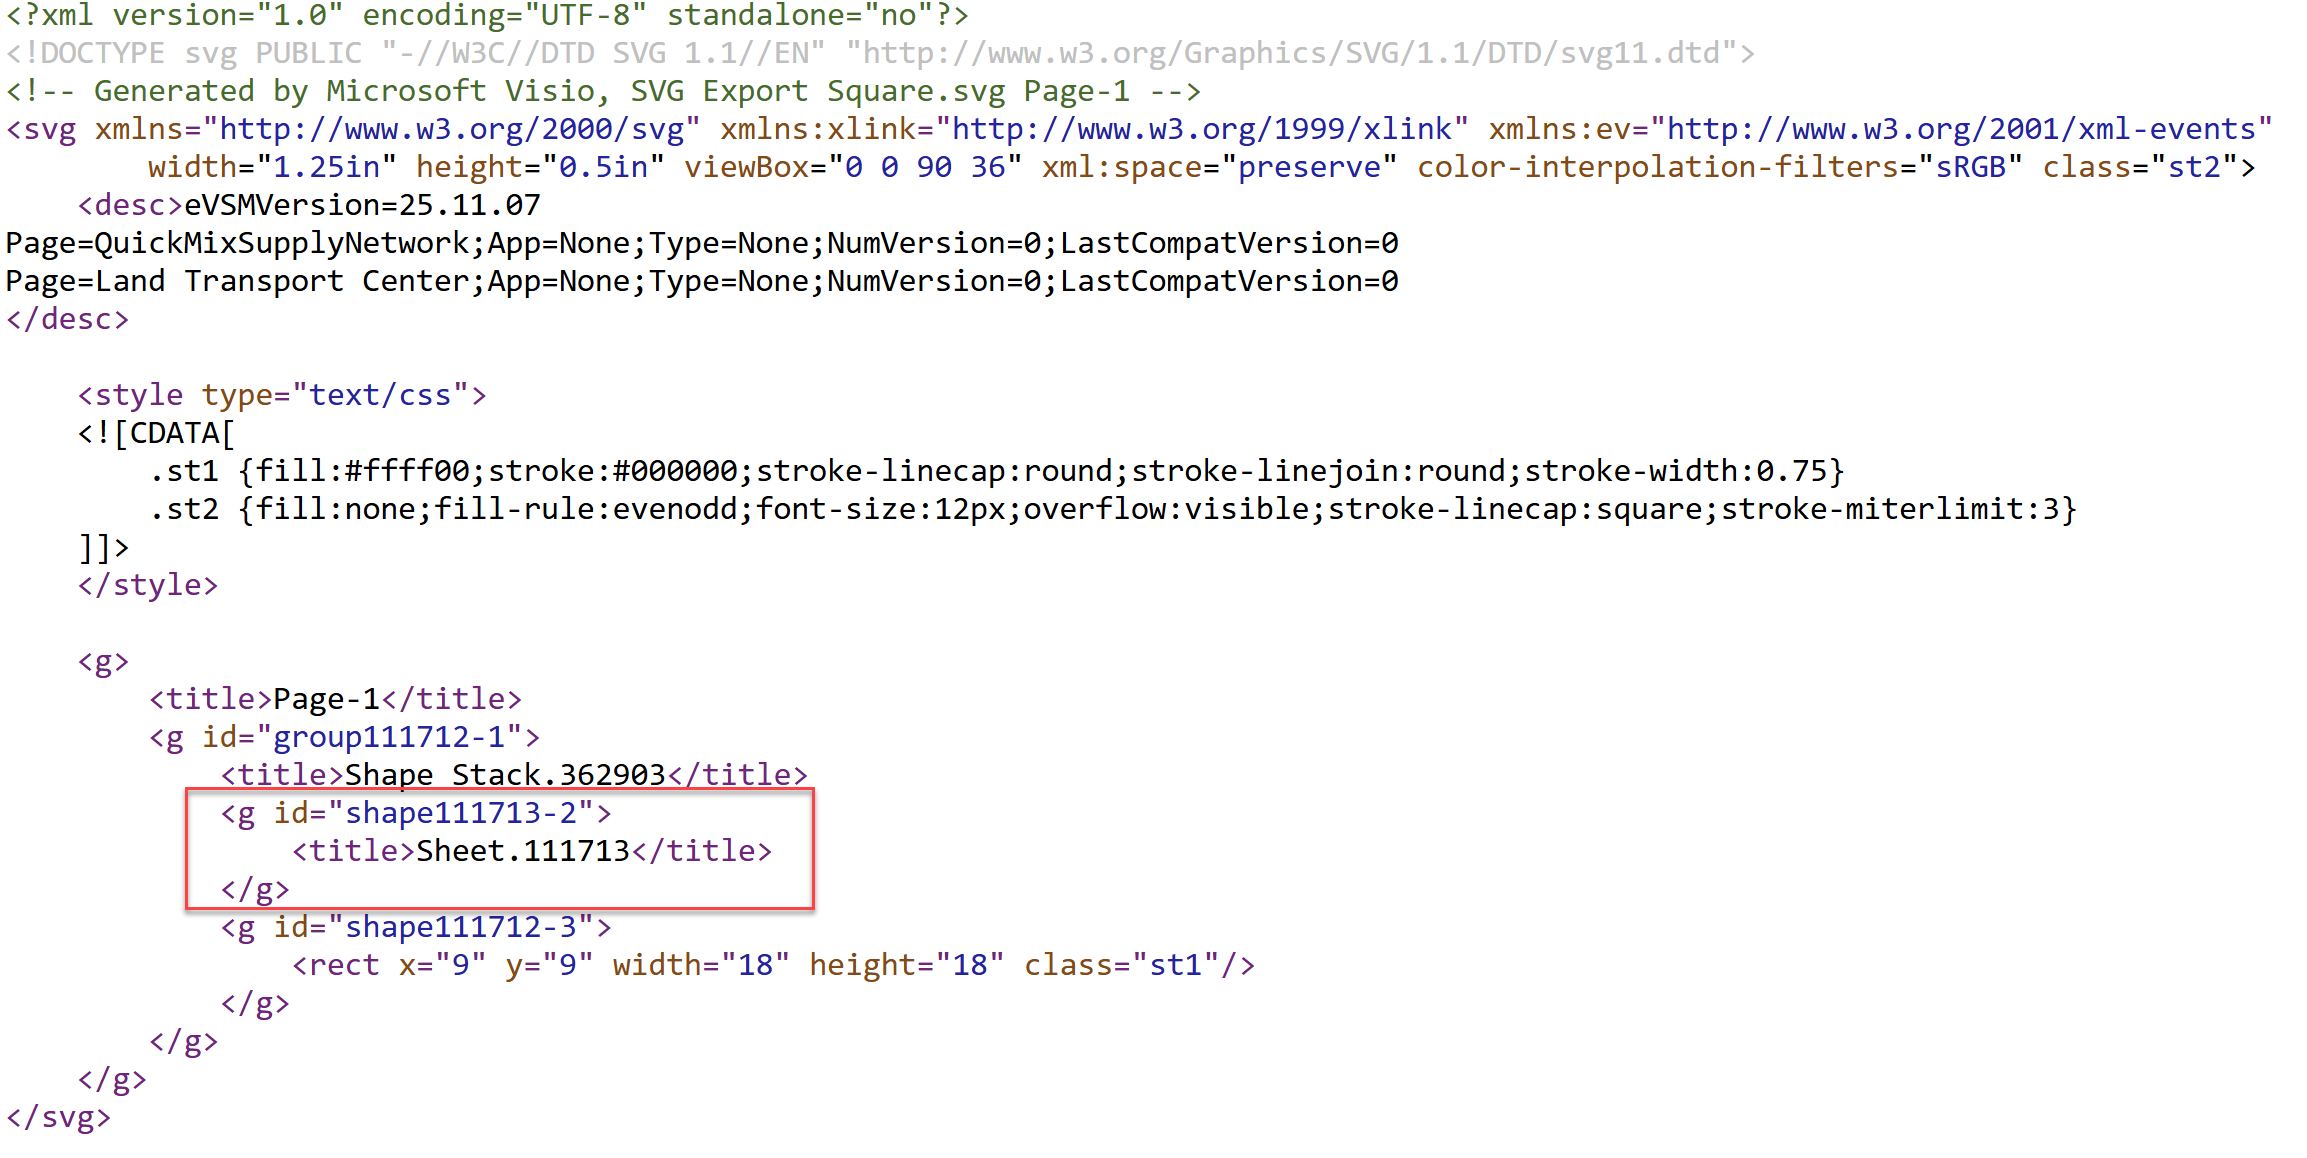
How SVG in Visio can cause a Shape.BoundingBox(…) error
I have used Visio’s Shape.BoundingBox(…) for many, many years and I cannot ever recall it failing, but I have now managed to create some shapes that cause it to error. This caused many hours of confusion, so I nearly abandoned using the method, until I discussed it with my fellow Visio MVP, John Goldsmith (see…

Jumping between Shapes in Visio
Many Visio diagrams get quite large, and sometimes it is useful to provide the ability to jump to another shape quickly in the same document, either on a different page or on the same one. Although there is an add-on provided in desktop Visio that is used by the Off-Page Reference shape provided in the…
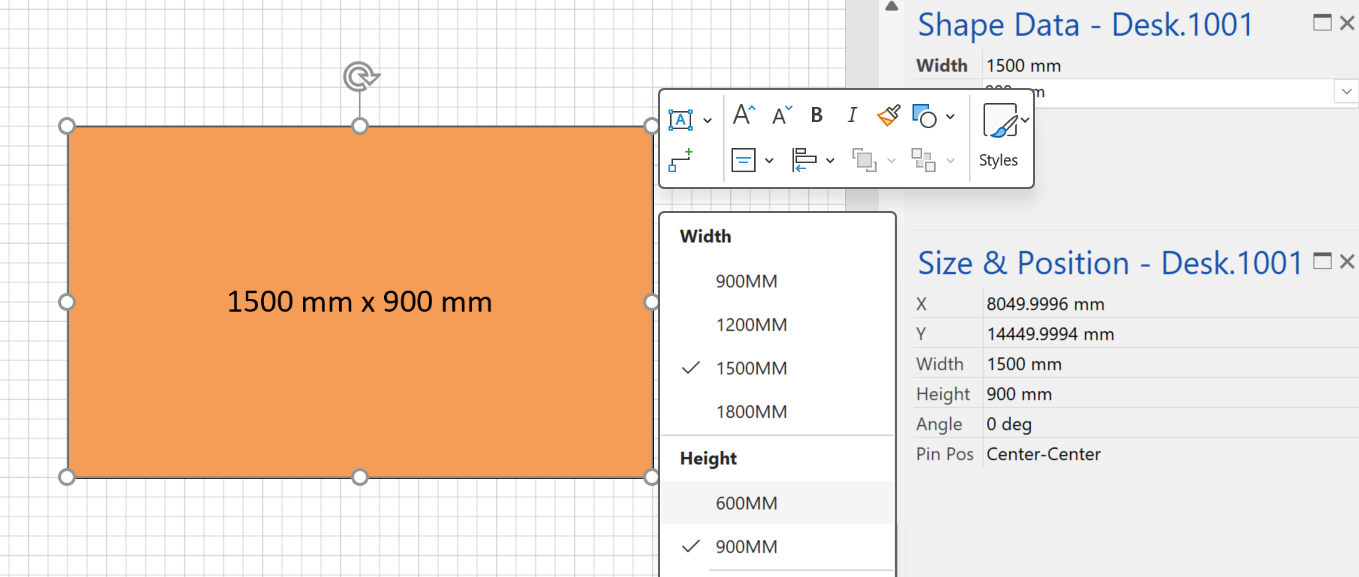
Fixing dimensions of 2D shapes
I am often asked what makes Visio unique and makes it stand out from the crowd, especially in today’s online world. Well, I think there are many reasons, but one of them is the ability to create scaled drawings with parametric components of specific dimensions. This was crucial for my adoption of Visio back in…
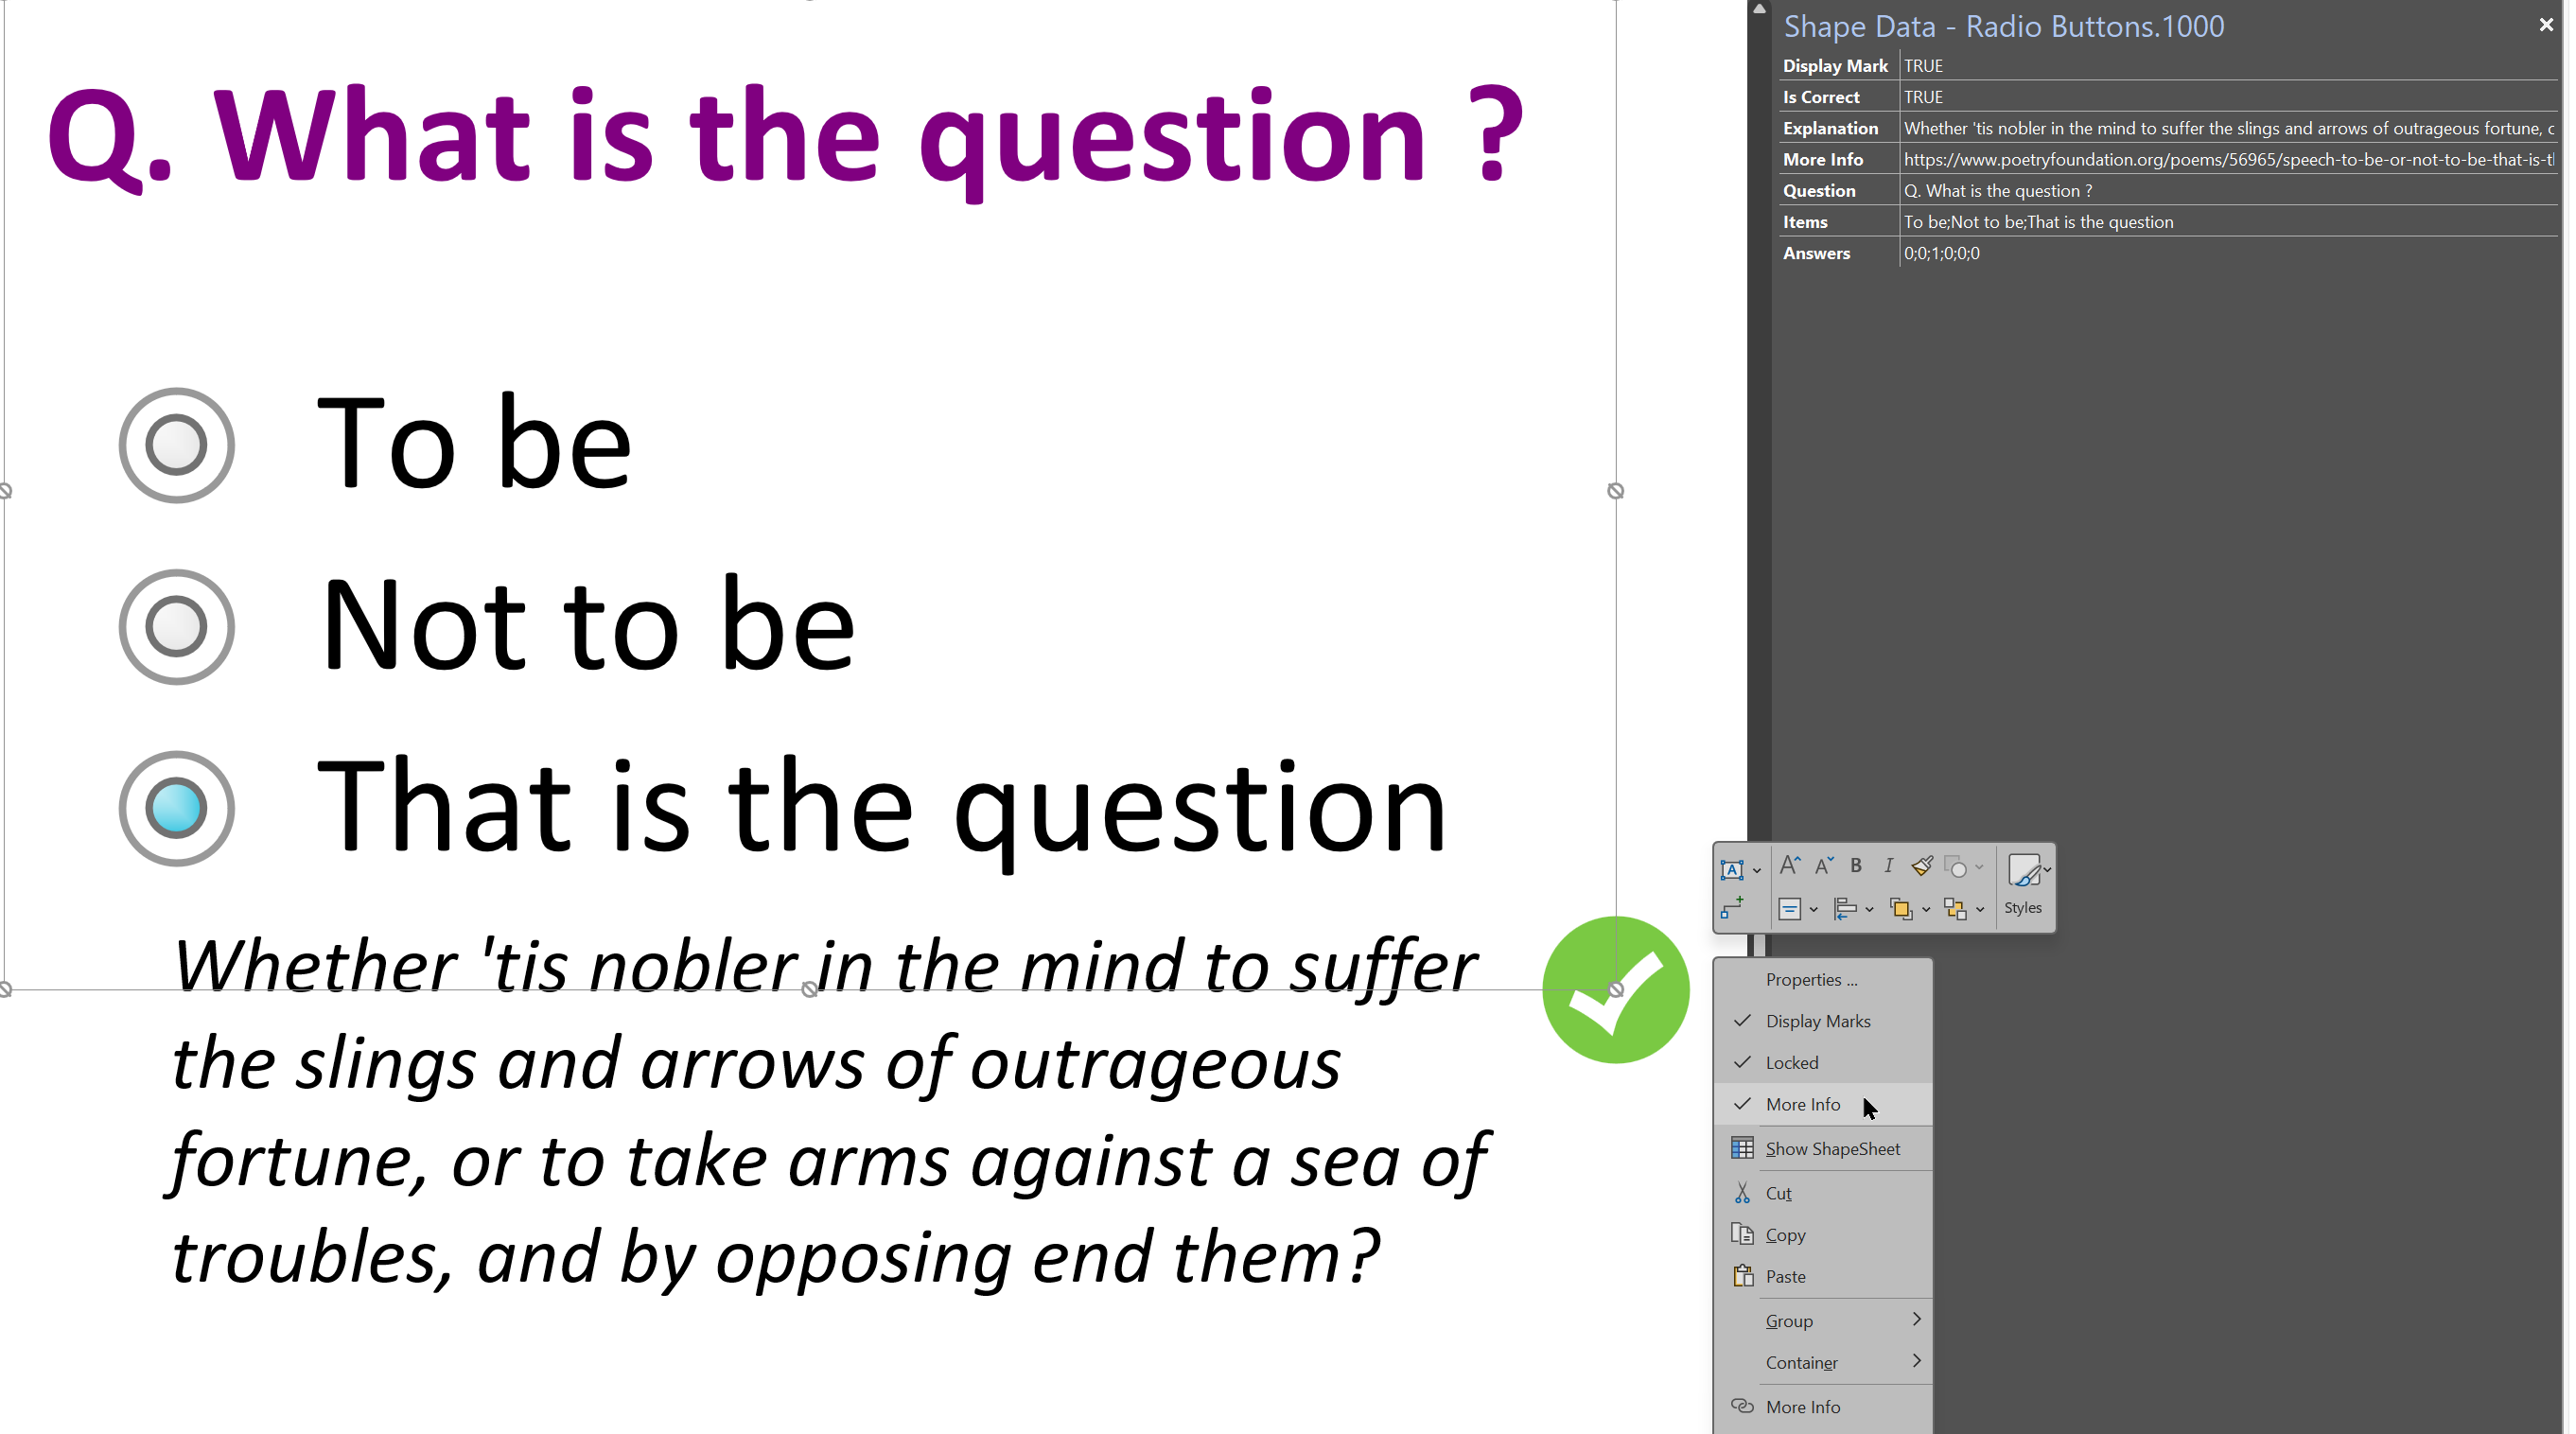
Smart Radio Buttons and Check Boxes in Visio
A recent project requires an interactive tutorial within Microsoft Visio desktop where a lot of the questions need a single answer using radio buttons, or multiple-choice answers using check boxes. I thought that this would be a great use of the list containers capability because the questions and answers could be part of the container…
Leave a Reply
You must be logged in to post a comment.