• Skip to main content
  • Skip to primary sidebar
  • Skip to footer

bVisual

  • Home
  • Services
    • How Visio smartness can help your business
    • Visio visual in Power BI
    • Visio Consulting Services
    • Visio Bureau Services
    • Visio Training and Support Services
  • Products
    • Visio Shape Report Converter
    • SS Plus
    • LayerManager
    • visViewer
    • Metro Icons
    • Rules Tools for Visio
    • The Visio 2010 Sessions App
    • Multi-Language Text for Visio
    • Document Imager for Visio
    • multiSelect for Visio
    • pdSelect for Visio
  • Case Studies
    • Case studies overview
    • Visualizing Construction Project Schedules
    • Visio Online Business Process Mapping
    • Nexans Visio Template
    • CNEE Projects, WorldCom
    • Chase Manhattan Bank
  • News
    • Recent news
    • News archive
  • Resources
    • Articles➡
      • ShapeSheet Functions A-Z
      • Comparing Visio for the Web and Desktop
      • Customising Visio Shapes for the Web App
      • Key differences between the Visio desktop and web apps
      • Using the Visio Data Visualizer in Excel
      • Using Visio in Teams
      • Creating Visio Tabs and Apps for Teams with SharePoint Framework (SPFx)
      • Designing Power Automate Flows with Microsoft Visio
      • Innovative uses of Visio Lists
    • Webcasts ➡
      • Visio in Organizations
      • My session and other Visio sessions at MSIgnite 2019
      • Power up your Visio diagrams
      • Vision up your Visio diagrams
      • The Visio 2010 MVP Sessions
    • Visio Web Learning Resources
    • Books➡
      • Mastering Data Visualization with Microsoft Visio
      • Microsoft Visio Business Process Diagramming and Validation
      • Visualizing Information with Microsoft Visio
  • Blog
    • Browse blog articles
    • Visio Power BI articles
    • Visio for Web articles
    • A history of messaging and encryption
  • About us
    • About bVisual
    • Testimonials
    • Bio of David Parker
    • Contact Us
    • Website Privacy Policy
    • Website terms and conditions
    • Ariba Network

Geographic

Published on December 31, 2019 by David Parker

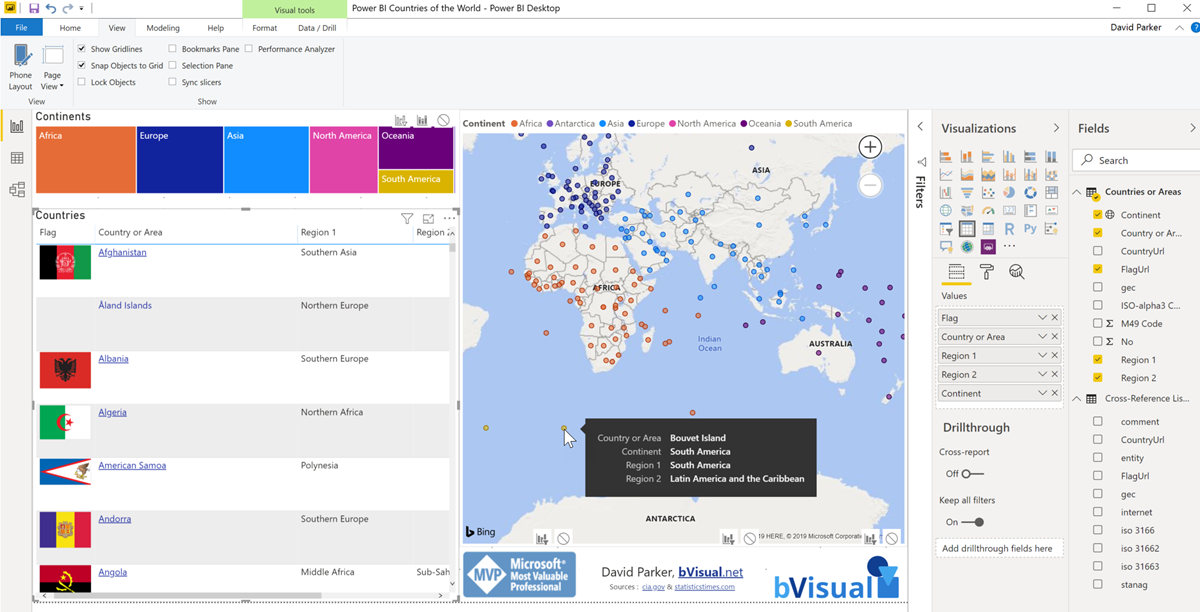
Countries of the World in Power BI with Flags

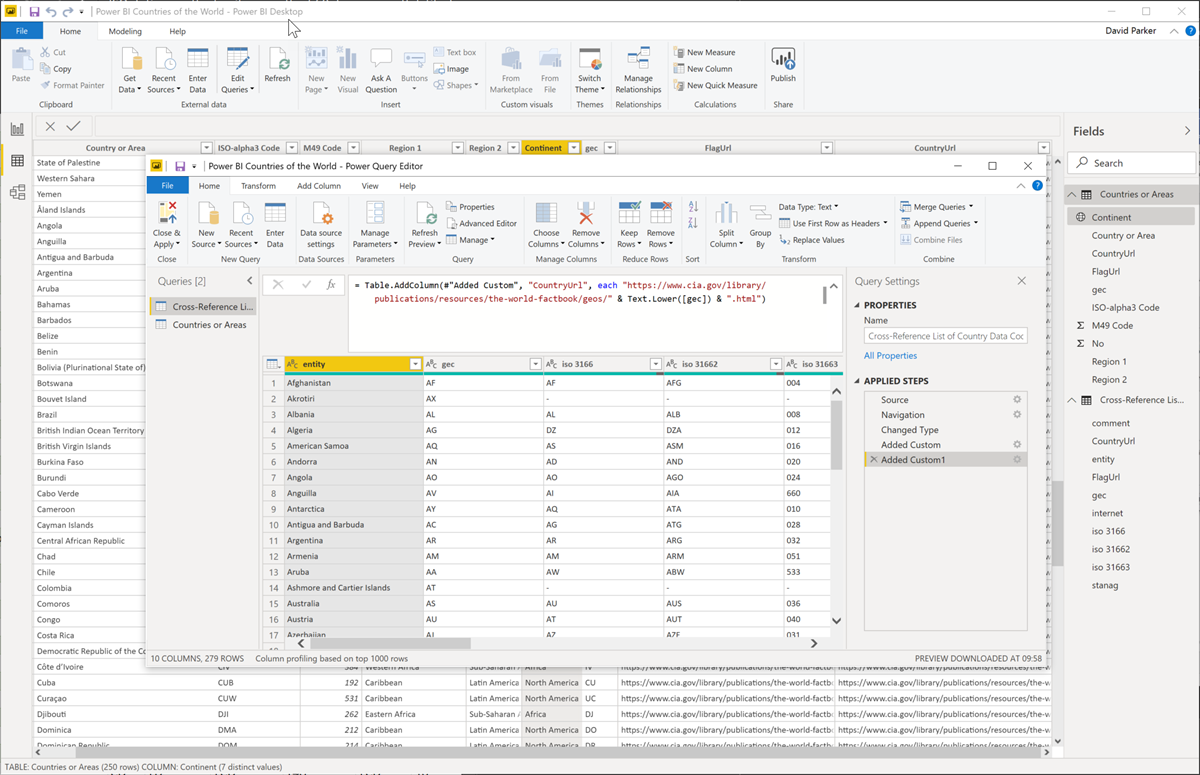
I like Power BI, and the latest update features the ability to set a custom web url onto another column. So, I couldn’t resist trying it in the example below. Notice that the Country or Area values are hyperlinks to the url of the country page in the CIA World Factbook.

[UPDATE Oct 2021: The CIA World Factbook has been updated, and this the flag links are currently broken]

[Read more…] about Countries of the World in Power BI with Flags

Filed Under: Geographic, mFormula, PowerBI Tagged With: Flag, PowerBI

Published on January 10, 2019 by David Parker

Replacing Images in Visio Shapes by Changing Data

I wrote an article last year about Swapping Images in a #Visio Shape manually, but I want to be able to do this whenever a Shape Data value changes. This is because I use I invariably use shapes linked to data. I also want to be able to have multiple images within a single grouped shape, and all of them changing when their referenced Shape Data values change. I believe that this will be more adaptable for a lot of scenarios than trying to repurpose Data Graphic Icon Sets ( see  Make Your Own Visio Data Graphic Icons Sets … automatically). I also discovered that the Shape.ChangePicture(…) function can just as easily work with urls as it can with network file paths, so even more possibilities are opened up! For example, the Visio Online JavaScript API has the ability to overlay an image (see ShapeView.addOverlay(…)).
So, I have created some macros to provide quick and easy selection, positioning and updating of images within a group shape.
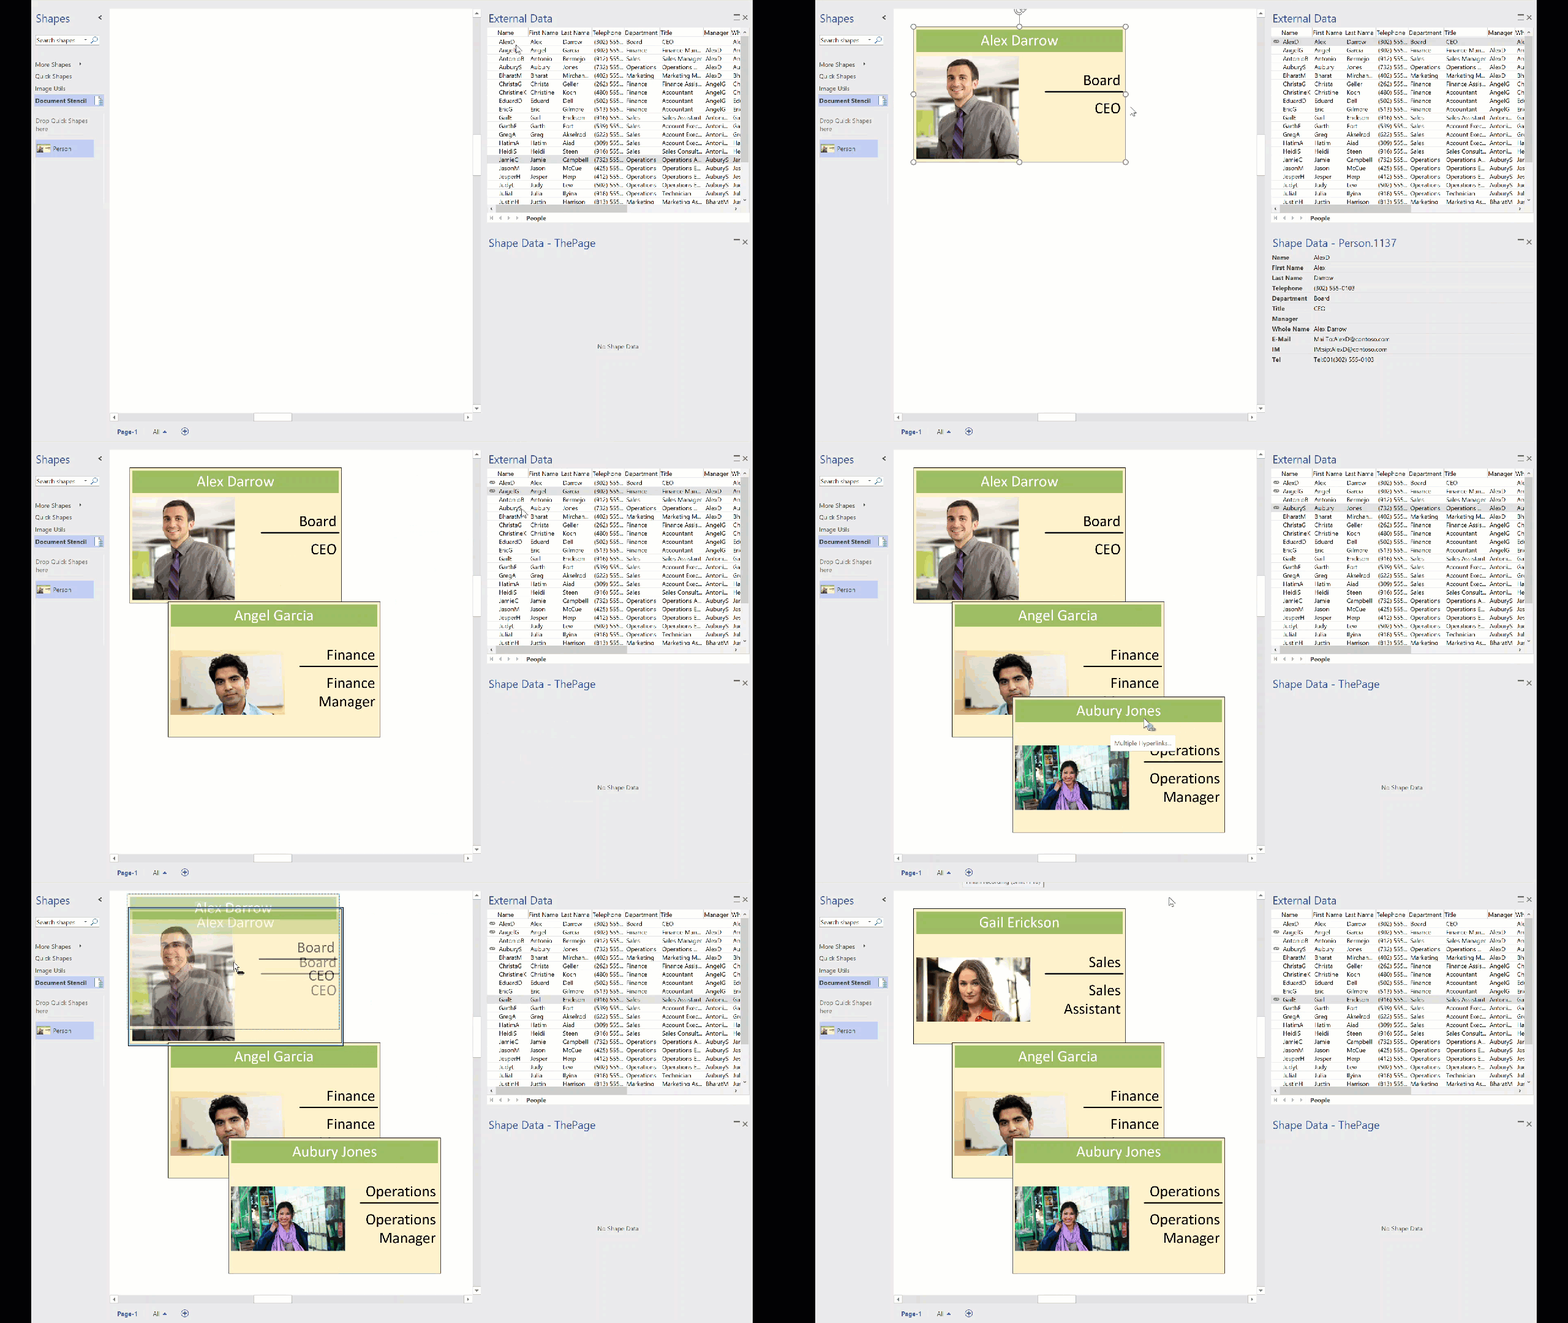
personphotosbydata


I decided to present this article with VBA code rather than my preferred C# so that a stencil could be downloaded to provide instant usability, rather than having to install an add-in. It can be download from Image Utils.vssm, and should then be placed in to My Shapes folder, so that it becomes available to open in Visio. When it is opened, then the macros will need to be enabled.
There are just five public macros:

[Read more…] about Replacing Images in Visio Shapes by Changing Data

Filed Under: Excel, External Data, Geographic, Images, Org Charts, Shape Data, VBA, Visio Tagged With: Link Data to Shapes, Macros, ShapeSheet, VBA

Published on October 30, 2016 by David Parker

US State Flags for Visio

I am working on a project where I thought the US State flags might be useful, so I quickly created a new master shape from the images in Wikipedia. The shape simply provides a selection of one of the states from the Shape Data window (plus one extra for the reverse of Oregon’s flag!).

The flag shape has a couple of Shape Data rows:

[Read more…] about US State Flags for Visio

Filed Under: Geographic, Shape Data, ShapeSheet Formulas, Visio 2016 Tagged With: Flag, US States

Published on May 27, 2015 by David Parker

Distributing Data Points Automatically on Maps in Visio

In my last article, I described how to calibrate a map in Visio ( see http://blog.bvisual.net/2015/05/26/calibrating-a-map-in-visio/ ), and in this article I use a calibrated map to distribute data points from a linked data source automatically.

For this example, I drew a simple shape at the size that I want, but you could add this smartness to any shape. All you need is an external data recordset that contains the Latitude and Longitude values that need to be linked to each data point.

image
[Read more…] about Distributing Data Points Automatically on Maps in Visio

Filed Under: Bing Maps, External Data, Geographic, Shape Data, ShapeSheet Formulas, Visio 2013 Tagged With: Link Data to Shapes, Shape Data, ShapeSheet Functions

Published on September 10, 2014 by David Parker

Union Jacked?

I am in Edinburgh, capital of Scotland, today. All talk is of the vote on Scottish independence next week … so, I thought I would make a Union Jack Visio shape that can be automatically changed, using Shape Data values, to represent the countries left in the union!

The Union Jack is comprised of the flags of England, Scotland and Ireland … sorry Wales, you are only a principality. Yes, I know that Northern Ireland is a province, but it was decided that St Patrick’s Saltire should be kept even after Eire got independence.

Note that a single country flag has an aspect ratio of 5:3, but a multi-country union flag has an aspect ratio of 2:1.

image
[Read more…] about Union Jacked?
Filed Under: Geographic, Shape Data, ShapeSheet Formulas, Visio Tagged With: Shape Data, ShapeSheet Functions

Published on January 27, 2014 by David Parker

Visio Map of the World Update

My earlier post about the world in Visio shapes, see http://blog.bvisual.net/2013/08/16/visio-map-of-the-world/ , has been one of my most popular, and a reader recently asked about changing the colour of countries by data not in my original worksheet, and another asked about adding labelled dots.

Well, at first, I thought it would be quite simple to add more Data Graphics with the Color By Value that I already had, but then I realised that I needed to adjust some of the shapes that I had created from SVG in my previous article.

The problem is that some of the country shapes which were converted from SVG have geometry at the top group level. This means that any Data Graphic items, other than Color By Value, are actually sub-shapes of the group and will be hidden by the country shape itself. That is probably why the Data Graphics task, on the selected Afghanistan shape below, sent the AF label over to the right of it, whereas all the group shapes with all their geometry in sub-shapes, such as the AE (United Arab Emirates) shape, placed the label in its centre.

image
[Read more…] about Visio Map of the World Update

Filed Under: Geographic, Visio Tagged With: Data Graphics, Link Data to Shapes, Visio 2010, Visio 2013

  • Go to page 1
  • Go to page 2
  • Go to page 3
  • Go to Next Page »

Primary Sidebar

  • LinkedIn
  • Twitter

Recent Posts

  • Update to LayerManager add-in for non-English users
  • Pushing Data Visualizer in Visio beyond its limits
  • Pushing Data Visualizer in Visio to the limits!
  • Teams Tuesday Podcast Recording about Visio
  • Linking Data to Visio Shapes in Code

Categories

Tags

Accessibility Add-Ins Connectors Containers Data Export Data Graphics Data Import Data Visualizer Educational Excel GraphDatabase Hyperlinks Icon Sets JavaScript Layers Legend Link Data to Shapes Lists MSIgnite MVP Office365 Org Chart PowerApps PowerBI PowerQuery Processes Shape Data Shape Design ShapeSheet ShapeSheet Functions SharePoint 2013 SQL Teams Themes Validation VBA Video Visio Visio 2007 Visio 2013 Visio for the Web Visio Online Visio Services Visio Viewer Webinar

Footer

bVisual Profile

The UK-based independent Visio consultancy with a worldwide reach. We have over 25 years experience of providing data visualization solutions to companies around the globe.

Learn more about bVisual

  • LinkedIn
  • Twitter

Search this website

Recent posts

  • Update to LayerManager add-in for non-English users
  • Pushing Data Visualizer in Visio beyond its limits
  • Pushing Data Visualizer in Visio to the limits!
  • Teams Tuesday Podcast Recording about Visio
  • Linking Data to Visio Shapes in Code

Copyright © 2023 · Executive Pro on Genesis Framework · WordPress · Log in