• Skip to main content
  • Skip to primary sidebar
  • Skip to footer

bVisual

  • Home
  • Services
    • How Visio smartness can help your business
    • Visio visual in Power BI
    • Visio Consulting Services
    • Visio Bureau Services
    • Visio Training and Support Services
  • Products
    • Visio Shape Report Converter
    • SS Plus
    • LayerManager
    • visViewer
    • Metro Icons
    • Rules Tools for Visio
    • The Visio 2010 Sessions App
    • Multi-Language Text for Visio
    • Document Imager for Visio
    • multiSelect for Visio
    • pdSelect for Visio
  • Case Studies
    • Case studies overview
    • Visualizing Construction Project Schedules
    • Visio Online Business Process Mapping
    • Nexans Visio Template
    • CNEE Projects, WorldCom
    • Chase Manhattan Bank
  • News
    • Recent news
    • News archive
  • Resources
    • Articles➡
      • ShapeSheet Functions A-Z
      • Comparing Visio for the Web and Desktop
      • Customising Visio Shapes for the Web App
      • Key differences between the Visio desktop and web apps
      • Using the Visio Data Visualizer in Excel
      • Using Visio in Teams
      • Creating Visio Tabs and Apps for Teams with SharePoint Framework (SPFx)
      • Designing Power Automate Flows with Microsoft Visio
      • Innovative uses of Visio Lists
    • Webcasts ➡
      • Visio in Organizations
      • My session and other Visio sessions at MSIgnite 2019
      • Power up your Visio diagrams
      • Vision up your Visio diagrams
      • The Visio 2010 MVP Sessions
    • Visio Web Learning Resources
    • Books➡
      • Mastering Data Visualization with Microsoft Visio
      • Microsoft Visio Business Process Diagramming and Validation
      • Visualizing Information with Microsoft Visio
  • Blog
    • Browse blog articles
    • Visio Power BI articles
    • Visio for Web articles
    • A history of messaging and encryption
  • About us
    • About bVisual
    • Testimonials
    • Bio of David Parker
    • Contact Us
    • Website Privacy Policy
    • Website terms and conditions
    • Ariba Network

mFormula

Published on December 31, 2019 by David Parker

Countries of the World in Power BI with Flags

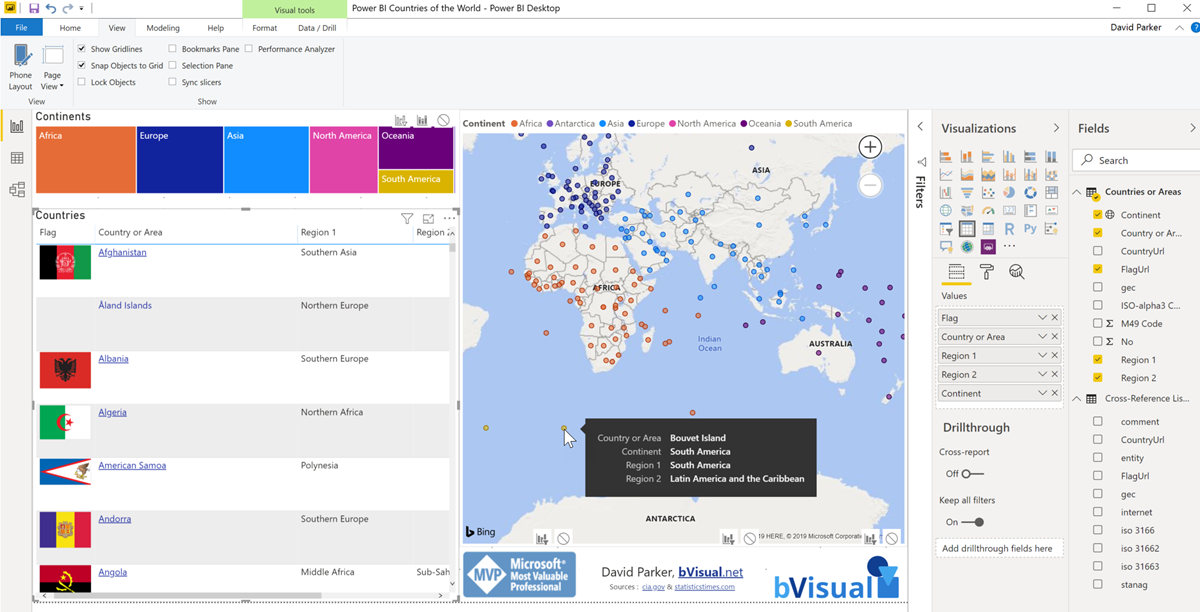
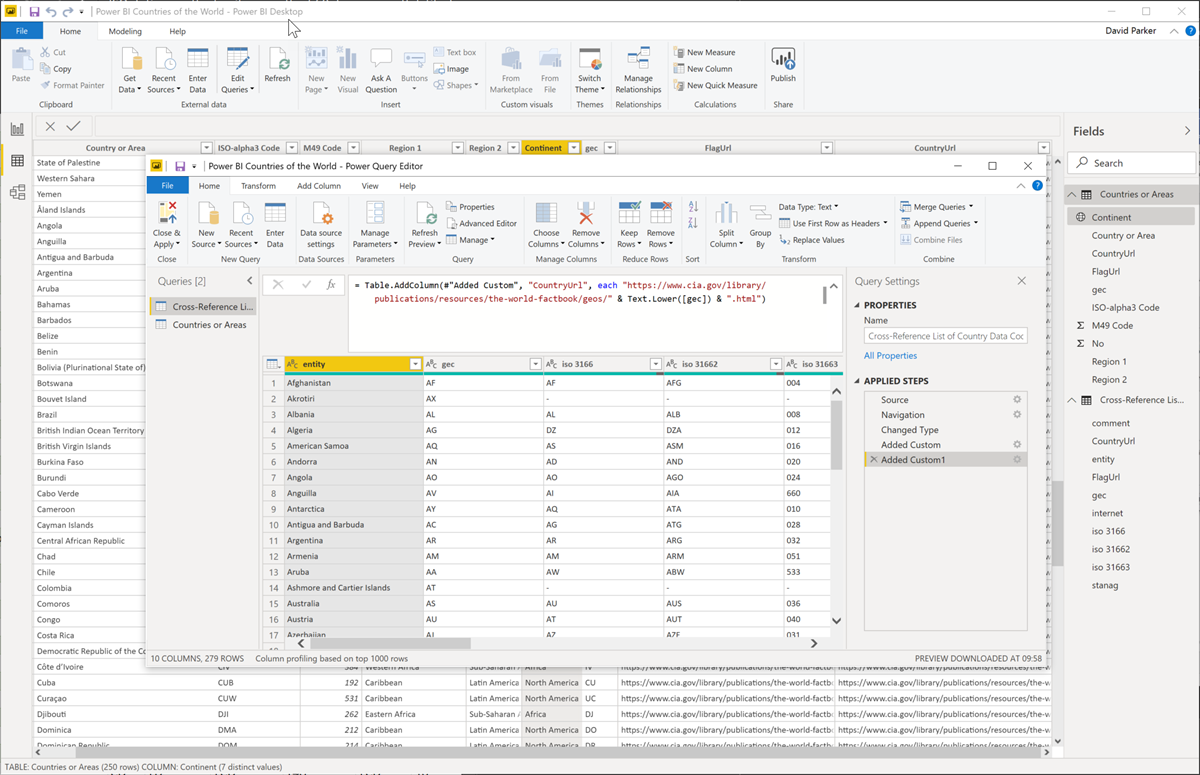
I like Power BI, and the latest update features the ability to set a custom web url onto another column. So, I couldn’t resist trying it in the example below. Notice that the Country or Area values are hyperlinks to the url of the country page in the CIA World Factbook.

[UPDATE Oct 2021: The CIA World Factbook has been updated, and this the flag links are currently broken]

[Read more…] about Countries of the World in Power BI with Flags

Filed Under: Geographic, mFormula, PowerBI Tagged With: Flag, PowerBI

Published on March 7, 2019 by David Parker

Changing Visio Shape Size and Angle with Linked Data

I was recently laying out a computer room floor plan to scale in Visio, from survey data of the cabinets\racks within it, and it occurred to me that I could work a bit smarter than I first thought. Originally, I was going to just add lots of rectangles, size them, rotate them, and label each them with their name. Then I thought, why not use the Width, Depth and Name columns from the survey data to do most of the work for me? It was so simple to do, and only took a few minutes, so I thought I would share my methodology because it demonstrates how easy it is to work smarter with Visio….

These are the simple steps shown above, written out for your education….

[Read more…] about Changing Visio Shape Size and Angle with Linked Data

Filed Under: Excel, External Data, mFormula, ShapeSheet Formulas, Visio Tagged With: Shape Data, Shape Design, ShapeSheet, ShapeSheet Functions

Published on April 30, 2018 by David Parker

Icons Sets and Data Bars in PowerBI Visio visual

I really enjoy linking data to Visio diagrams, either directly or using the Visio custom visual in Power BI. This visual has the ability to display PowerQuery data as text or color, but not as icons or data bars. These last two features are something that can be used natively in Visio, and automatically updated in Visio Online. I have previously urged Microsoft to add these abilities to the Visio custom visual in Power BI, but there is no sign of it appearing just yet. The custom visual actually removes any Data Graphics ( Text Callouts, Icon Sets, Data Bars or Color by Value) that may already exist in a Visio diagram when it is embedded into Power BI. This reduces the number of shapes in the visual (there is currently a low limit) and, in any case, the data should be displayed from Power BI.
I want to be able to display some data as icons and data bars within the Visio diagram, so what is the alternative? Fortunately, there is a way using text symbol characters and the wonderful Power Query formulas!

[Read more…] about Icons Sets and Data Bars in PowerBI Visio visual

Filed Under: Excel, mFormula, PowerBI, Visio, Visio 2016

Primary Sidebar

  • LinkedIn
  • Twitter

Recent Posts

  • Update to LayerManager add-in for non-English users
  • Pushing Data Visualizer in Visio beyond its limits
  • Pushing Data Visualizer in Visio to the limits!
  • Teams Tuesday Podcast Recording about Visio
  • Linking Data to Visio Shapes in Code

Categories

Tags

Accessibility Add-Ins Connectors Containers Data Export Data Graphics Data Import Data Visualizer Educational Excel GraphDatabase Hyperlinks Icon Sets JavaScript Layers Legend Link Data to Shapes Lists MSIgnite MVP Office365 Org Chart PowerApps PowerBI PowerQuery Processes Shape Data Shape Design ShapeSheet ShapeSheet Functions SharePoint 2013 SQL Teams Themes Validation VBA Video Visio Visio 2007 Visio 2013 Visio for the Web Visio Online Visio Services Visio Viewer Webinar

Footer

bVisual Profile

The UK-based independent Visio consultancy with a worldwide reach. We have over 25 years experience of providing data visualization solutions to companies around the globe.

Learn more about bVisual

  • LinkedIn
  • Twitter

Search this website

Recent posts

  • Update to LayerManager add-in for non-English users
  • Pushing Data Visualizer in Visio beyond its limits
  • Pushing Data Visualizer in Visio to the limits!
  • Teams Tuesday Podcast Recording about Visio
  • Linking Data to Visio Shapes in Code

Copyright © 2023 · Executive Pro on Genesis Framework · WordPress · Log in