• Skip to main content
  • Skip to primary sidebar
  • Skip to footer

bVisual

  • Home
  • Services
    • How Visio smartness can help your business
    • Visio visual in Power BI
    • Visio Consulting Services
    • Visio Bureau Services
    • Visio Training and Support Services
  • Products
    • Visio Shape Report Converter
    • SS Plus
    • LayerManager
    • visViewer
    • Metro Icons
    • Rules Tools for Visio
    • The Visio 2010 Sessions App
    • Multi-Language Text for Visio
    • Document Imager for Visio
    • multiSelect for Visio
    • pdSelect for Visio
  • Case Studies
    • Case studies overview
    • Using Visio in Education for GIS
    • Visualizing Construction Project Schedules
    • Visio Online Business Process Mapping
    • Nexans Visio Template
    • CNEE Projects, WorldCom
    • Chase Manhattan Bank
  • News
    • Recent news
    • News archive
  • Resources
    • Articles➡
      • ShapeSheet Functions A-Z
      • Comparing Visio for the Web and Desktop
      • Customising Visio Shapes for the Web App
      • Key differences between the Visio desktop and web apps
      • Using the Visio Data Visualizer in Excel
      • Using Visio in Teams
      • Creating Visio Tabs and Apps for Teams with SharePoint Framework (SPFx)
      • Designing Power Automate Flows with Microsoft Visio
      • Innovative uses of Visio Lists
    • Webcasts ➡
      • Visio in Organizations
      • My session and other Visio sessions at MSIgnite 2019
      • Power up your Visio diagrams
      • Vision up your Visio diagrams
      • The Visio 2010 MVP Sessions
    • Visio Web Learning Resources
    • Books➡
      • Visualize Complex Processes with Microsoft Visio
      • Mastering Data Visualization with Microsoft Visio
      • Microsoft Visio Business Process Diagramming and Validation
      • Visualizing Information with Microsoft Visio
  • Blog
    • Browse blog articles
    • Visio Power BI articles
    • Visio for Web articles
    • A history of messaging and encryption
  • About us
    • About bVisual
    • Testimonials
    • Bio of David Parker
    • Contact Us
    • Website Privacy Policy
    • Website terms and conditions
    • Ariba Network
You are here: Home / Visio / Visio 2013 / Distributing Data Points Automatically on Maps in Visio

Published on May 27, 2015 by David Parker

Distributing Data Points Automatically on Maps in Visio

In my last article, I described how to calibrate a map in Visio ( see http://blog.bvisual.net/2015/05/26/calibrating-a-map-in-visio/ ), and in this article I use a calibrated map to distribute data points from a linked data source automatically.

For this example, I drew a simple shape at the size that I want, but you could add this smartness to any shape. All you need is an external data recordset that contains the Latitude and Longitude values that need to be linked to each data point.

image

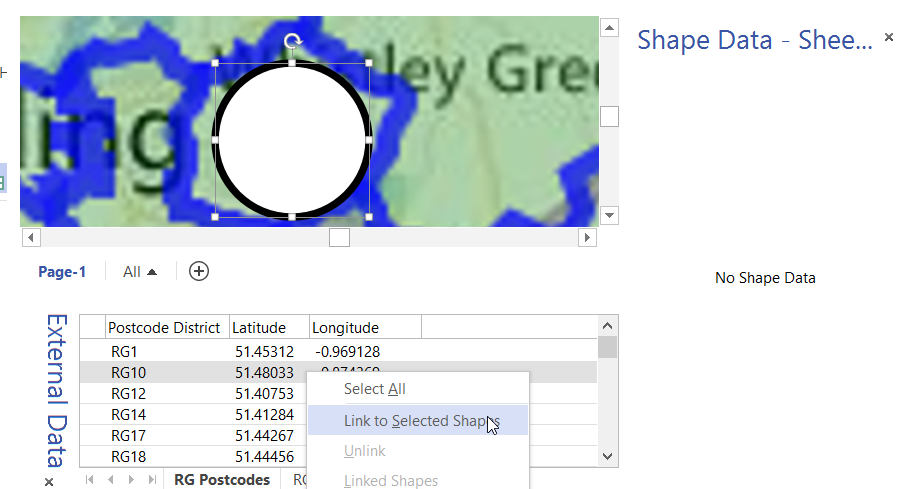
I linked one sample row from the External Data window to the shape because this will automatically create some Shape Data rows.

image

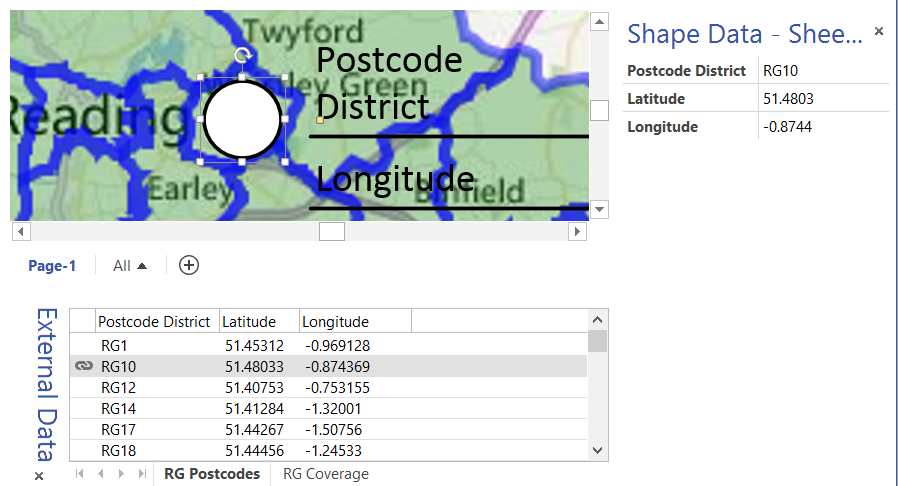
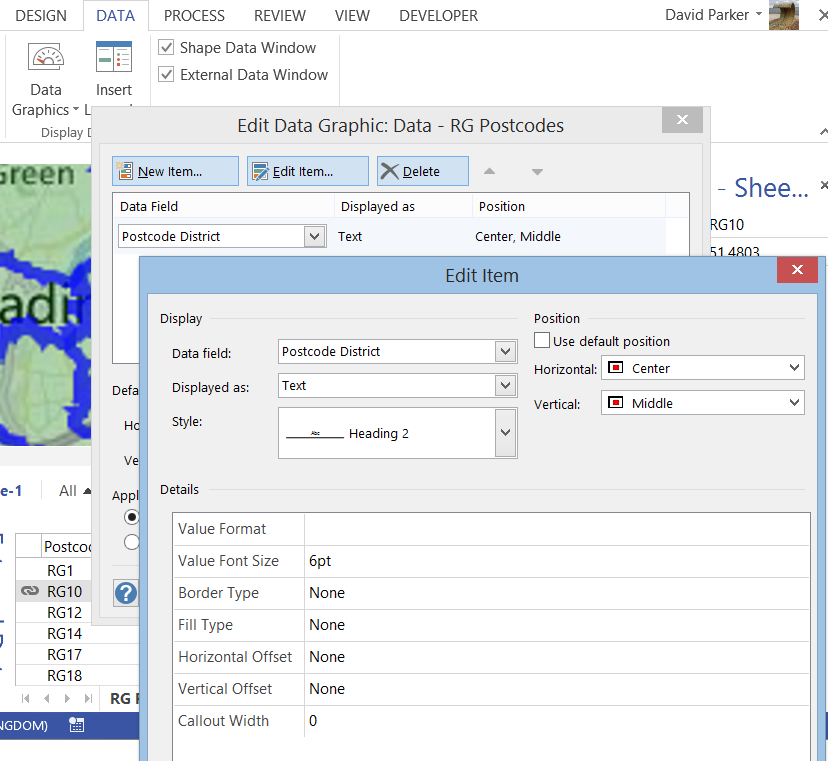
It will usually automatically add some default data graphic text which can be edited to display whatever you want. I just want to see the Postcode District in this example.

image

So, my beautiful complex shape is almost ready….

image

All I need to do is add one User-defined cell, that I have called LLTrigger, so that the PinX and PinY of the shape can be set according to the Latitude and Longitude values.

image

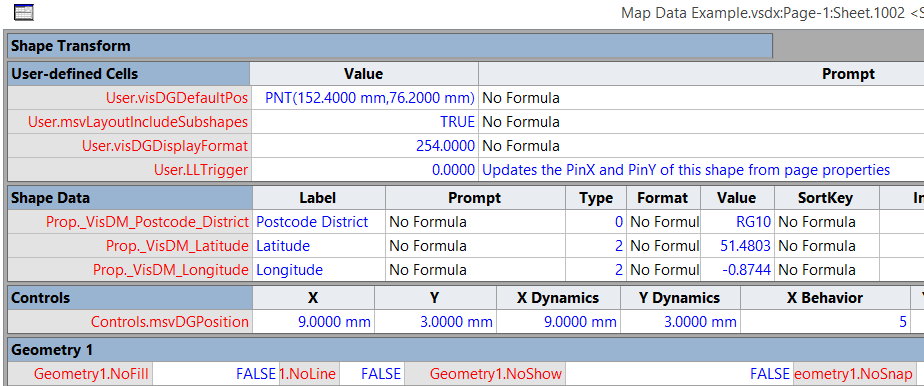
The Value cell contains the following formula provided that the LL Marker shapes from the previous article are present on the page:

Cell NameFormula
User.LLTrigger=IF(AND(NOT(Prop._VisDM_Latitude=0),
NOT(Prop._VisDM_Longitude)=0),
SETF(GetRef(PinX),ThePage!User.LLPosition1X-
((ThePage!User.LLPosition1Lon-Prop._VisDM_Longitude)/
(ThePage!User.LLPosition1Lon-ThePage!User.LLPosition2Lon))*
(ThePage!User.LLPosition1X-ThePage!User.LLPosition2X))+
SETF(GetRef(PinY),ThePage!User.LLPosition1Y-
((ThePage!User.LLPosition1Lat-Prop._VisDM_Latitude)/
(ThePage!User.LLPosition1Lat-ThePage!User.LLPosition2Lat))*
(ThePage!User.LLPosition1Y-ThePage!User.LLPosition2Y)),0)

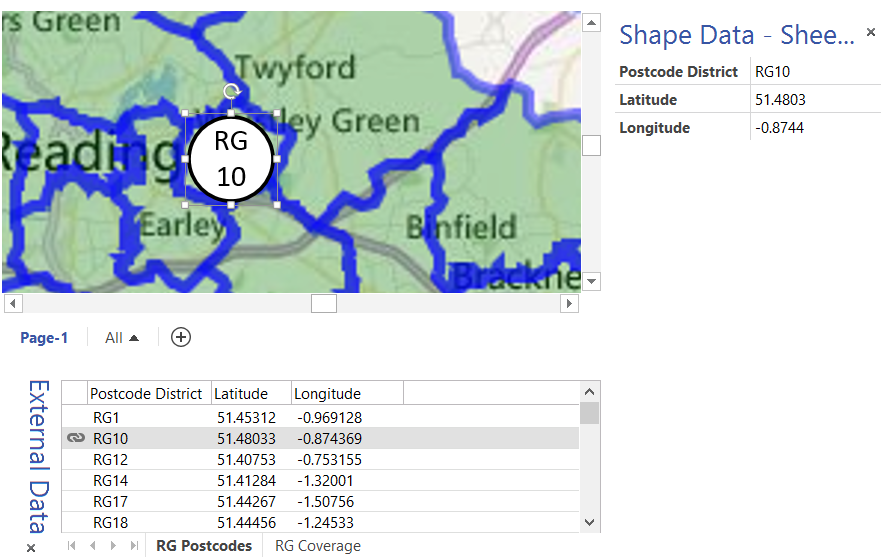
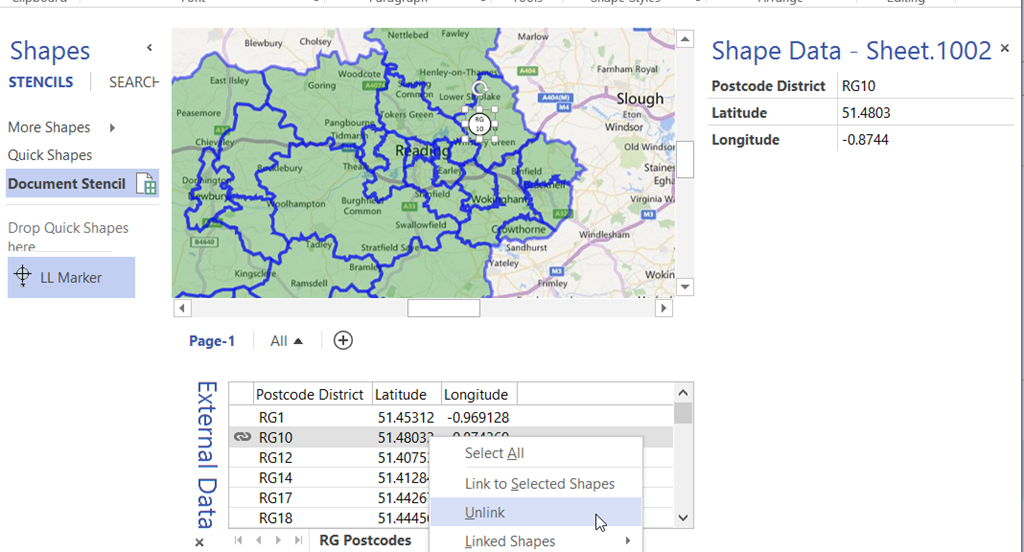
As soon as the trigger formula is entered, the shape will automatically re-position itself at the correct location.

image

Also, if I want to have a hyperlink on each shape that opens Bing Maps at the precise co-ordinate, then I can add a new Hyperlink row as follows (see previous article):

image
Hyperlink.BingMaps.Address=”http://www.bing.com/maps/”
Hyperlink.BingMap.ExtraInfo=”lvl=11&sp=Point.”&Prop._VisDM_Latitude&”_”&Prop._VisDM_Longitude&”_”&NAME()

Then I unlinked the shape from the row in the External Data window, and dragged the shape onto the Document Stencil, and renamed the master as Data Point.

image

Then, with the Data Point master selected in the Document Stencil, I can select as many rows as I wan to in the External Data window, and drag and drop them onto the map. All of the rows will be added as new shapes in the correct location on the map!

image

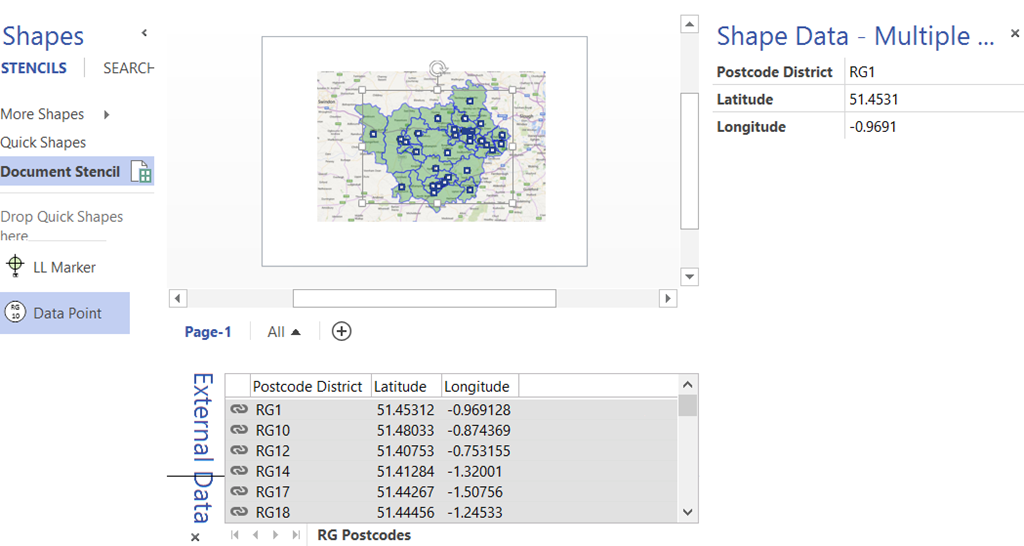
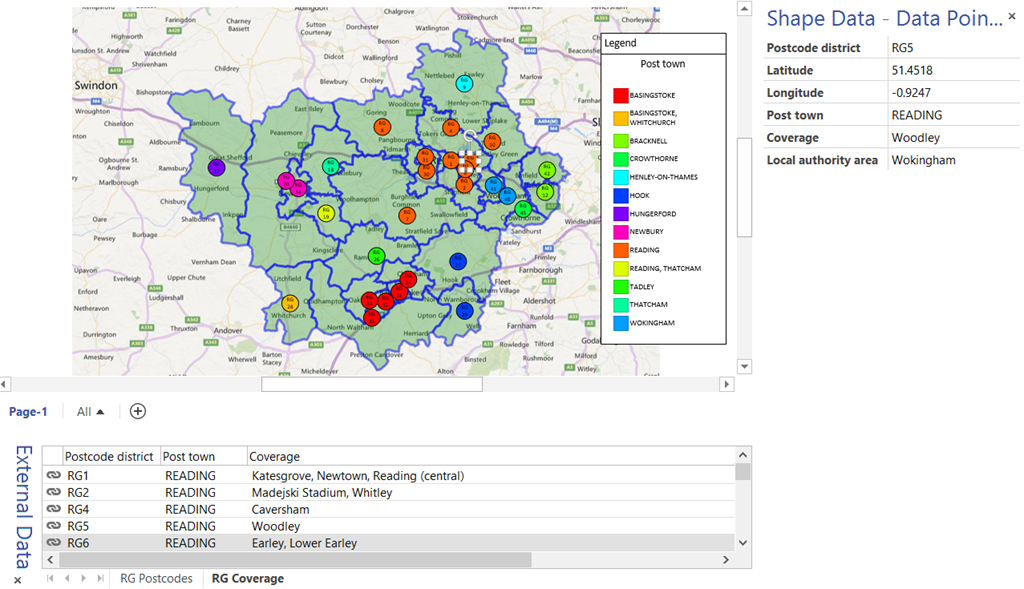
Every Data Point shape is placed according to its Latitude and Longitude values:

image

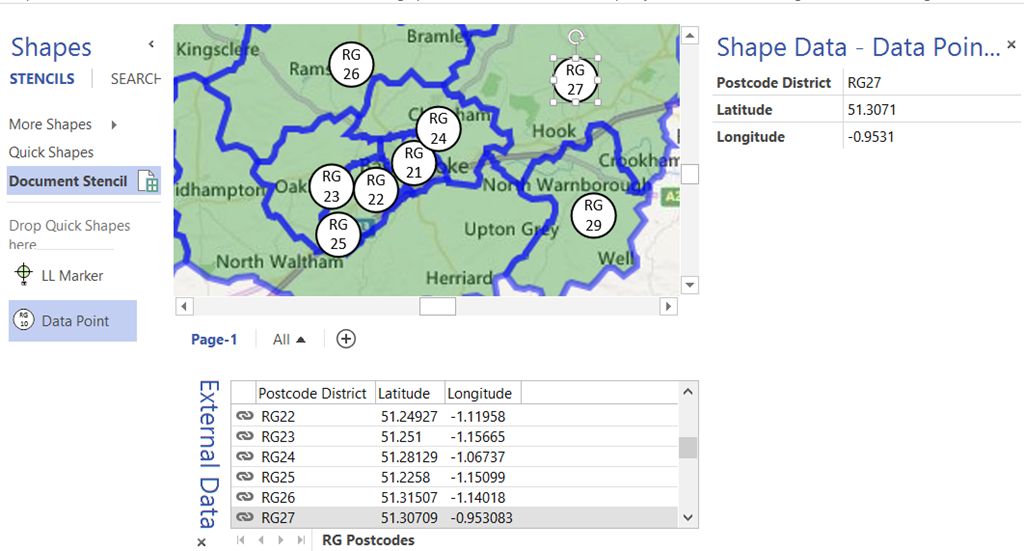
I called the master Data Point because it could have as many other Shape Data rows on them, and could be displaying  Data Graphic Icon Sets, Data Bars, Text Callouts and Color By Value … but that is for another day!

Visio 2013 sample : http://1drv.ms/1SBGWDw

Visio 2003-10 sample : http://1drv.ms/1Fa9U35

So, I can link a row from multiple External Data recordsets to these shapes, and edit the Data Graphics to display Post town using Color by Value, for example:

image

Visio 2013 example : http://1drv.ms/1Fiquis

Visio 2003-10 sample : http://1drv.ms/1Fiquis

Related

Filed Under: Bing Maps, External Data, Geographic, Shape Data, ShapeSheet Formulas, Visio 2013 Tagged With: Link Data to Shapes, Shape Data, ShapeSheet Functions

About David Parker

David Parker has 25 years' experience of providing data visualization solutions to companies around the globe. He is a Microsoft MVP and Visio expert.

Reader Interactions

Comments

  1. Ridha says

    September 11, 2017 at 7:02 pm

    great work,
    plz a question, how did you make the picture fixed and look like a background, I tried in protection section but it didn’t looks like you did.

    thx

    Reply
    • davidjpp says

      September 11, 2017 at 9:36 pm

      My normal method is to assign to a layer then Lock the layer.

      Reply

Trackbacks

  1. Filter Visio External Data to Drop Shapes | bVisual - for people interested in Microsoft Visio says:
    May 28, 2015 at 9:57 pm

    […] I have recently been demonstrating how to automatically drop data point shapes into the correct latitude longitude position over a map image in Visio, and in this instalment I show how to automatically filter the dropped data points by a rectangular area. This will only work after calibrating the map image as in my previous article http://blog.bvisual.net/2015/05/26/calibrating-a-map-in-visio/ and then using the Data Point shape (or similar) from http://blog.bvisual.net/2015/05/27/distributing-data-points-automatically-on-maps-in-visio/ […]

    Reply

Leave a Reply Cancel reply

Your email address will not be published. Required fields are marked *

Primary Sidebar

  • LinkedIn
  • Twitter

Recent Posts

  • Fixing dimensions of 2D shapes
  • Merging Linked Data from Similar Tables
  • Smart Radio Buttons and Check Boxes in Visio
  • Using Button Face Ids in Visio
  • Grid Snapping Revisited

Categories

Tags

Accessibility Add-Ins Connectors Containers Data Export Data Graphics Data Import Data Visualizer Educational Excel GraphDatabase Hyperlinks Icon Sets JavaScript LayerManager Layers Legend Link Data to Shapes Lists MSIgnite MVP Office365 Org Chart PowerApps PowerBI PowerQuery Processes Setup and Deployment Shape Data Shape Design ShapeSheet ShapeSheet Functions SharePoint 2013 SQL Teams Validation VBA Video Visio Visio 2007 Visio for the Web Visio Online Visio Services Visio Viewer Webinar

Footer

bVisual Profile

The UK-based independent Visio consultancy with a worldwide reach. We have over 25 years experience of providing data visualization solutions to companies around the globe.

Learn more about bVisual

  • Amazon
  • E-mail
  • Facebook
  • LinkedIn
  • Twitter
  • YouTube

Search this website

Recent posts

  • Fixing dimensions of 2D shapes
  • Merging Linked Data from Similar Tables
  • Smart Radio Buttons and Check Boxes in Visio
  • Using Button Face Ids in Visio
  • Grid Snapping Revisited

Copyright © 2025 · Executive Pro on Genesis Framework · WordPress · Log in