[Update : a new version of this file allows Visio for M365 users to edit/play with see Making Custom Shapes for Visio for M365]
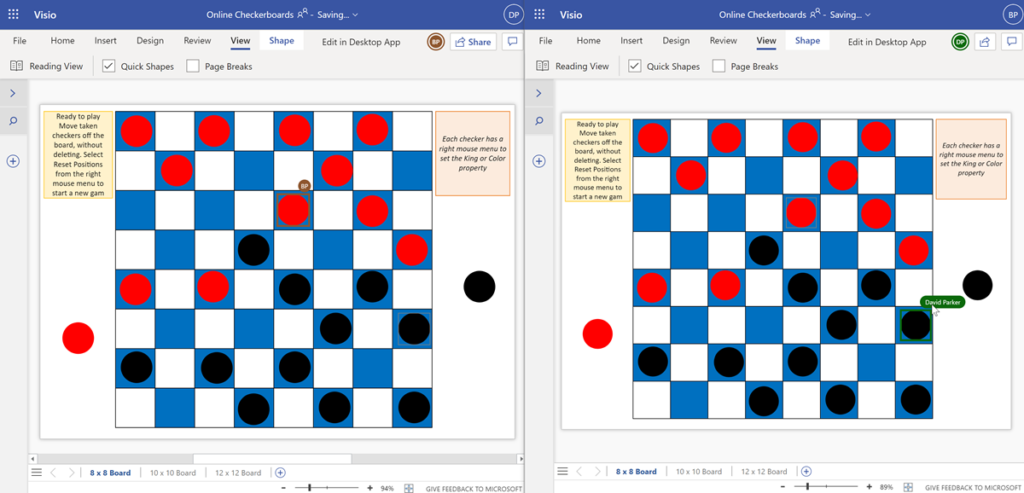
We are all spending more time in Teams or SharePoint nowadays, but not everyone knows that Visio documents can now be shared and collaborated with, and even set as a Teams tab. I was trying to think of a suitable demonstration of the co-working and collaboration possibilities, and came up with a reworking of an earlier post about playing checkers with Visio. Since this previous document was made before Visio for the web, I made some enhancements that work just as well with Visio for desktop and Visio for the web. This article explains a few ShapeSheet customisations that can be developed in Visio for the desktop, but can then be used in Visio for the web. Notice how each player can see which piece was moved by their opponent because their initials are displayed, and this is expanded to the full name if the mouse cursor is hovered over them.