• Skip to main content
  • Skip to primary sidebar
  • Skip to footer

bVisual

  • Home
  • Services
    • How Visio smartness can help your business
    • Visio visual in Power BI
    • Visio Consulting Services
    • Visio Bureau Services
    • Visio Training and Support Services
  • Products
    • Visio Shape Report Converter
    • SS Plus
    • LayerManager
    • visViewer
    • Metro Icons
    • Rules Tools for Visio
    • The Visio 2010 Sessions App
    • Multi-Language Text for Visio
    • Document Imager for Visio
    • multiSelect for Visio
    • pdSelect for Visio
  • Case Studies
    • Case studies overview
    • Using Visio in Education for GIS
    • Visualizing Construction Project Schedules
    • Visio Online Business Process Mapping
    • Nexans Visio Template
    • CNEE Projects, WorldCom
    • Chase Manhattan Bank
  • News
    • Recent news
    • News archive
  • Resources
    • Articles➡
      • ShapeSheet Functions A-Z
      • Comparing Visio for the Web and Desktop
      • Customising Visio Shapes for the Web App
      • Key differences between the Visio desktop and web apps
      • Using the Visio Data Visualizer in Excel
      • Using Visio in Teams
      • Creating Visio Tabs and Apps for Teams with SharePoint Framework (SPFx)
      • Designing Power Automate Flows with Microsoft Visio
      • Innovative uses of Visio Lists
    • Webcasts ➡
      • Visio in Organizations
      • My session and other Visio sessions at MSIgnite 2019
      • Power up your Visio diagrams
      • Vision up your Visio diagrams
      • The Visio 2010 MVP Sessions
    • Visio Web Learning Resources
    • Books➡
      • Visualize Complex Processes with Microsoft Visio
      • Mastering Data Visualization with Microsoft Visio
      • Microsoft Visio Business Process Diagramming and Validation
      • Visualizing Information with Microsoft Visio
  • Blog
    • Browse blog articles
    • Visio Power BI articles
    • Visio for Web articles
    • A history of messaging and encryption
  • About us
    • About bVisual
    • Testimonials
    • Bio of David Parker
    • Contact Us
    • Website Privacy Policy
    • Website terms and conditions
    • Ariba Network

Shape Data

Published on May 21, 2021 by David Parker

Testing Regional Settings in Visio

There are times that I have been caught out by assuming that everyone speaks “proper” English, like what I do (sic), and forgetting that there are other languages with their own formatting conventions. I think most of the world is bemused at the USA date format where they put the month before the day and the year. So illogical to everyone else, and I can’t help thinking that it was done on purpose just to catch us Brits out, like when they decided to drive on the wrong side of the road just to make it more difficult to sell cars across the border. It seems that some parts of Visio get confused if I enter the dates in the correct “dd/mm/yyyy” format, so I now type dates in the “d mmm yyyy” format in the Shape Data window calendar control because, at least, that always works. Also Visio‘s internal units are inches, and every time I see it referred to as US Units, rather than the Imperial Units that I grew up with, makes me think “so, this is what it has come to!”.

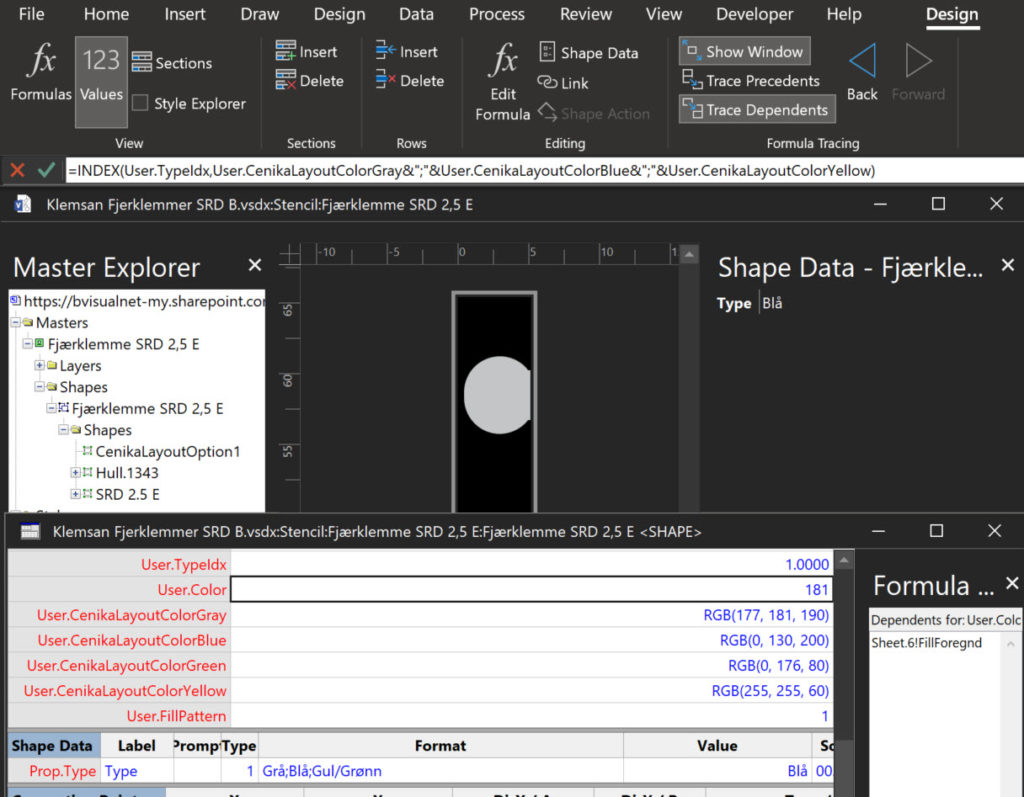
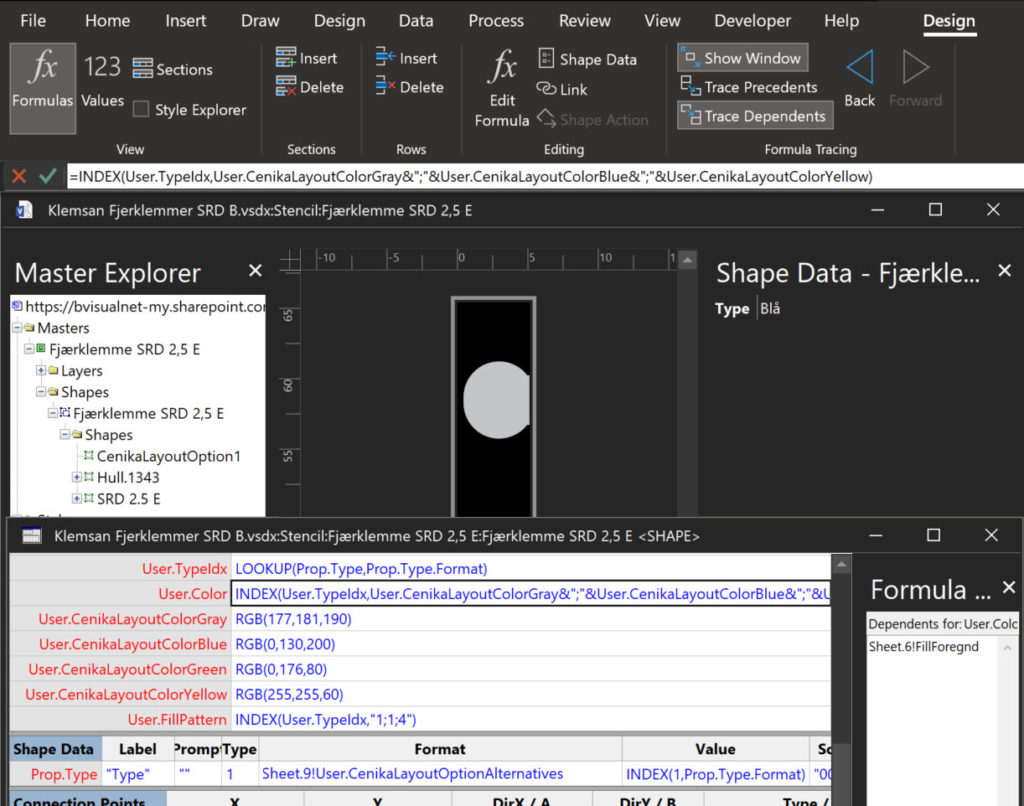
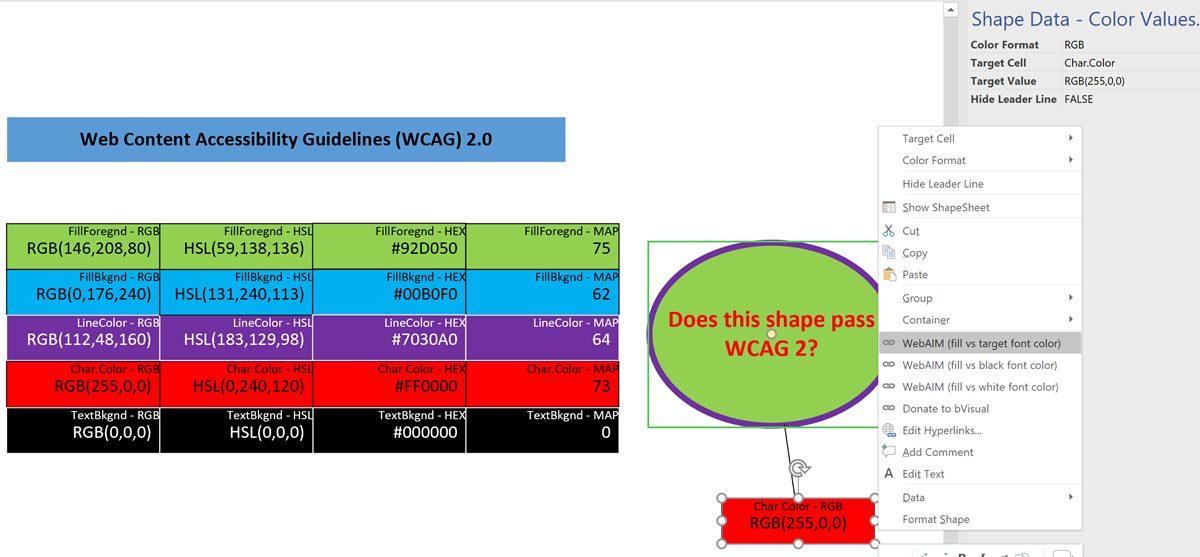
So today I was embarrassed by a Norwegian client because I forgot (again) to take extra care when using the RGB(…) function. The result was that the displayed colours were appearing black in Norwegian (and doubtless many other languages), but correctly grey (gray if you are in the USA), blue, green and yellow in English (both UK and US).

[Read more…] about Testing Regional Settings in Visio

Filed Under: Color, Shape Data, ShapeSheet Formulas, Visio Tagged With: ShapeSheet Functions, Visio

Published on April 15, 2021 by David Parker

Visio 2010 MVP Session videos reprise

Back in 2012, my fellow Visio MVPs, Scott Helmers and Chris Roth, and I recorded a series of 24 videos about Visio 2010. They were first hosted on Microsoft’s web site, then they put them up on YouTube, they they got deleted :-(. Well, we have managed to retrieve them, and put them back up on YouTube in a new list :-). Most of them are still very relevant and useful!

See Visio 2010 MVP Sessions – YouTube and The Visio 2010 MVP Sessions .

Filed Under: Callouts, Containers, Data Graphics, Database, External Data, Floor Plans, Hyperlinks, Layers, Lists, MVP, Network Diagrams, Org Charts, Process Flows, Scale, Shape Data, Shape Reports, Validation, Visio, Visio 2010, Visio for Desktop Tagged With: MVP Sessions, Visio

Published on May 18, 2020 by David Parker

Using Emojis in Visio

In the new normal of social distancing, we can easily miss the nuances of facial expressions with the the various electronic communication platforms that we utilise. In our personal communications via mobile apps, we have all started to use Emojis to express sentiment and actions, although we can sometimes convey the wrong meanings unintentionally as some Emojis get re-purposed by certain sections of society. Microsoft Windows 10 added native support for Emojis a year ago, and they can be inserted into many Microsoft applications using the onscreen keyboard 👀:

Windows 10 Onscreen Keyboard
[Read more…] about Using Emojis in Visio

Filed Under: Lists, Shape Data, ShapeSheet Formulas, Visio, Visio for Desktop, Visio for Web, Visio Online Tagged With: Emojis, Shape Data, ShapeSheet, Structured Diagrams, Visio, Visio Online

Published on March 31, 2020 by David Parker

Using CODE() and UNICODE() functions in Visio

Microsoft Visio does have CHAR() and UNICHAR() ShapeSheet functions, just like Excel, but it does not have the inverse CODE() and UNICODE() functions, unlike Excel. However, there is a way to create a formula in the Visio ShapeSheet to provide these functions.

The following worksheet demonstrates how the CHAR(), CODE(), UNICHAR(), and UNICODE() functions work in Excel.

ColumnFormula
Indexn
Char=IFERROR( CHAR(INT([@Index])),””)
Code=IFERROR( CODE([@Char]),””)
Unichar=UNICHAR(INT([@Index]))
Unicode=UNICODE([@Unichar])
[Read more…] about Using CODE() and UNICODE() functions in Visio

Filed Under: Excel, Lists, Shape Data, ShapeSheet Formulas, Visio Tagged With: Excel, ShapeSheet Functions, Visio

Published on December 6, 2019 by David Parker

Displaying Visio Number Shapes data clearly

Visio has had a Number Shapes add-on for many years, even since before Microsoft bought the application in 2000. The add-on autmatically creates three Shape Data rows to hold the number, any prefix text, and a value to indicate whether the shape number text should be shown. It is useful, but it can also be very annoying if you also want to label your shapes, such as with process flow shapes, or you want the shape number to be displayed outside of the main shape. Fortunately, there is a solution….

  • No Numbers
  • Visio Extras / Number Shapes
  • Number Shapes / General
  • Number Shapes / Advanced
[Read more…] about Displaying Visio Number Shapes data clearly

Filed Under: Data Graphics, Shape Data, ShapeSheet Formulas Tagged With: Data Graphics

Published on September 4, 2019 by David Parker

Testing Visio shape text for WCAG 2.0 pass

The Web Content Access Guidelines (WCAG) 2.0 provides the current recommendations for making web content accessible to users with vision impairment, but how do you test if your Visio shapes pass? There are several web sites out there that provide this capability, but all of them require the HEX values, rather than the RGB or HSL that Visio provides natively. Therefore, I have created a Visio callout shape that can be associated with a target shape to report on the values of each of its main color elements and provides hyperlinks to automatically check the contrast ratio on WebAIM.

Color Values Shape


The colour formats that can be selected from either the Shape Data window or the right mouse menu are:

[Read more…] about Testing Visio shape text for WCAG 2.0 pass

Filed Under: Accessibility, Color, Shape Data, Visio, Visio Online Tagged With: Accessibility, Hyperlinks, Shape Data, WCAG

  • « Go to Previous Page
  • Page 1
  • Interim pages omitted …
  • Page 3
  • Page 4
  • Page 5
  • Page 6
  • Page 7
  • Interim pages omitted …
  • Page 11
  • Go to Next Page »

Primary Sidebar

  • LinkedIn
  • Twitter

Recent Posts

  • Creating Boolean Context Menus in Visio
  • Installing Visio Templates and Stencils
  • Creating a Dynamic connector master automatically
  • A visual exploration of Penrose Tiling in Visio
  • How SVG in Visio can cause a Shape.BoundingBox(…) error

Categories

Tags

Accessibility Add-Ins AdvancedInstaller Connectors Containers Data Export Data Graphics Data Import Data Visualizer Educational Excel GraphDatabase Hyperlinks Icon Sets JavaScript LayerManager Layers Legend Link Data to Shapes MSIgnite Office365 Org Chart PowerApps PowerBI PowerQuery Processes Setup and Deployment Shape Data Shape Design ShapeSheet ShapeSheet Functions SharePoint 2013 SQL Teams Validation VBA Video Visio Visio 2007 Visio for the desktop Visio for the Web Visio Online Visio Services Visio Viewer Webinar

Footer

bVisual Profile

The UK-based independent Visio consultancy with a worldwide reach. We have over 25 years experience of providing data visualization solutions to companies around the globe.

Learn more about bVisual

  • Amazon
  • E-mail
  • Facebook
  • LinkedIn
  • Twitter
  • YouTube

Search this website

Recent posts

  • Creating Boolean Context Menus in Visio
  • Installing Visio Templates and Stencils
  • Creating a Dynamic connector master automatically
  • A visual exploration of Penrose Tiling in Visio
  • How SVG in Visio can cause a Shape.BoundingBox(…) error

Copyright © 2026 · Executive Pro on Genesis Framework · WordPress · Log in