• Skip to main content
  • Skip to primary sidebar
  • Skip to footer

bVisual

  • Home
  • Services
    • How Visio smartness can help your business
    • Visio visual in Power BI
    • Visio Consulting Services
    • Visio Bureau Services
    • Visio Training and Support Services
  • Products
    • Visio Shape Report Converter
    • SS Plus
    • LayerManager
    • visViewer
    • Metro Icons
    • Rules Tools for Visio
    • The Visio 2010 Sessions App
    • Multi-Language Text for Visio
    • Document Imager for Visio
    • multiSelect for Visio
    • pdSelect for Visio
  • Case Studies
    • Case studies overview
    • Visualizing Construction Project Schedules
    • Visio Online Business Process Mapping
    • Nexans Visio Template
    • CNEE Projects, WorldCom
    • Chase Manhattan Bank
  • News
    • Recent news
    • News archive
  • Resources
    • Articles➡
      • ShapeSheet Functions A-Z
      • Comparing Visio for the Web and Desktop
      • Customising Visio Shapes for the Web App
      • Key differences between the Visio desktop and web apps
      • Using the Visio Data Visualizer in Excel
      • Using Visio in Teams
      • Creating Visio Tabs and Apps for Teams with SharePoint Framework (SPFx)
      • Designing Power Automate Flows with Microsoft Visio
      • Innovative uses of Visio Lists
    • Webcasts ➡
      • Visio in Organizations
      • My session and other Visio sessions at MSIgnite 2019
      • Power up your Visio diagrams
      • Vision up your Visio diagrams
      • The Visio 2010 MVP Sessions
    • Visio Web Learning Resources
    • Books➡
      • Mastering Data Visualization with Microsoft Visio
      • Microsoft Visio Business Process Diagramming and Validation
      • Visualizing Information with Microsoft Visio
  • Blog
    • Browse blog articles
    • Visio Power BI articles
    • Visio for Web articles
    • A history of messaging and encryption
  • About us
    • About bVisual
    • Testimonials
    • Bio of David Parker
    • Contact Us
    • Website Privacy Policy
    • Website terms and conditions
    • Ariba Network
You are here: Home / Shape Design / Data Graphics / Displaying Visio Number Shapes data clearly

Published on December 6, 2019 by David Parker

Displaying Visio Number Shapes data clearly

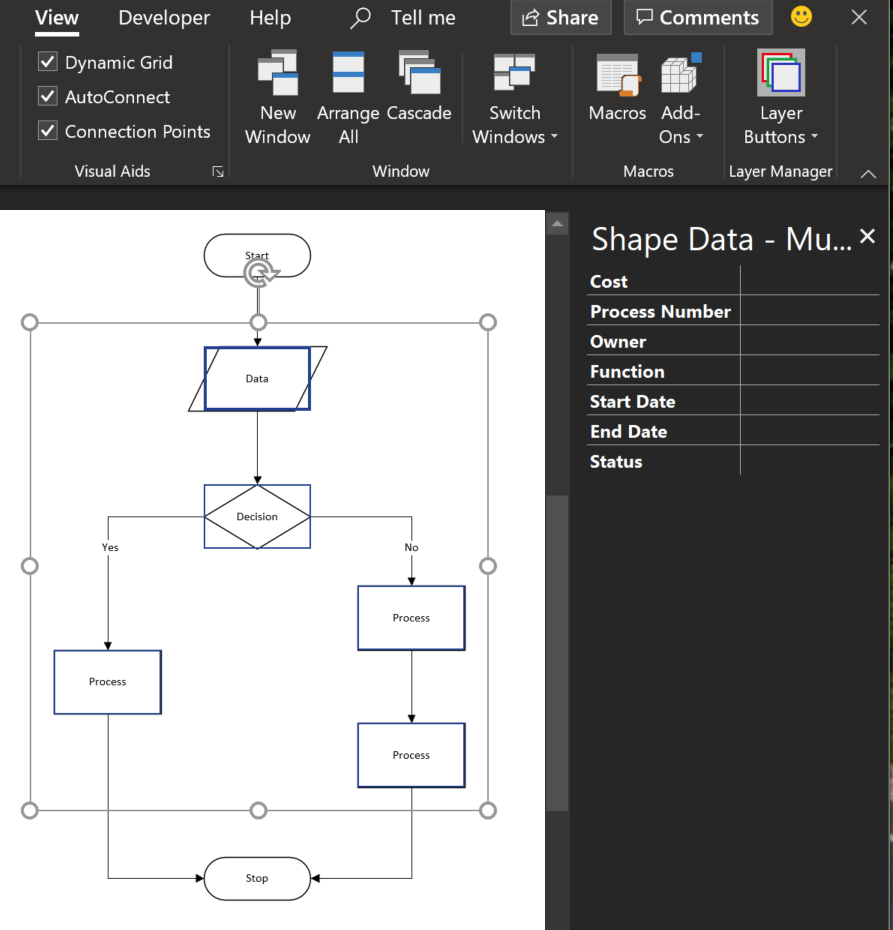
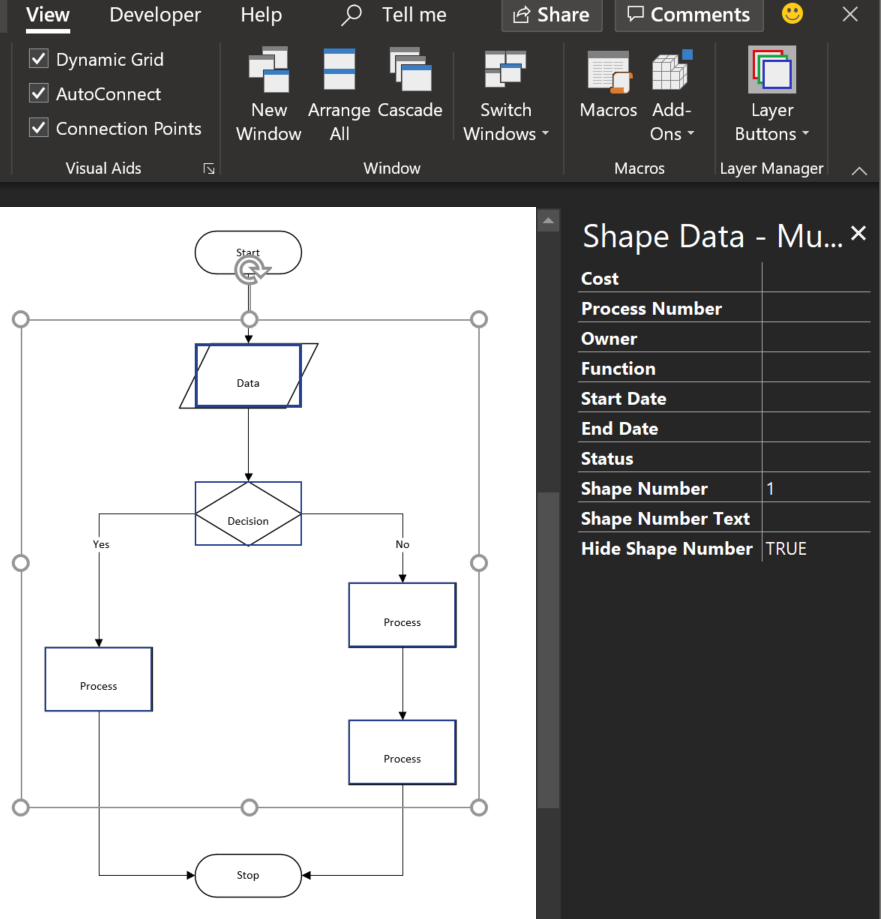
Visio has had a Number Shapes add-on for many years, even since before Microsoft bought the application in 2000. The add-on autmatically creates three Shape Data rows to hold the number, any prefix text, and a value to indicate whether the shape number text should be shown. It is useful, but it can also be very annoying if you also want to label your shapes, such as with process flow shapes, or you want the shape number to be displayed outside of the main shape. Fortunately, there is a solution….

  • No Numbers
  • Visio Extras / Number Shapes
  • Number Shapes / General
  • Number Shapes / Advanced

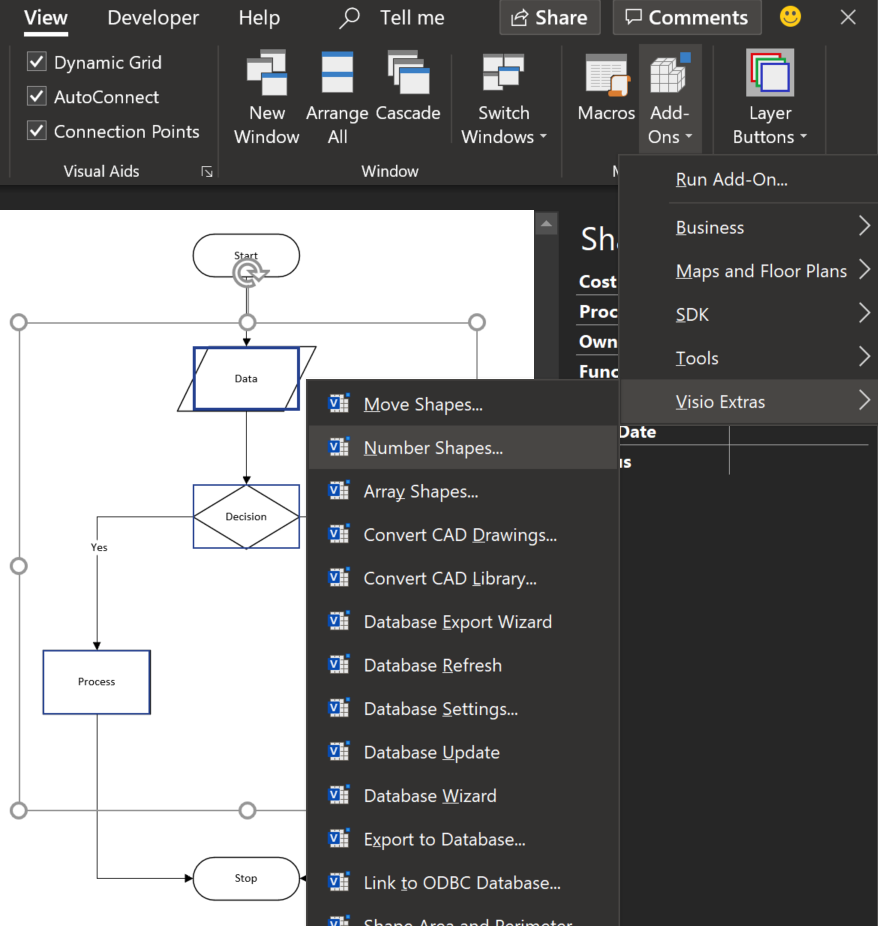
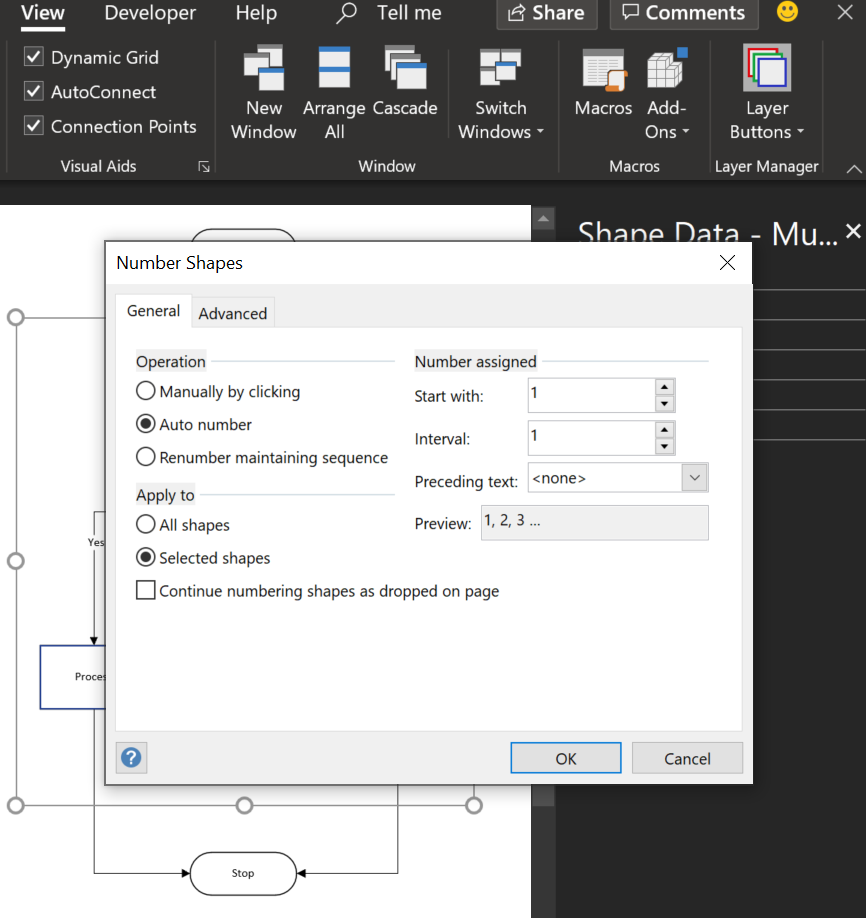
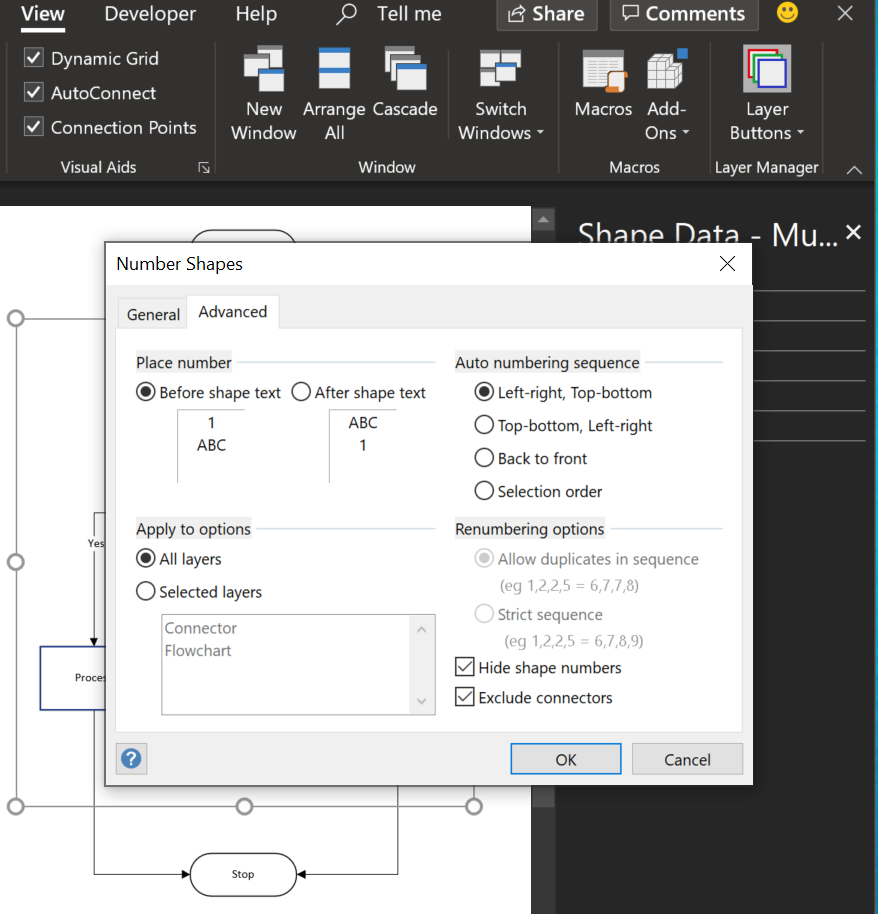
The View / Macros / Add-Ons / Visio Extras / Number Shapes… tool will provide the General options to set which shapes should be numbered, and with what. The Advanced tab has more options such as the direction of auto numbering, the position of the shape number relative to the shape text. The Hide shape numbers option should be ticked because we want to display it outside the shape.

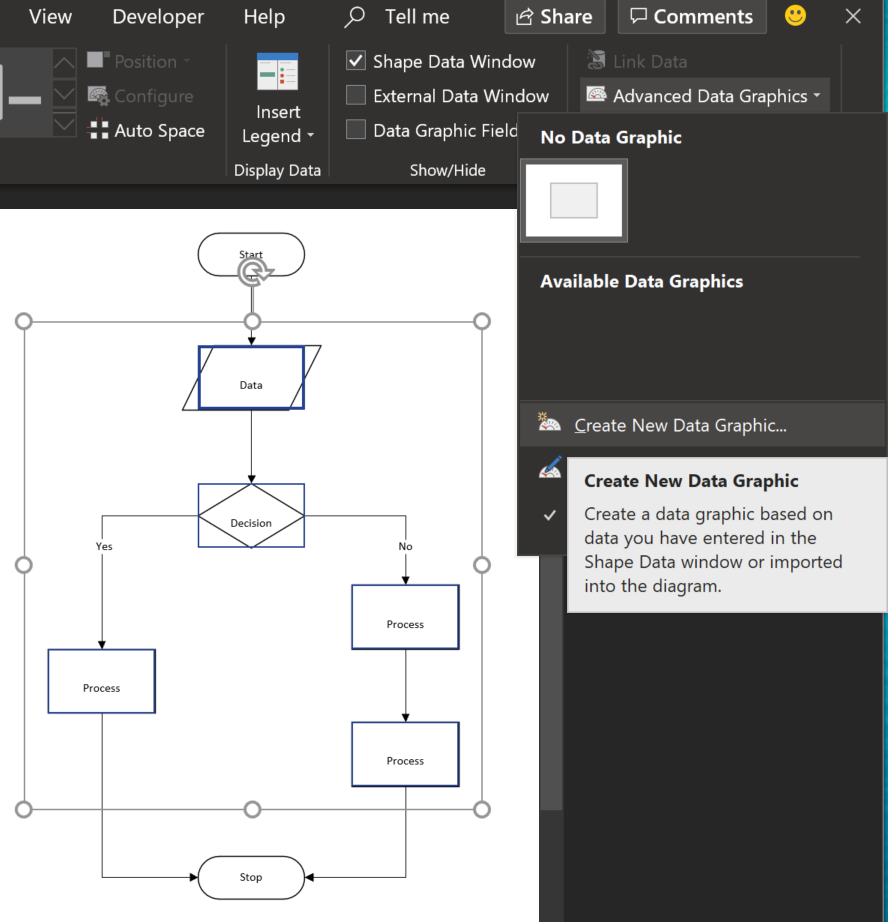
The solution is to use the Data Graphic capabilities of Visio Professional and Visio Online Plan 2.

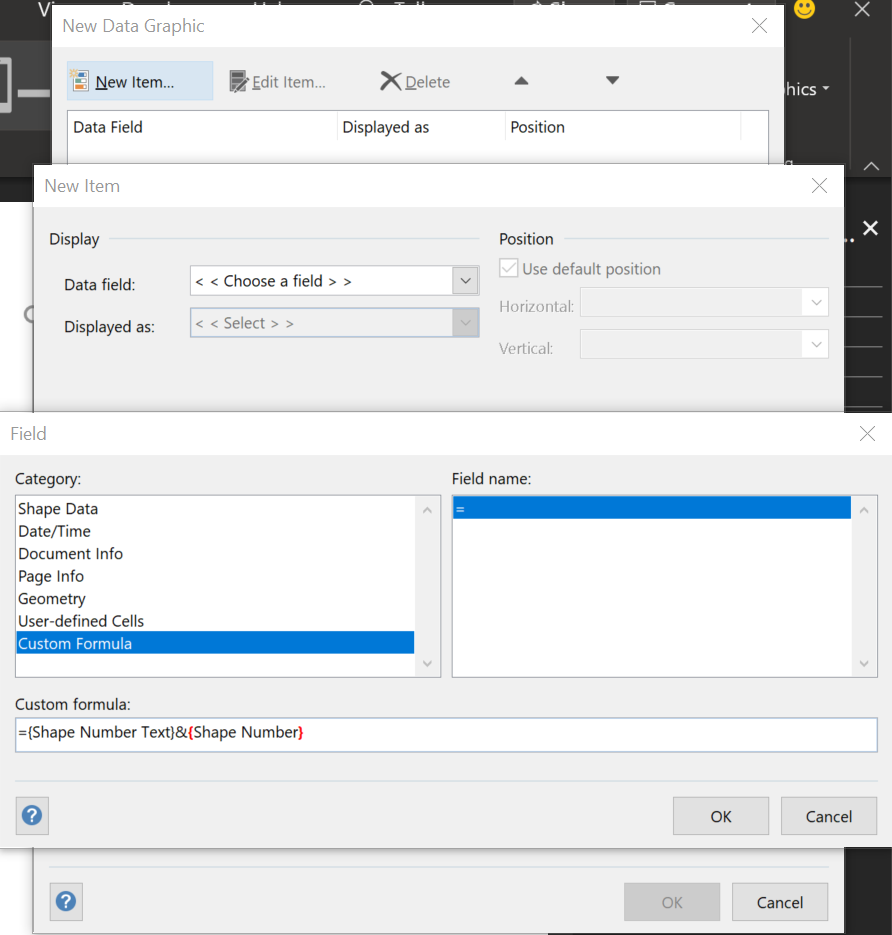
Now create a new Data Graphic, add a New Item and choose the More Fields... option at the bottom of the Data field drop-down list. Then select the Custom Fomula Category and enter:

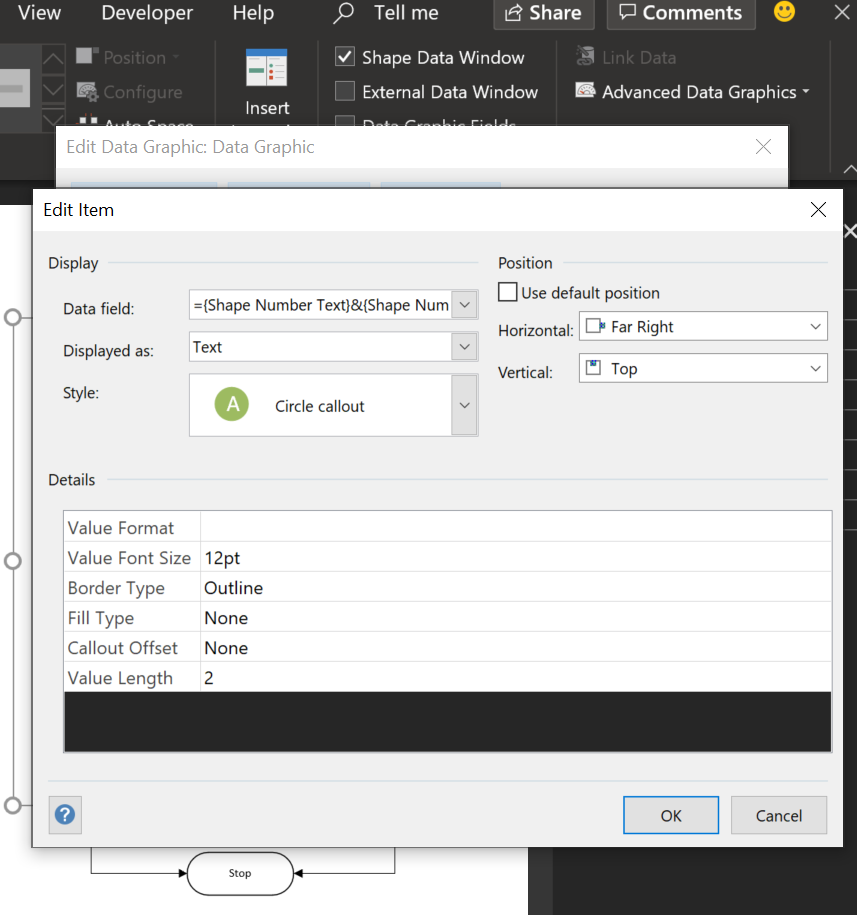
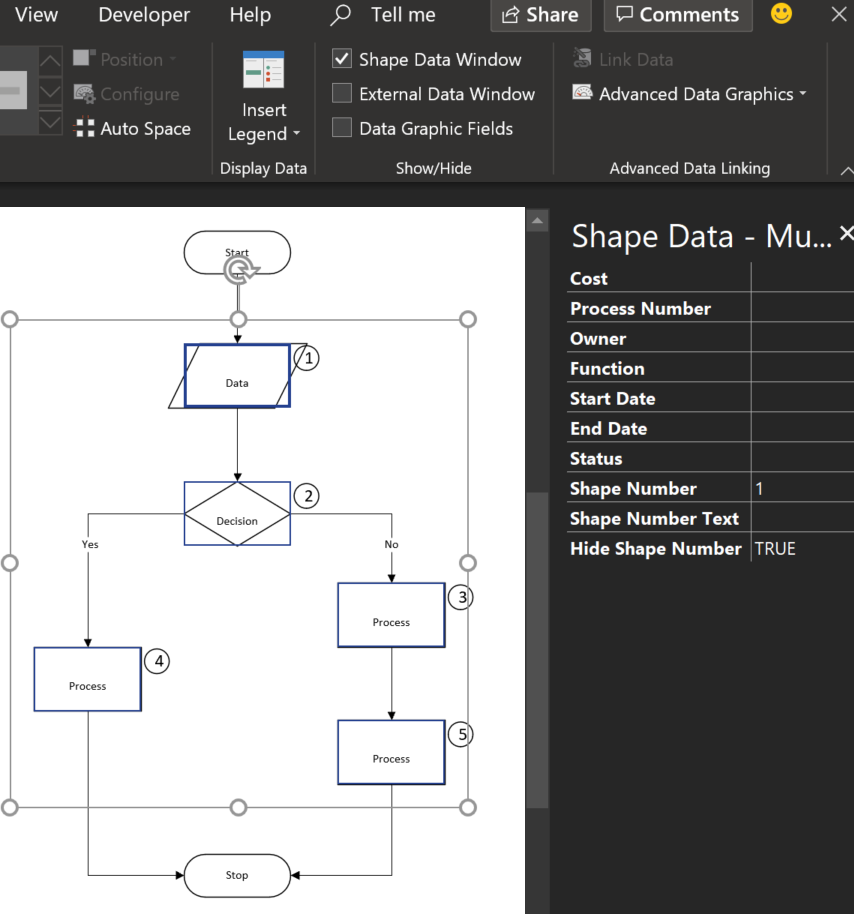
 ={Shape Number Text}&{Shape Number} 

Then choose a suitable Text Callout, such as the Circle callout, and edit the values to suit. Then apply this to all of the shapes that have been numbered.

  • Hidden Numbered Shapes
  • Create a new Data Graphic
  • Enter a Custom Formula
  • Edit the Text Callout

The shape number is displayed, but there is an annoying empty line where the hidden shape number is.

So, we need to add an extra Text Callout Data Graphic item to display the shapes’s text, but to remove the surplus carriage return and line feed characters.

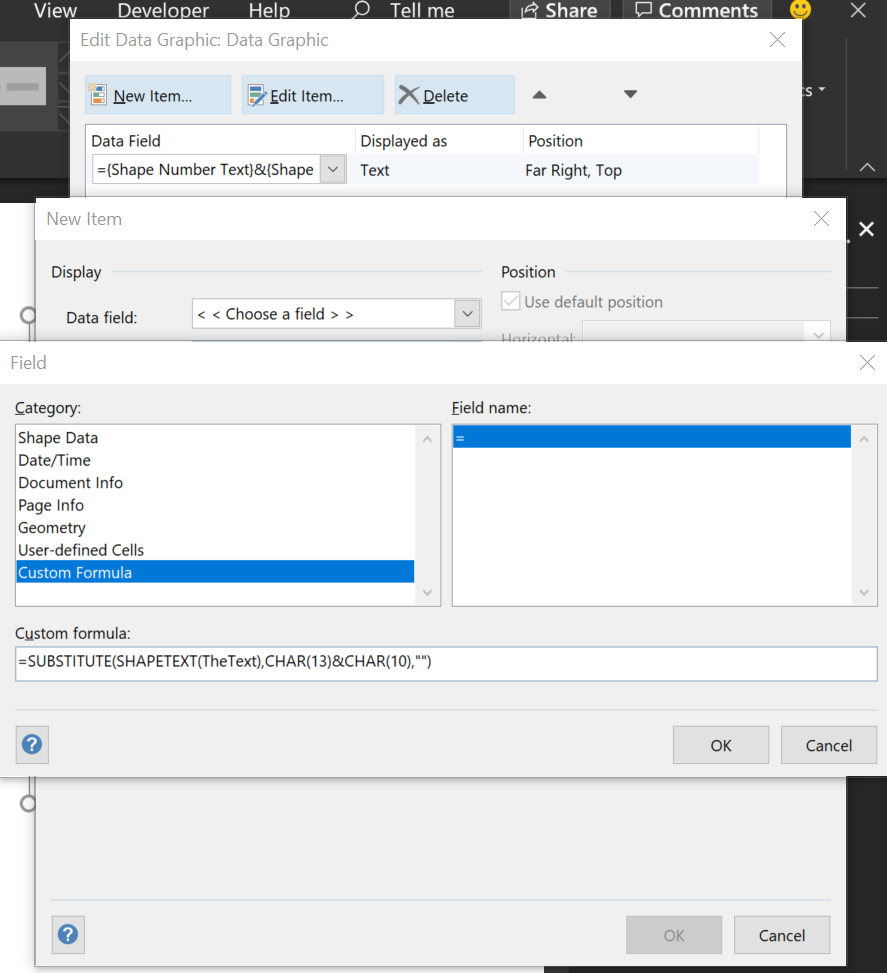
So, edit the existing Data Graphic, select New Item and choose another More Fields…. This time, enter the following Custom Formula:

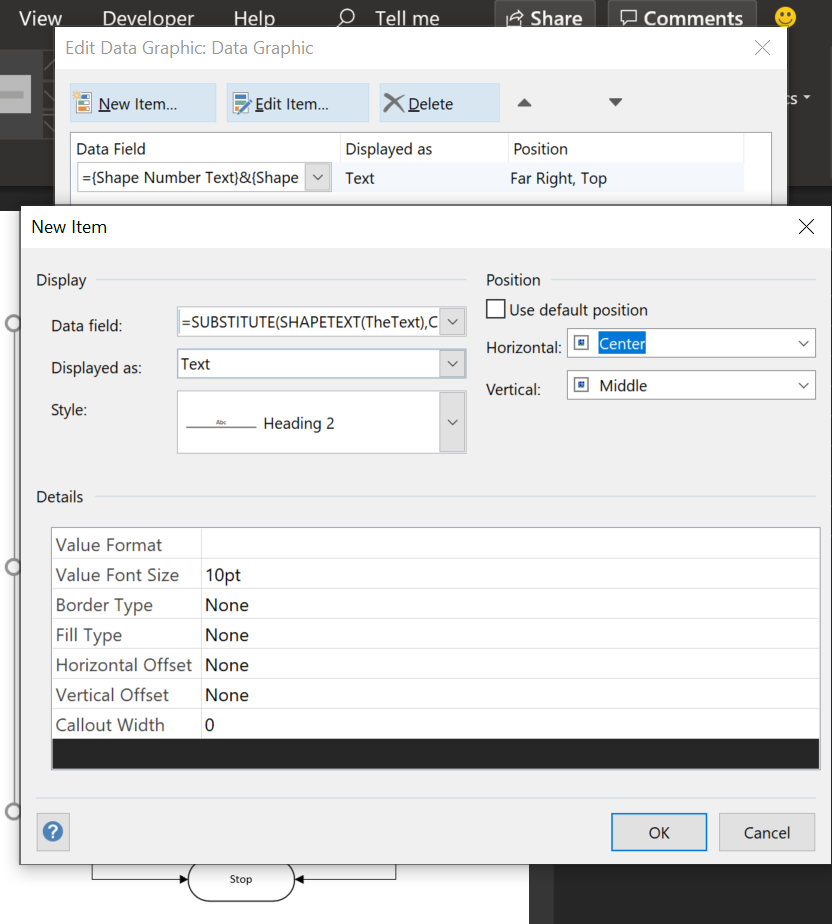
 =SUBSTITUTE(SHAPETEXT(TheText),CHAR(13)&CHAR(10),"") 

This will remove the new line characters and display the text as desired. Ensure that the Hide shape text when data graphic is applied option is ticked.

  • Shape Numbers displayed
  • Another Custom Formula
  • Edit the Text Callout
  • QED

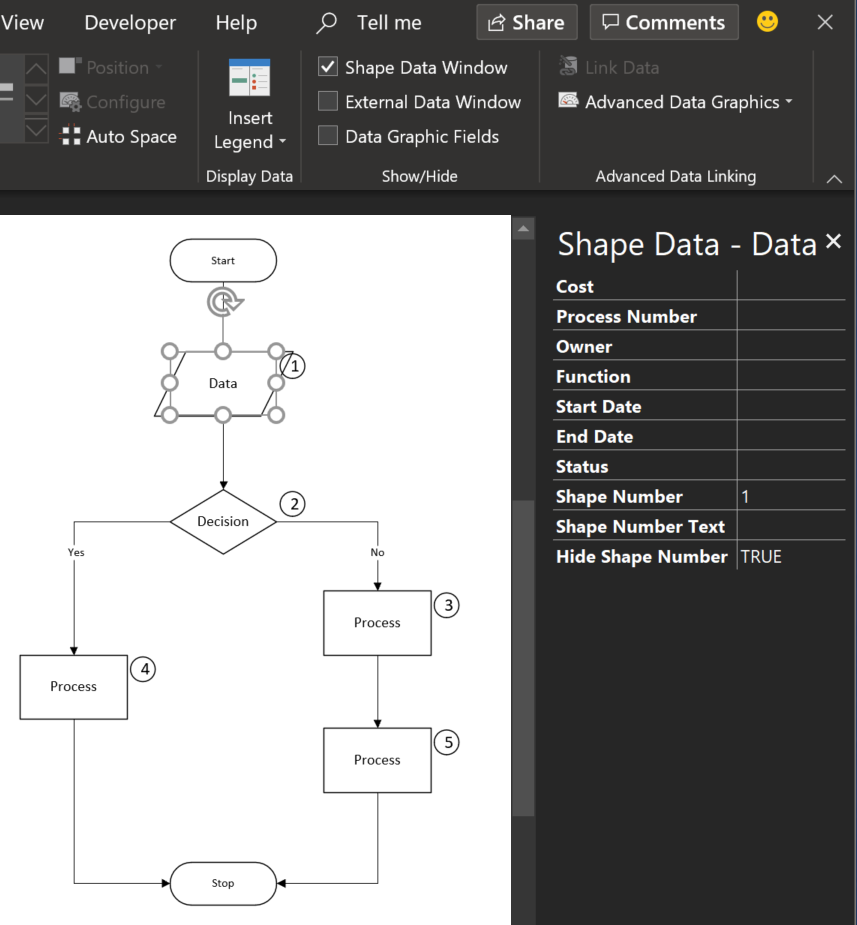
You can still edit the text of the shapes, and you can number or renumber them, as required.

Related

Filed Under: Data Graphics, Shape Data, ShapeSheet Formulas Tagged With: Data Graphics

About David Parker

David Parker has 25 years' experience of providing data visualization solutions to companies around the globe. He is a Microsoft MVP and Visio expert.

Reader Interactions

Leave a Reply Cancel reply

Your email address will not be published. Required fields are marked *

Primary Sidebar

  • LinkedIn
  • Twitter

Recent Posts

  • Update to LayerManager add-in for non-English users
  • Pushing Data Visualizer in Visio beyond its limits
  • Pushing Data Visualizer in Visio to the limits!
  • Teams Tuesday Podcast Recording about Visio
  • Linking Data to Visio Shapes in Code

Categories

Tags

Accessibility Add-Ins Connectors Containers Data Export Data Graphics Data Import Data Visualizer Educational Excel GraphDatabase Hyperlinks Icon Sets JavaScript Layers Legend Link Data to Shapes Lists MSIgnite MVP Office365 Org Chart PowerApps PowerBI PowerQuery Processes Shape Data Shape Design ShapeSheet ShapeSheet Functions SharePoint 2013 SQL Teams Themes Validation VBA Video Visio Visio 2007 Visio 2013 Visio for the Web Visio Online Visio Services Visio Viewer Webinar

Footer

bVisual Profile

The UK-based independent Visio consultancy with a worldwide reach. We have over 25 years experience of providing data visualization solutions to companies around the globe.

Learn more about bVisual

  • LinkedIn
  • Twitter

Search this website

Recent posts

  • Update to LayerManager add-in for non-English users
  • Pushing Data Visualizer in Visio beyond its limits
  • Pushing Data Visualizer in Visio to the limits!
  • Teams Tuesday Podcast Recording about Visio
  • Linking Data to Visio Shapes in Code

Copyright © 2023 · Executive Pro on Genesis Framework · WordPress · Log in