When Microsoft introduced a new way of linking external data to Visio shapes in 2007, I initially bemoaned the inability to update anything but Shape Data row values, unlike the old database add-on that I had been using for 10 years. The new method, though, has many advantages over the old way, not least that it is part of the Visio code library, for any Visio desktop user except the Standard edition.
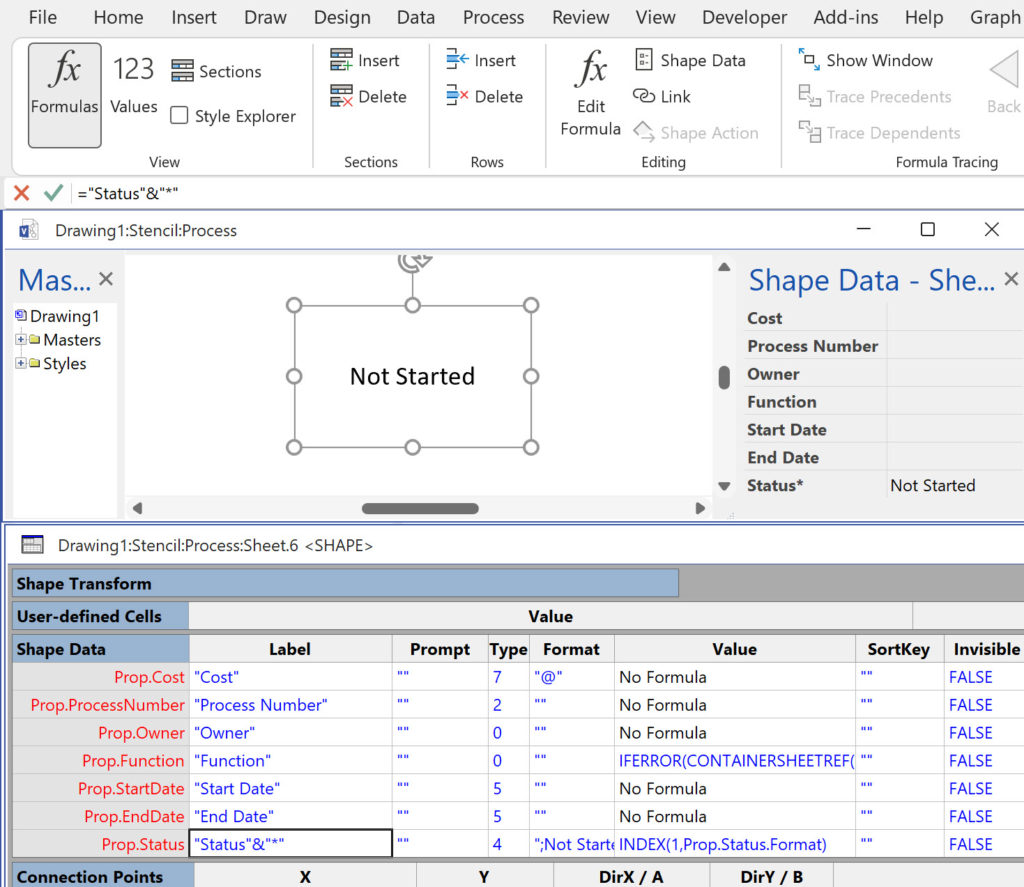
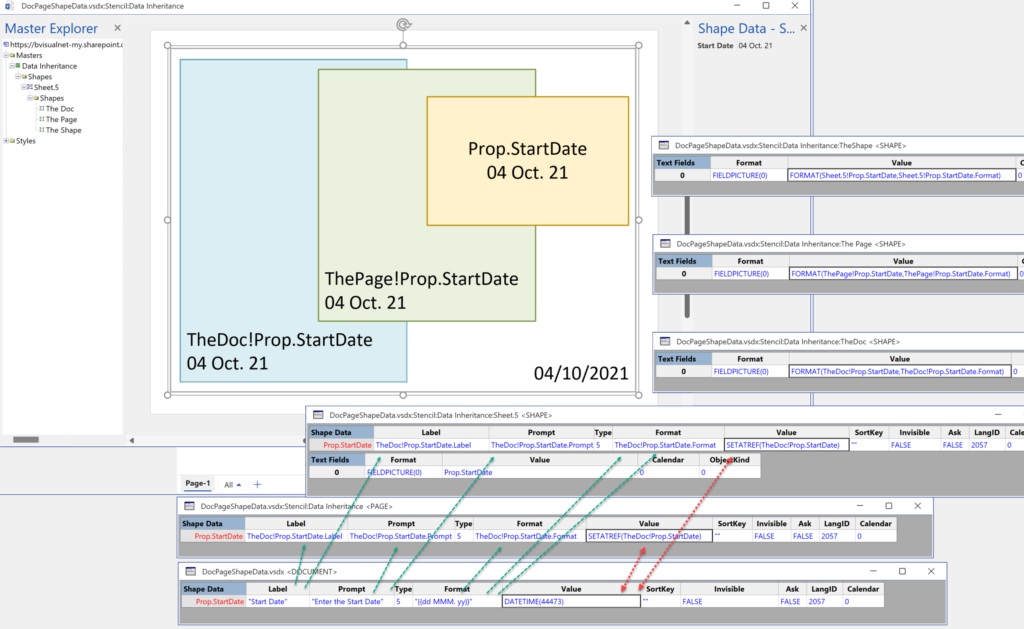
The smartness of Visio shapes is derived from the formulas in the ShapeSheet that lies behind everything. There is a developer interface into this ShapeSheet in every desktop edition, but there is none in any of the web editions, even though the formulas, for the most part, work perfectly well (see my series of posts ShapeSheet Functions A-Z ).
The newer methodology of linking Visio shapes to data can also be used to refresh Visio diagrams automatically, even if the Visio document is not opened in the desktop edition. The Visio documents merely need to be stored in OneDrive, SharePoint (or Teams). This makes it suitable for solution development without assuming that every consumer has a desktop license. Indeed, the Visio Data Visualizer utilizes these newer external data recordsets embedded within the Visio document.
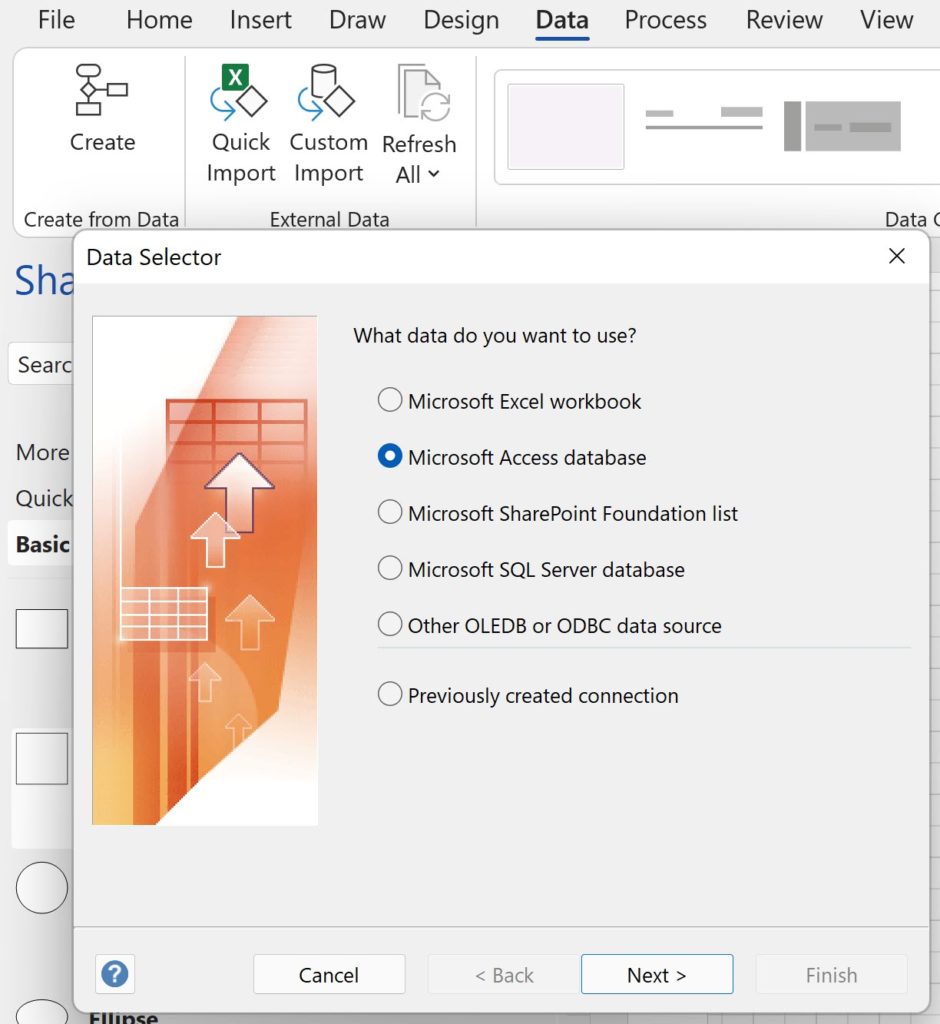
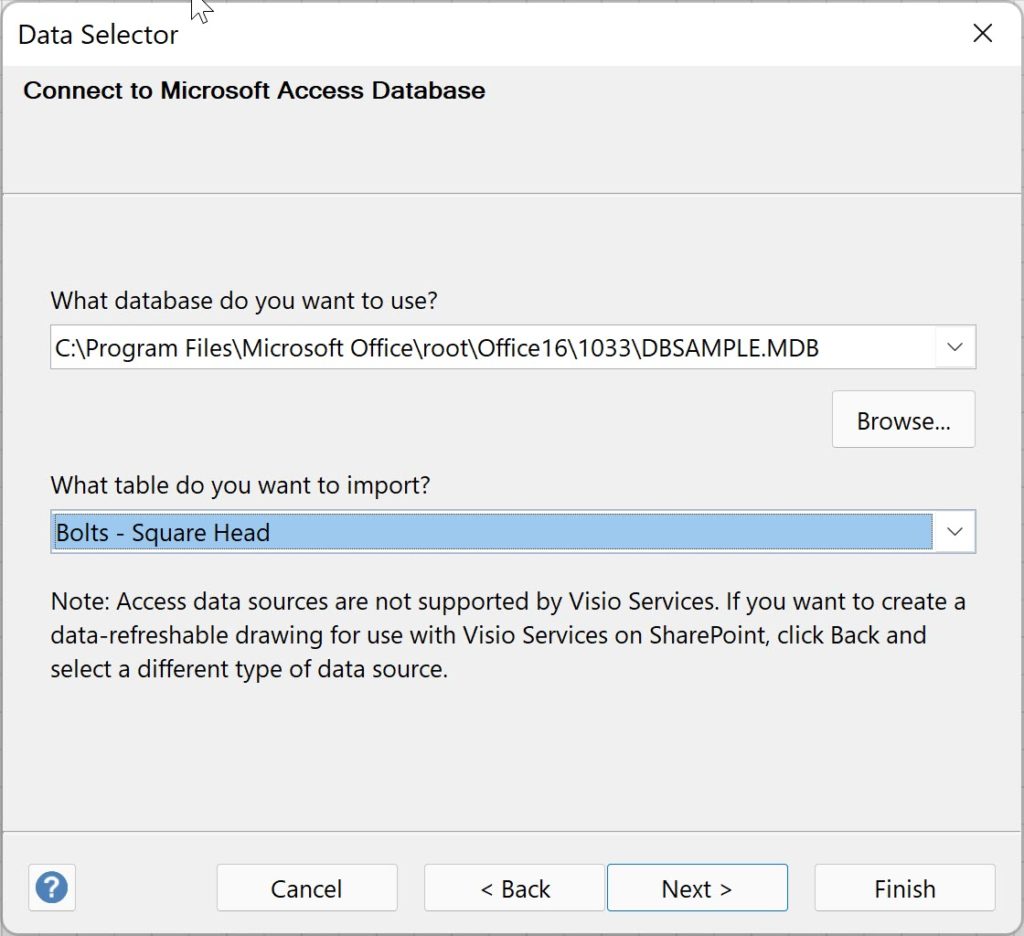
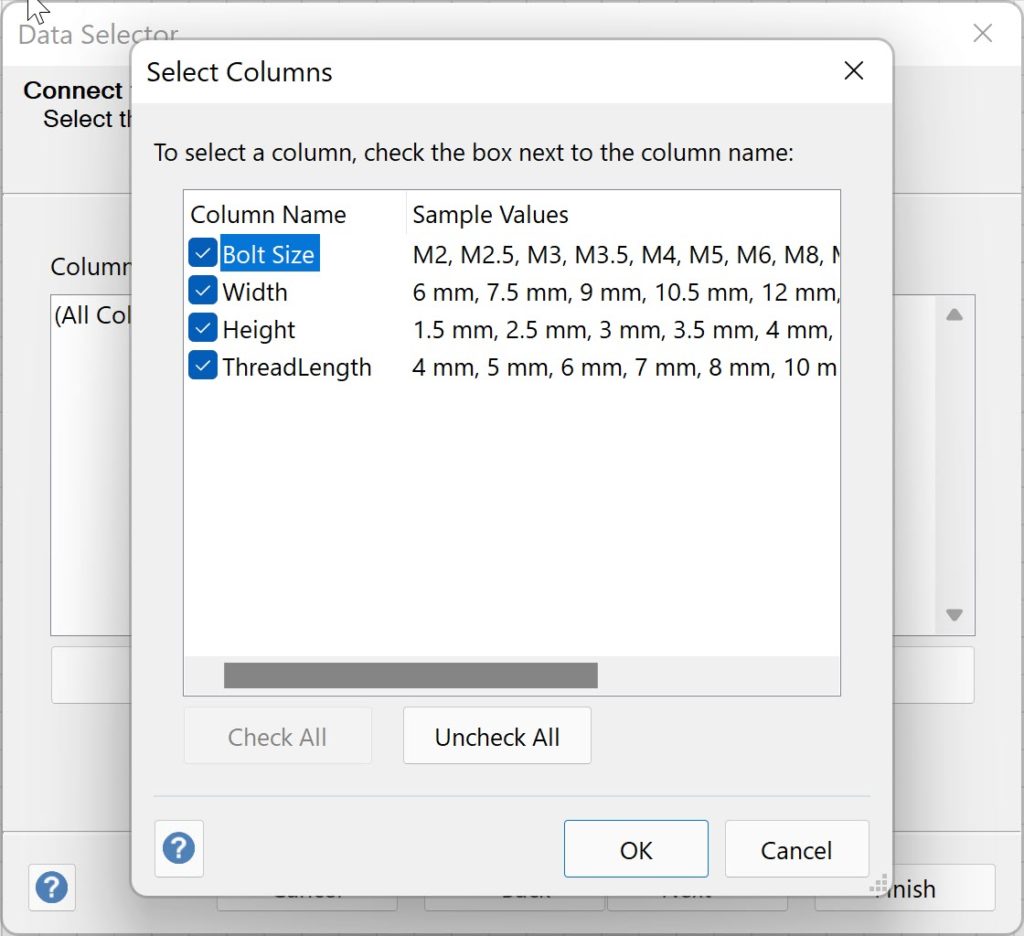
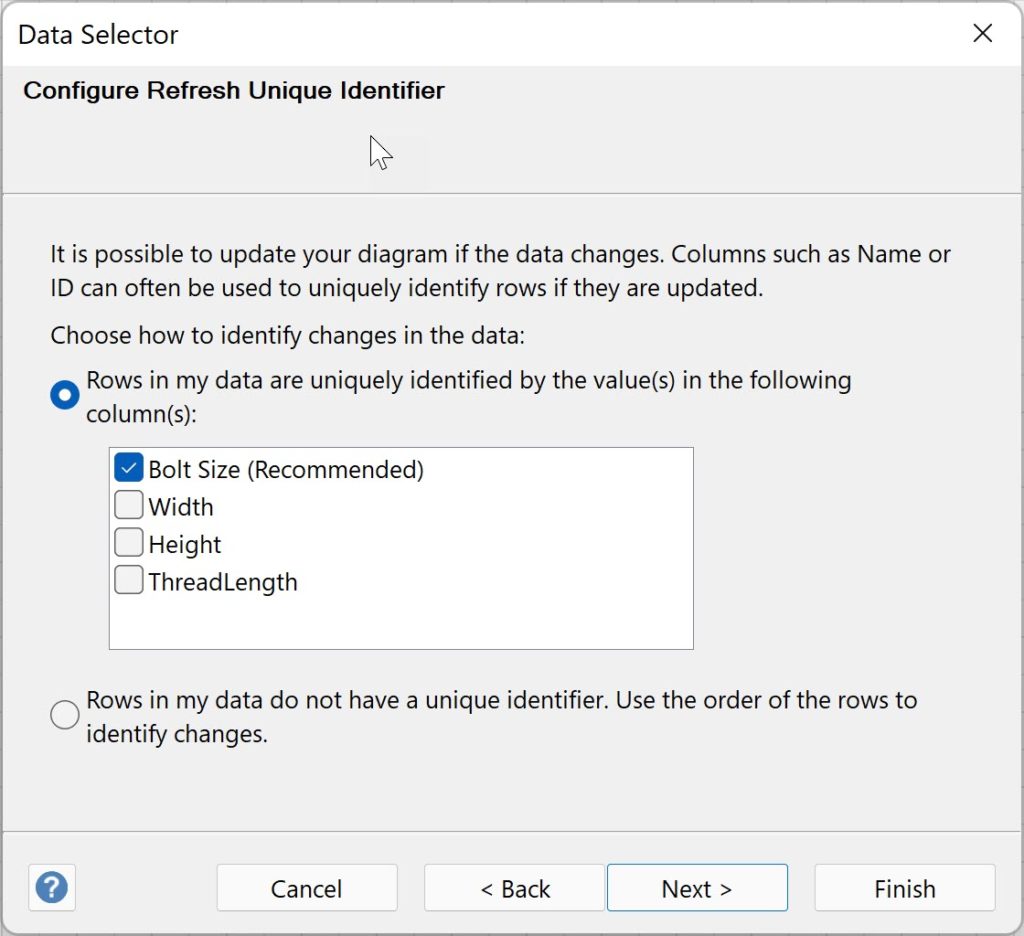
For my example, I used the Visio Sample Database that has been installed with Visio since 1997 for demonstrating the old database linking technology. It is an old style Access database (mdb), and can be found in a sub-folder of the Visio installation folder. I simply used the Data \ External Data \ Custom Import command to import the Bolts – Square Head table.
[Read more…] about Update any Visio ShapeSheet cell with External Data