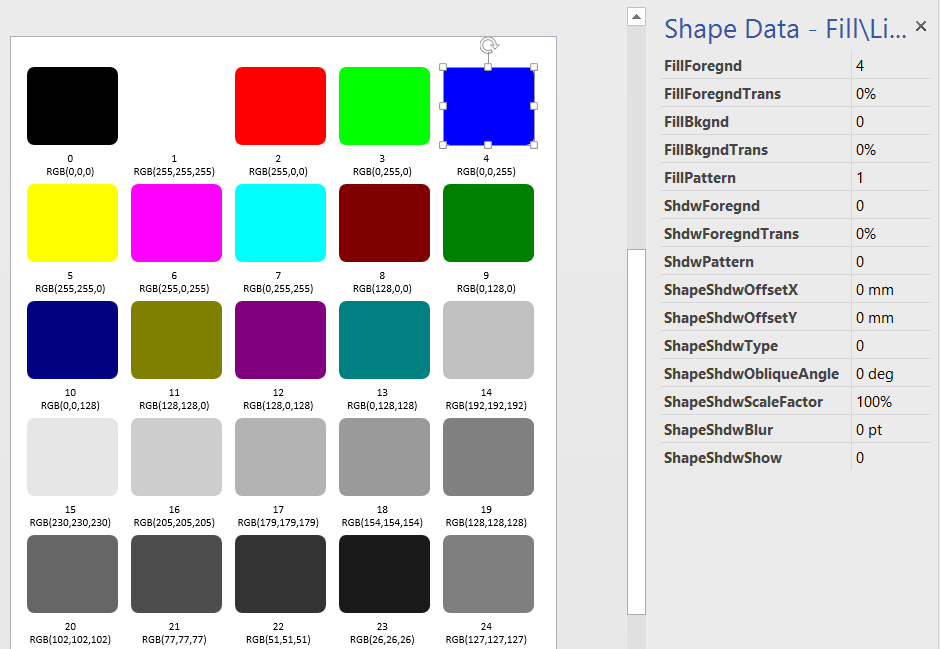
• Skip to main content
  • Skip to primary sidebar
  • Skip to footer

bVisual

  • Home
  • Services
    • How Visio smartness can help your business
    • Visio visual in Power BI
    • Visio Consulting Services
    • Visio Bureau Services
    • Visio Training and Support Services
  • Products
    • Visio Shape Report Converter
    • SS Plus
    • LayerManager
    • visViewer
    • Metro Icons
    • Rules Tools for Visio
    • The Visio 2010 Sessions App
    • Multi-Language Text for Visio
    • Document Imager for Visio
    • multiSelect for Visio
    • pdSelect for Visio
  • Case Studies
    • Case studies overview
    • Using Visio in Education for GIS
    • Visualizing Construction Project Schedules
    • Visio Online Business Process Mapping
    • Nexans Visio Template
    • CNEE Projects, WorldCom
    • Chase Manhattan Bank
  • News
    • Recent news
    • News archive
  • Resources
    • Articles➡
      • ShapeSheet Functions A-Z
      • Comparing Visio for the Web and Desktop
      • Customising Visio Shapes for the Web App
      • Key differences between the Visio desktop and web apps
      • Using the Visio Data Visualizer in Excel
      • Using Visio in Teams
      • Creating Visio Tabs and Apps for Teams with SharePoint Framework (SPFx)
      • Designing Power Automate Flows with Microsoft Visio
      • Innovative uses of Visio Lists
    • Webcasts ➡
      • Visio in Organizations
      • My session and other Visio sessions at MSIgnite 2019
      • Power up your Visio diagrams
      • Vision up your Visio diagrams
      • The Visio 2010 MVP Sessions
    • Visio Web Learning Resources
    • Books➡
      • Visualize Complex Processes with Microsoft Visio
      • Mastering Data Visualization with Microsoft Visio
      • Microsoft Visio Business Process Diagramming and Validation
      • Visualizing Information with Microsoft Visio
  • Blog
    • Browse blog articles
    • Visio Power BI articles
    • Visio for Web articles
    • A history of messaging and encryption
  • About us
    • About bVisual
    • Testimonials
    • Bio of David Parker
    • Contact Us
    • Website Privacy Policy
    • Website terms and conditions
    • Ariba Network

ShapeSheet Formulas

Published on February 9, 2017 by David Parker

More secrets of the Visio Legend shape

I was going to do a full post on the special Legend shape in Visio that can automatically count instances of masters on a page, then I found that my good friend Chris Roth, aka VisGuy, had done one some years ago ( see visguy.com/…/legend-shapes). However, I have some extra information that will assist in getting the functionality to work consistently.
Basically, you can make any Master work with the Legend shape by adding the User.visLegendShape = 2 setting into a Master shape, but there are caveats.

  1. If the name of a Master is changed, then any existing shapes on the page must be re-placed
  2. The BaseID of each Master must be unique
  3. If the BaseID is changed (using NewBaseID), then any existing shapes on the page must be re-placed

To demonstrate this, I used the Good and Bad icon shapes from the Legend Shapes stencil.

[Read more…] about More secrets of the Visio Legend shape

Filed Under: ShapeSheet Formulas, Visio, Visio 2016 Tagged With: Legend, ShapeSheet, VBA

Published on January 8, 2017 by David Parker

A Blackstar alphabet in Visio

I wrote an article last year for Microsoft, using Visio to explain some bits of messaging and encryption (see Musings on MVP Open Day 2016 at Bletchley Park.pdf ). I finished the article with an unexplained image of a word, well the solution was obviously “BOWIE”, as written on the cover of his final album, Blackstar, released exactly one year ago today.

2017-01-08_17-58-14
[Read more…] about A Blackstar alphabet in Visio

Filed Under: Shape Data, ShapeSheet Formulas, Visio 2016 Tagged With: Shape Data, ShapeSheet Functions

Published on October 30, 2016 by David Parker

US State Flags for Visio

I am working on a project where I thought the US State flags might be useful, so I quickly created a new master shape from the images in Wikipedia. The shape simply provides a selection of one of the states from the Shape Data window (plus one extra for the reverse of Oregon’s flag!).

The flag shape has a couple of Shape Data rows:

[Read more…] about US State Flags for Visio

Filed Under: Geographic, Shape Data, ShapeSheet Formulas, Visio 2016 Tagged With: Flag, US States

Published on March 21, 2016 by David Parker

New book available for pre-order : Mastering Data Visualization with Microsoft Visio Professional 2016

2661en_5241_mastering20data20visualization20with20microsoft20visio20professional202016

I have a new book on Visio coming out in June called Mastering Data Visualization with Microsoft Visio Professional 2016. It covers the ins and outs of data with Visio!
Please visit http://bit.ly/1SeVfwW for more information.


Packt Publishing are currently running a deal on my last book, Microsoft Visio 2013 Business Process Diagramming and Validation , until 12th April 2016:

Follow this link : 1LHNDwI

Filed Under: Books, Data Graphics, Shape Data, Shape Design, Shape Reports, ShapeSheet Formulas, Visio 2016 Tagged With: Data Export, Data Graphics, Data Import, DataRecordset, Shape Data, Visio

Published on February 5, 2016 by David Parker

Displaying the Fill and Line Section Values of a shape

A few years ago, I wrote an article about displaying the RGB value of shapes ( see http://blog.bvisual.net/2010/04/22/displaying-the-rgb-values-of-shapes ). I had forgotten about it, but a reader recently asked if it was possible to force the Foregnd field to display the RGB value for the standard color palette values. For example, red is number 2 in the palette, and has a value of RGB(255,0,0). In revisiting the article, I realised that there is a smarter way to display the values, without the need of any macros.

I simply created a master shape that exposes each of the cells in the Fill and Line sections as Shape Data rows. This allows me to enter values in the Shape Data window and see the effect on the shape immediately. So, it was easy to drop one shape, insert text fields, and then use the Array Shapes tool to layout the shapes. Finally, I just entered the the standard color map numbers 0 to 24 in the FillForegnd Shape Data row.

image
[Read more…] about Displaying the Fill and Line Section Values of a shape

Filed Under: Color, ShapeSheet Formulas, Visio Tagged With: Shape Data, ShapeSheet Functions

Published on December 24, 2015 by David Parker

Improving the legend of multi-data Data Graphic items in Visio

Data Graphics in Visio Professional (and Premium) are a great way of surfacing the information in each shape, but it can be easy to forget what the Color By Value, Icon Sets or Data-bars represent:

image
[Read more…] about Improving the legend of multi-data Data Graphic items in Visio

Filed Under: Data Graphics, Shape Data, ShapeSheet Formulas, Visio Tagged With: Data Graphics, Legend, Shape Data

  • « Go to Previous Page
  • Page 1
  • Interim pages omitted …
  • Page 12
  • Page 13
  • Page 14
  • Page 15
  • Page 16
  • Interim pages omitted …
  • Page 19
  • Go to Next Page »

Primary Sidebar

  • LinkedIn
  • Twitter

Recent Posts

  • Creating Boolean Context Menus in Visio
  • Installing Visio Templates and Stencils
  • Creating a Dynamic connector master automatically
  • A visual exploration of Penrose Tiling in Visio
  • How SVG in Visio can cause a Shape.BoundingBox(…) error

Categories

Tags

Accessibility Add-Ins AdvancedInstaller Connectors Containers Data Export Data Graphics Data Import Data Visualizer Educational Excel GraphDatabase Hyperlinks Icon Sets JavaScript LayerManager Layers Legend Link Data to Shapes MSIgnite Office365 Org Chart PowerApps PowerBI PowerQuery Processes Setup and Deployment Shape Data Shape Design ShapeSheet ShapeSheet Functions SharePoint 2013 SQL Teams Validation VBA Video Visio Visio 2007 Visio for the desktop Visio for the Web Visio Online Visio Services Visio Viewer Webinar

Footer

bVisual Profile

The UK-based independent Visio consultancy with a worldwide reach. We have over 25 years experience of providing data visualization solutions to companies around the globe.

Learn more about bVisual

  • Amazon
  • E-mail
  • Facebook
  • LinkedIn
  • Twitter
  • YouTube

Search this website

Recent posts

  • Creating Boolean Context Menus in Visio
  • Installing Visio Templates and Stencils
  • Creating a Dynamic connector master automatically
  • A visual exploration of Penrose Tiling in Visio
  • How SVG in Visio can cause a Shape.BoundingBox(…) error

Copyright © 2026 · Executive Pro on Genesis Framework · WordPress · Log in