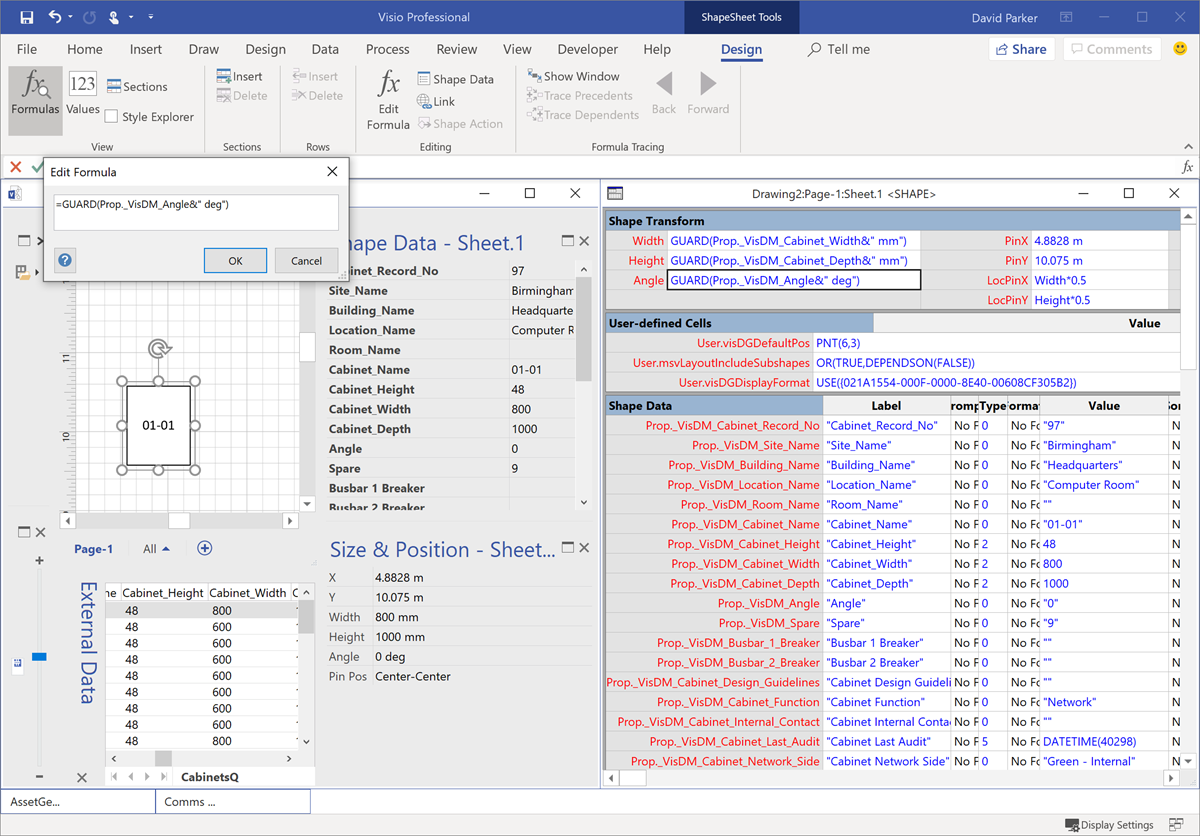
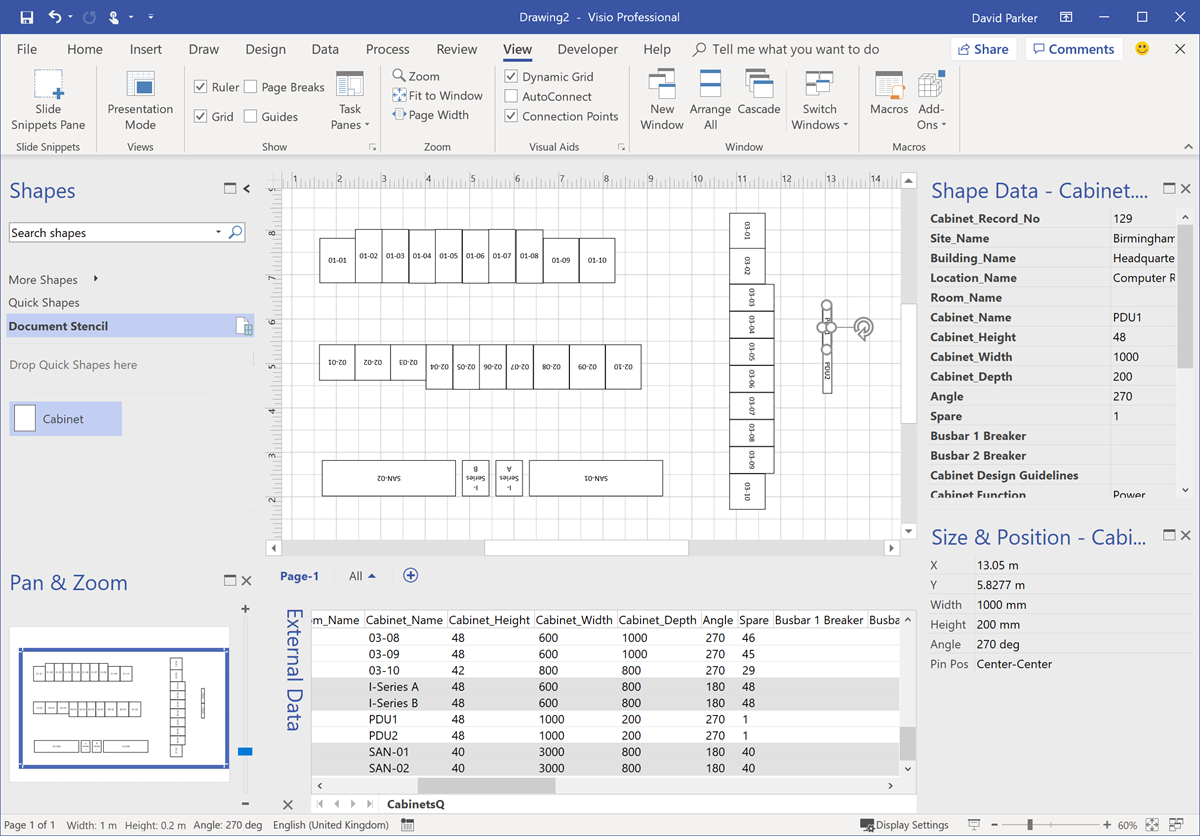
I am working on an application where the horizontal axis of the Visio page represents dates from left to right. In fact, the each of the fixed horizontal grids are 1 day, and I need to have shapes that understand the begin date at the left edge of the shape, and the end date at the right edge of the shape. There is, therefore, a number of elapsed days representing by the width of the shape. However, the underlying grid can either represent all days, or it can be changed to only represent weekdays by omitting the weekends. I struggled to find the best formula to calculate the elapsed days or weekdays between two dates in Visio ShapeSheet formulas, so I turned to Excel to provide an inspiration. The Visio ShapeSheet is modelled on the Excel worksheet, and formulas can be entered into the cells in much the same way. However, the available functions differ since Excel is mainly used for arithmetic and statistics, but Visio is used for graphics and data. In this article, I demonstrate how I used C# and Excel to construct and test formulas for use in a Visio shape.
[Read more…] about Prototyping Visio ShapeSheet Formulas in ExcelShapeSheet Formulas
Controlling Visio layers with linked data
Readers of my blog will know that I use the layers in Visio pages to change the display for different scenarios. My macro to toggle layers on/off has been very popular, and I have written an add-in to manage layers that is widely used. However, I was recently asked if the layer settings can be controlled from linked data. Linking data in Visio has been available in all desktop editions, except Standard, since 2007, and I have written many articles and two books extolling this feature, but I haven’t so far controlled layer settings with it, so this article describes how this can be done … as shown in the following screen recording!

Enhancing the Built-In Containers in Visio
The concept of Structured Diagrams was introduced in Visio 2010 to provide core functionality for a variety of the templates in Visio, such as the Cross-Functional Flowchart, BPMN Diagram and Wireframe Diagram. This is primarily evident as Containers, Lists and Callouts and they can be customized (see Custom Containers, List and Callouts ), as shown in some of my previous articles ( see https://blog.bvisual.net/?s=container). One example of this extension can be found in all of the flowchart shapes that placed into a swimlane in a cross-functional flowchart. They have a Shape Data row, Function, that automatically inherits the text entered into the header of the swimlane. In another example, a Visio user can use Insert / Diagram Parts / Container to visually group other shapes together, and update the header text of the container. Well, I often do want my custom shapes to inherit the text of a container, so, in this article, I show how the built-in containers can be enhanced to provide this ability.

You should be aware that I often exploit the fact that Visio creates a local copy of each master shape that it uses within a document. This can be modified and set to match master by name on drop, to ensure that it is the one to use, even if the original Microsoft provided version is used. In this case, I use this trick to create hidden, enhanced versions of the containers that are available in the gallery of containers. Microsoft also do this with the Dynamic connector shape in a number of their own templates.
If you examine the Function Shape Data row of any of the flowchart shapes, then you will find the formula:
Really Snapping to Grids in Visio
Visio has the ability to refine the options for snapping shapes to just grids, but this does not necessarily mean that shapes will automatically position themselves on a grid, or that the size is a multiple of a grid. What if you want some shapes to always be positioned on a fixed grid, and the width and height to always be a multiple on the horizontal and vertical grids respectively? What if you want the grid to start at the top left rather then the default bottom left? Fortunately, the ShapeSheet of the page and shapes can provide this ability, without the need for any external code.
You can set the page to have Fixed horizontal and vertical grids, each with different minimum spacing, if necessary. You can set the grid and ruler origins using the Ruler & Grid dialog, but it will be always relative to the bottom left corner of the page. So this can be a problem if you change the print margins or the page size, if you really want the grid origin to remain in another position, like top left.
You can just leave the Grid for snapping, and even change its strength to Strong, and even enter a larger number manually. This can help with snapping to the grids, but it is not enforced to be exclusive to the grids.
Using EVALCELL() in Visio to calculate Workdays
I recently agreed to calculate the number of workdays between two dates in Visio, without realising how difficult it is. Excel users are lucky because it has the NETWORKDAYS() function, but Visio users are not so fortunate. However, Visio does have the EVALCELL function which can be extremely useful in cases like this. I got the inspiration from one of the answers in StackOverflow for a SQL user who also needed a solution.
Swapping Images in a Visio Shape
I often include images in Visio diagrams, and sometimes they are part of a group shape. There are times when I need to swap the image for another, and I want the correct width to height ratio for the new image to be applied, otherwise the image will be distorted. I recently realised that the Shape.ChangePicture() function in Visio actually returns this ratio which can then be applied to the shape cells so that the image is not distorted. Therefore I wrote some C# code (in LinqPad) to utilize this method to provide the option to change the image in a selected shape or sub-shape.
So, I wrote this function in C# to swap the image of the shape, and to apply the formulas to maintain its correct aspect ratio, even if the shape is subsequently resized.


