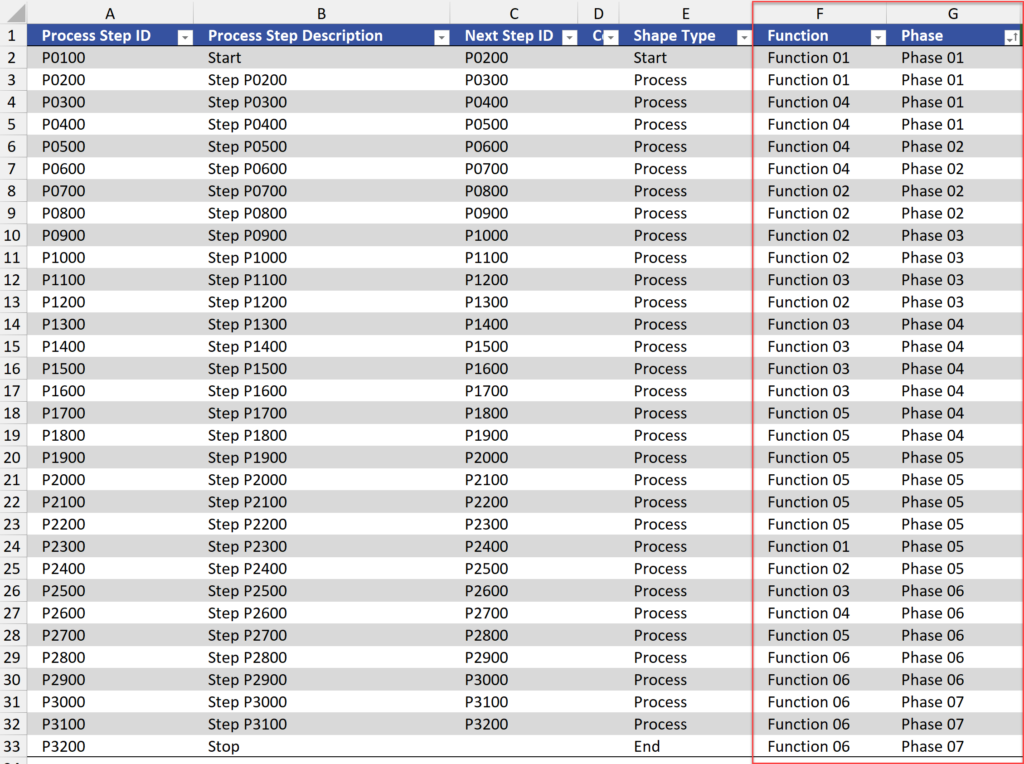
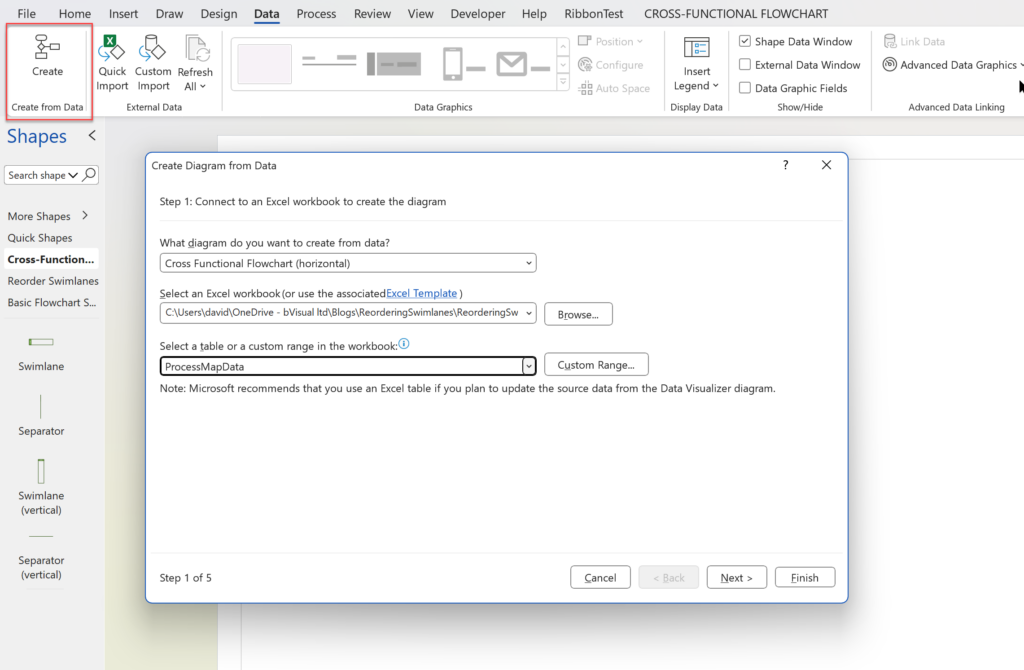
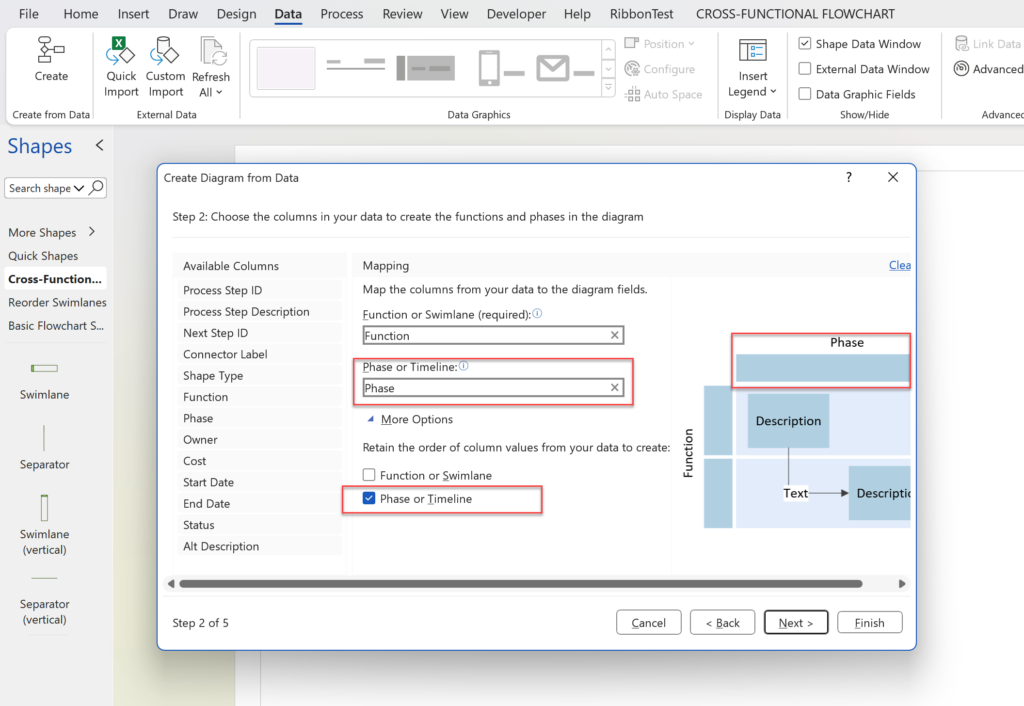
Microsoft Visio desktop Plan 2 and Professional editions provides the ability to create and synchronize cross-functional flowcharts between the diagram and an Excel table. This is great, and widely used for many types of processes. The Excel table normally has a Function / Swimlane column that contains text that becomes labels on the swimlane containers, and a Phase / Timeline column that contains text that becomes the label of the phase or separator containers. The import provides the option to order the diagram by Function and/or Phase, but it is impossible to get them ordered by both! This article provides a solution using a free macro-enabled Visio stencil.
[Read more…] about Optimize Visio Flowcharts: Swimlane Reordering TipsDiagram Types
Setting Default Measurement Units in Visio Pages
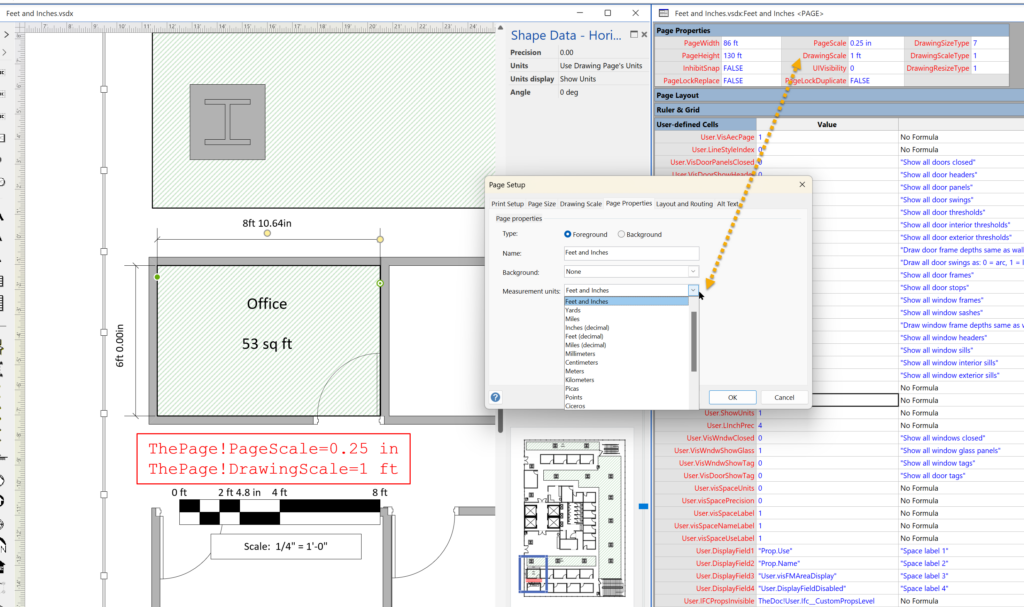
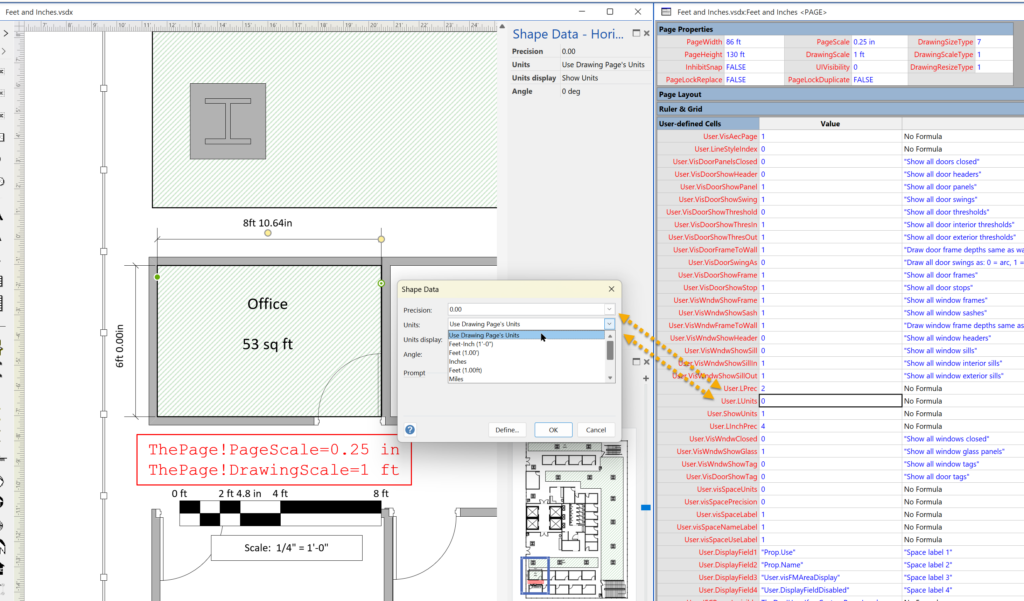
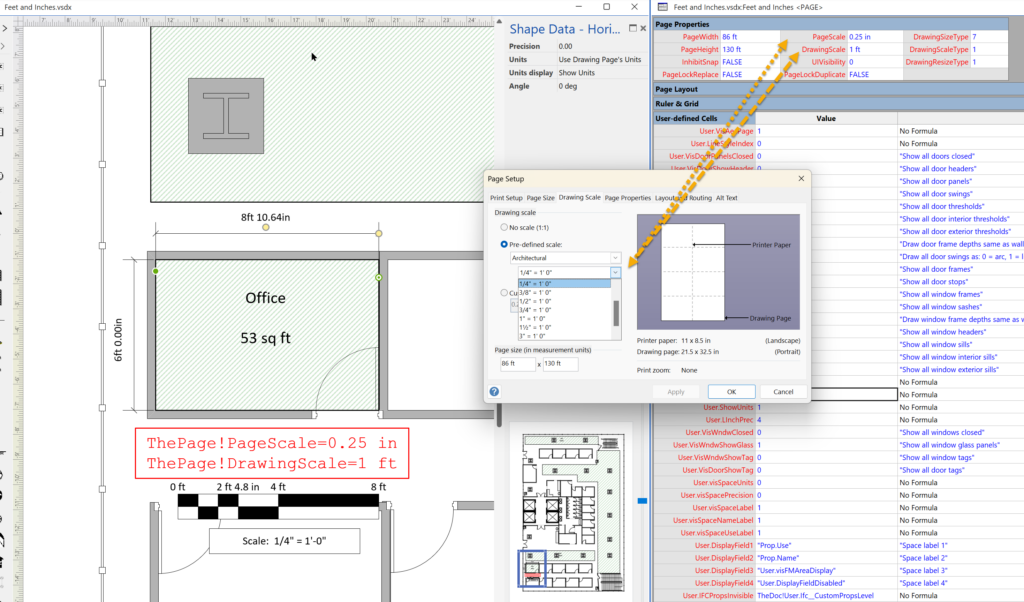
Microsoft Visio can handle many different units of measurements which can be set for a page and separately for shapes, such as dimensions, within the page. This can confuse some users who expect them both to be the same all the time. In fact, the dimension units can be set to be the same as the page units, but not necessarily so. It is possible to have different units on different dimension shapes, but is also possible to set all the same with one click, and to synchronise them with the page units.
[Read more…] about Setting Default Measurement Units in Visio PagesMoving Phases/Separators in Visio Cross-Functional Flowcharts?
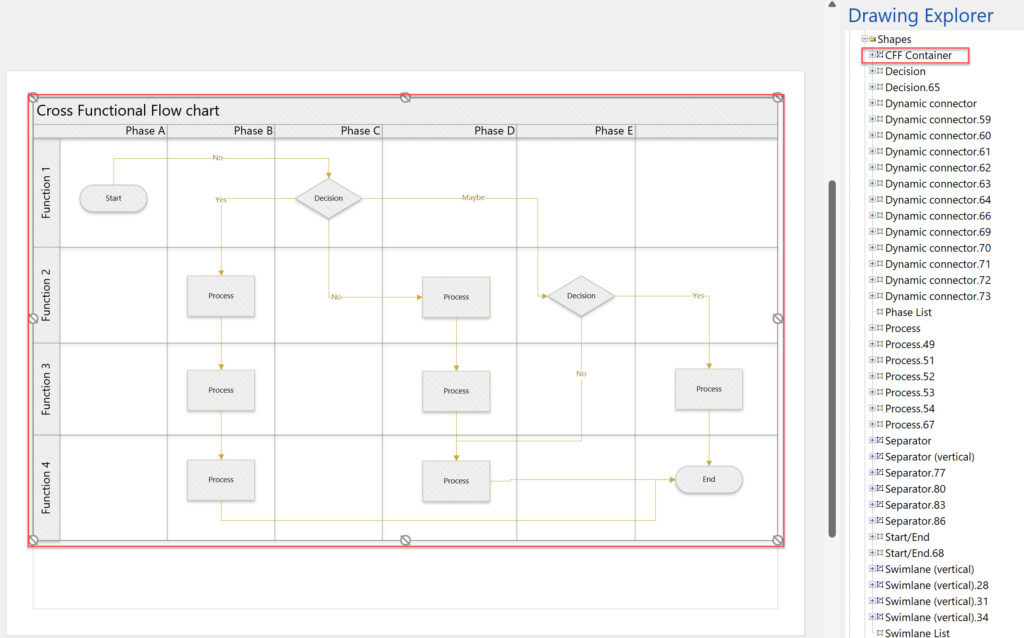
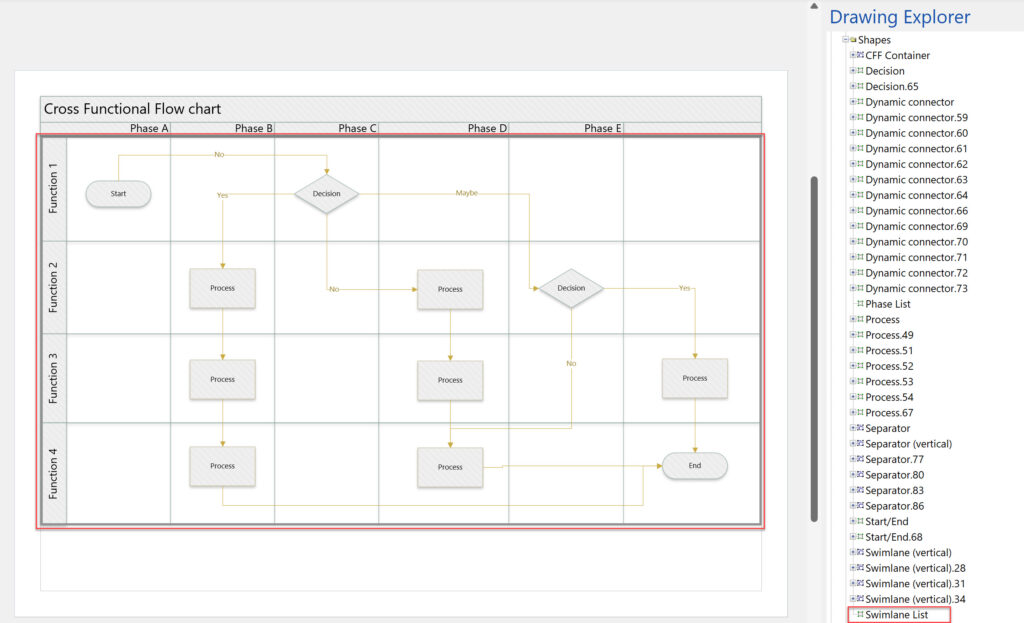
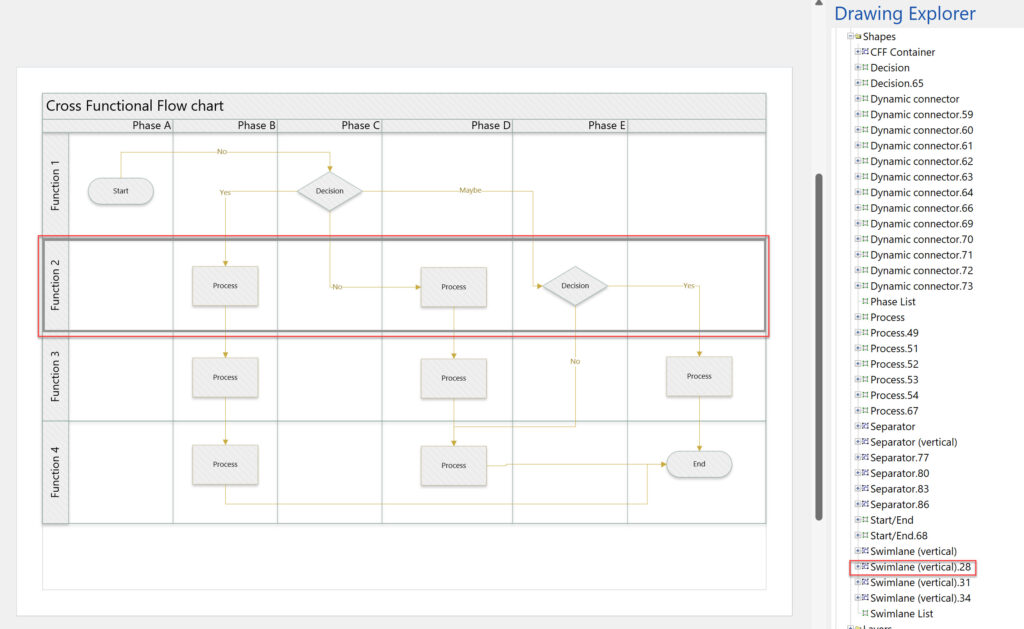
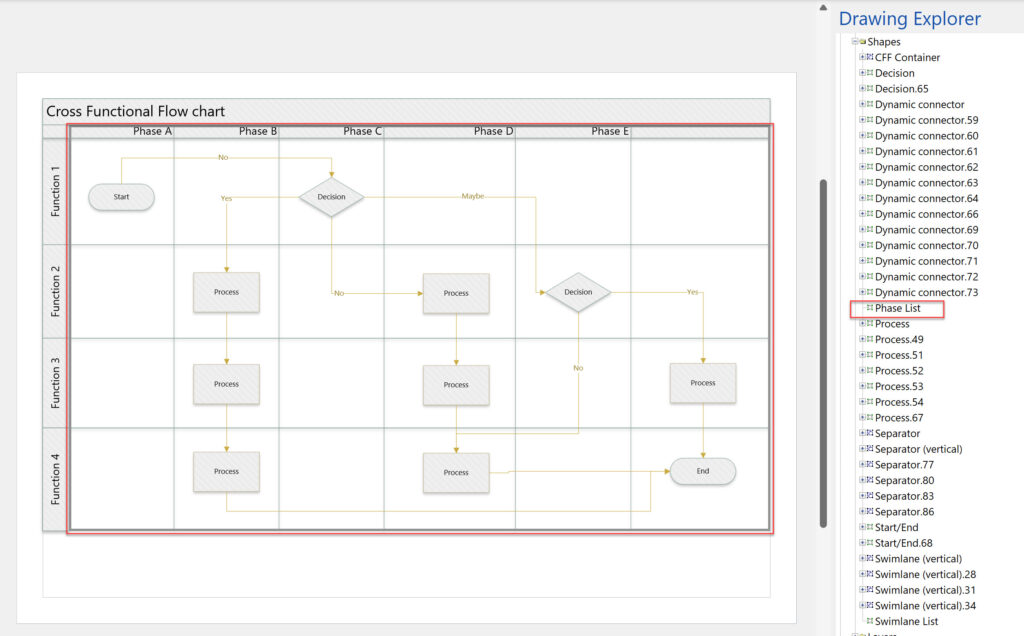
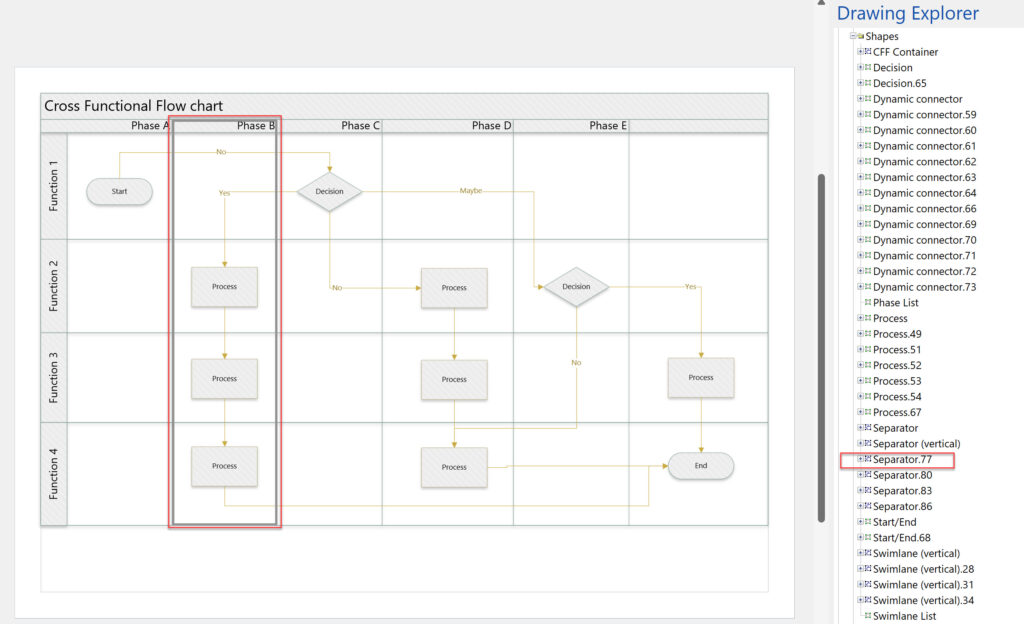
I use Visio Cross-Functional Flowcharts a lot, but there is one thing that really bugs me … you can move function bands\swimlanes around, but you can’t move the phases\separators in the same way. The phases/separators are containers just like the function bands\swimlanes, so why can’t I move them? Actually, it is quite understandable when you realise what is actually going on … both are contained within the Cross-Functional Flowchart (CFF) shape, but there are list containers between each band and the parent CFF shape.
[Read more…] about Moving Phases/Separators in Visio Cross-Functional Flowcharts?Adding a second Function header bar to Visio swimlanes
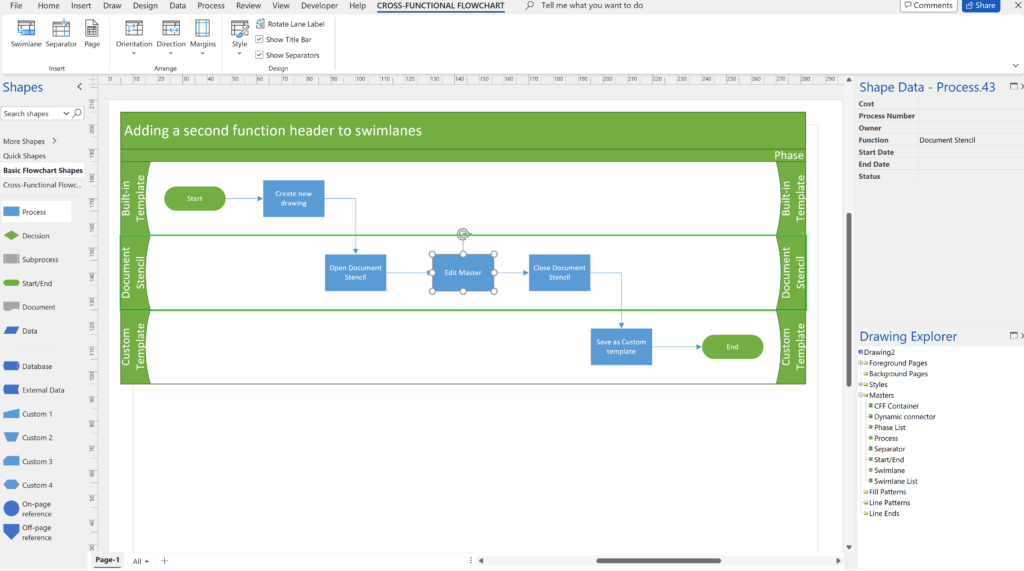
I was recently asked if a second function header bar can be added to the swimlanes in the cross-functional flowchart templates in Visio. Some swimlanes can get quite wide, so it can be useful to have a duplicate function header shape on the far-side too. It is quite simple to duplicate the existing function header sub-shape and then change its position to the opposite side of the swimlane.
[Read more…] about Adding a second Function header bar to Visio swimlanesMy new book on Visualizing Processes with Microsoft Visio has launched
Back in the early 1990s, there was an application called ABC Flowcharter that was the market leader for diagramming business flowcharts, but some of the brains behind Aldus PageMaker saw an opportunity to create something smarter, and left to write the Visio product, with the stated aim to overtake ABC Flowcharter within 2 years. They did it in just 18 months and Visio expanded to cover more types of diagramming, especially organization charts and network diagramming. Visio became the default vector-based, data-diagramming application for the desktop, and so Microsoft acquired the company in 2000, who started to integrate it with Microsoft Office applications. Many imitators on the desktop tried to emulate Visio, but most fell by the wayside. There were constant requests for Visio to work on Apple Macs, but Microsoft resisted making a Mac specific version, and instead started to make Visio work in a web-browser, so it can work anywhere on any modern device. There are literally millions of lines of code on Visio, so it was never going to be straightforward or easy, but now we do have a light edition of Visio provided to all M365 business subscribers, and two extra subscription levels for more features and capabilities. We still have desktop Visio Standard and Professional, but the edition that straddles both the desktop and web is Visio Plan 2. It has some desktop only features delivered via web-services, and an enhanced browser-based editing experience. Visio Plan 2 is the edition for heavy or advanced users, but any of the desktop editions can be viewed as a design studio for content that can be used by the browser users because of Visio’s unique ShapeSheet feature that contains Excel-like formulas to control the properties of the shapes. Almost all of these formulas work in the web browser, but desktop Visio is required to write the formulas initially. This means that powerful customizations are possible without any web-scripting, and achievable by anyone who can write formulas in Excel!
So, this new book focuses on the original driver for Visio, process flowcharts, and explains how the different Visio editions can be used to create, edit, collaborate, comment, present, automate, export them, and finally how to customize them. Find out more at Visualize Complex Processes with Microsoft Visio!
[Read more…] about My new book on Visualizing Processes with Microsoft Visio has launchedInteractive Demographics of the European Union in Visio
I was recently contacted by a reader, Stanley M. Max (Towson University lecturer), who had started creating a Visio map of the 27 countries in the European Union in 2020, along with the demographics culled from Wikipedia. He wanted to know if the map and stats could be combined to make a more appealing presentation. Well, that prompted me to not only combine the data and country shapes, but to explore ways in which a presentation of the map can be made more interesting in Visio. So, I added data and hyperlinks to the shapes, and set up a page property for the selected country which automatically highlights the country shape, statistics, and header, to which I added flags. So, the user can either set the page country using the Shape Data window for the page, or context menu of each country, or simply by double-clicking.
[Read more…] about Interactive Demographics of the European Union in Visio