• Skip to main content
  • Skip to primary sidebar
  • Skip to footer

bVisual

  • Home
  • Services
    • How Visio smartness can help your business
    • Visio visual in Power BI
    • Visio Consulting Services
    • Visio Bureau Services
    • Visio Training and Support Services
  • Products
    • Visio Shape Report Converter
    • SS Plus
    • LayerManager
    • visViewer
    • Metro Icons
    • Rules Tools for Visio
    • The Visio 2010 Sessions App
    • Multi-Language Text for Visio
    • Document Imager for Visio
    • multiSelect for Visio
    • pdSelect for Visio
  • Case Studies
    • Case studies overview
    • Using Visio in Education for GIS
    • Visualizing Construction Project Schedules
    • Visio Online Business Process Mapping
    • Nexans Visio Template
    • CNEE Projects, WorldCom
    • Chase Manhattan Bank
  • News
    • Recent news
    • News archive
  • Resources
    • Articles➡
      • ShapeSheet Functions A-Z
      • Comparing Visio for the Web and Desktop
      • Customising Visio Shapes for the Web App
      • Key differences between the Visio desktop and web apps
      • Using the Visio Data Visualizer in Excel
      • Using Visio in Teams
      • Creating Visio Tabs and Apps for Teams with SharePoint Framework (SPFx)
      • Designing Power Automate Flows with Microsoft Visio
      • Innovative uses of Visio Lists
    • Webcasts ➡
      • Visio in Organizations
      • My session and other Visio sessions at MSIgnite 2019
      • Power up your Visio diagrams
      • Vision up your Visio diagrams
      • The Visio 2010 MVP Sessions
    • Visio Web Learning Resources
    • Books➡
      • Visualize Complex Processes with Microsoft Visio
      • Mastering Data Visualization with Microsoft Visio
      • Microsoft Visio Business Process Diagramming and Validation
      • Visualizing Information with Microsoft Visio
  • Blog
    • Browse blog articles
    • Visio Power BI articles
    • Visio for Web articles
    • A history of messaging and encryption
  • About us
    • About bVisual
    • Testimonials
    • Bio of David Parker
    • Contact Us
    • Website Privacy Policy
    • Website terms and conditions
    • Ariba Network

Visio Plan 2

Published on October 7, 2024 by David Parker

How to migrate from Lucidchart to Visio

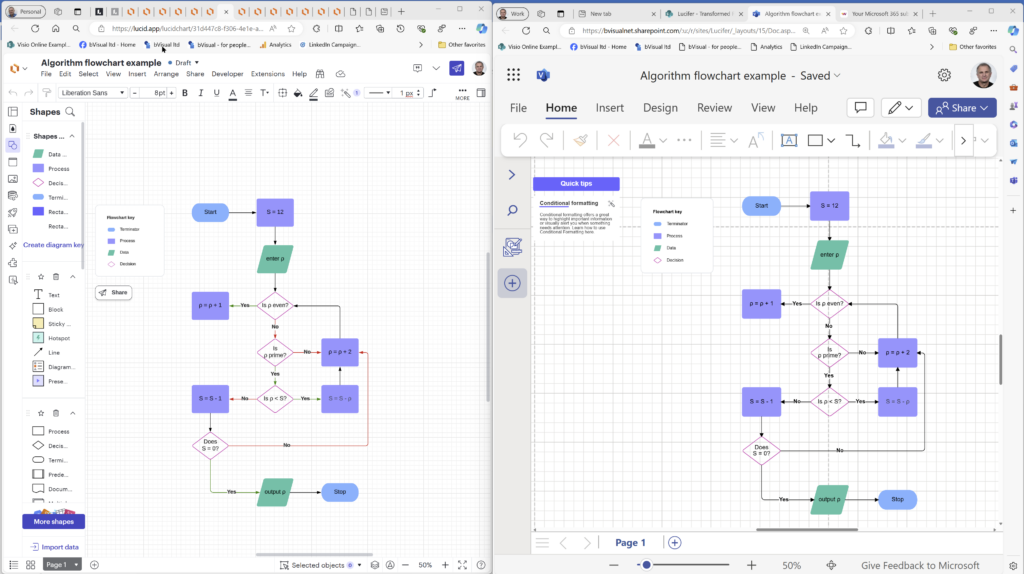
I am pleased to announce that I will be presenting a webinar on Thursday 10th October 2024 where I will be demonstrating how to convert many types of diagrams from Lucidchart to Visio, and keep their smartness. Over the 30 years that I have been using and developing solutions with Visio, I have seen many imitators come and go. Lucidchart, however, has carved out a niche over the years because it is available on Macs, whereas Visio only relatively recently became available in the web browser. Now that Microsoft provide a version of Visio as part of Microsoft 365, and more capable web versions for a subscription that is less than the equivalent Lucidchart cost. Moreover, Microsoft Visio Plan 2 has the ever popular Windows desktop edition that has many more features and can be used as a design studio for diagrams to be used in the web editions.

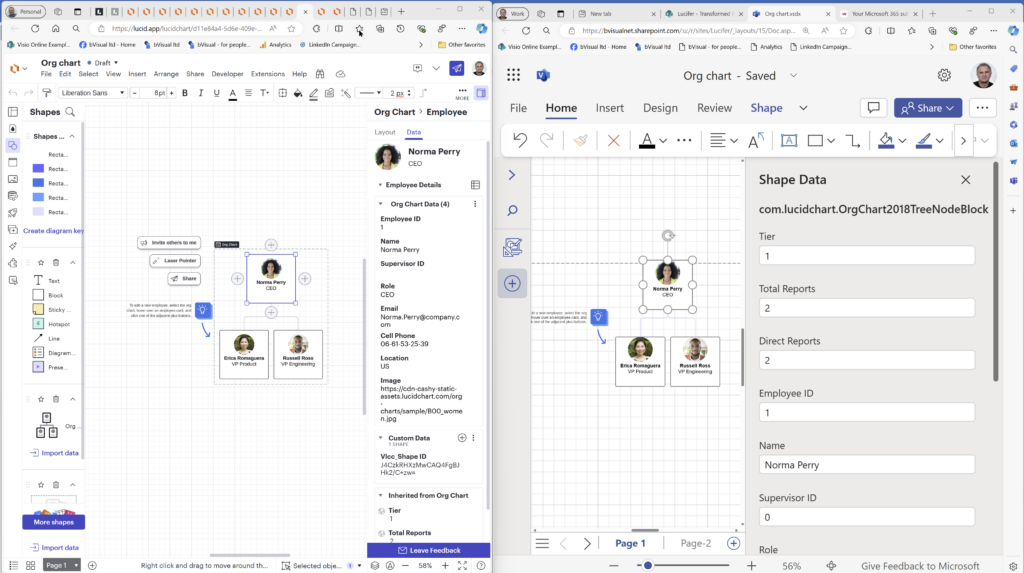
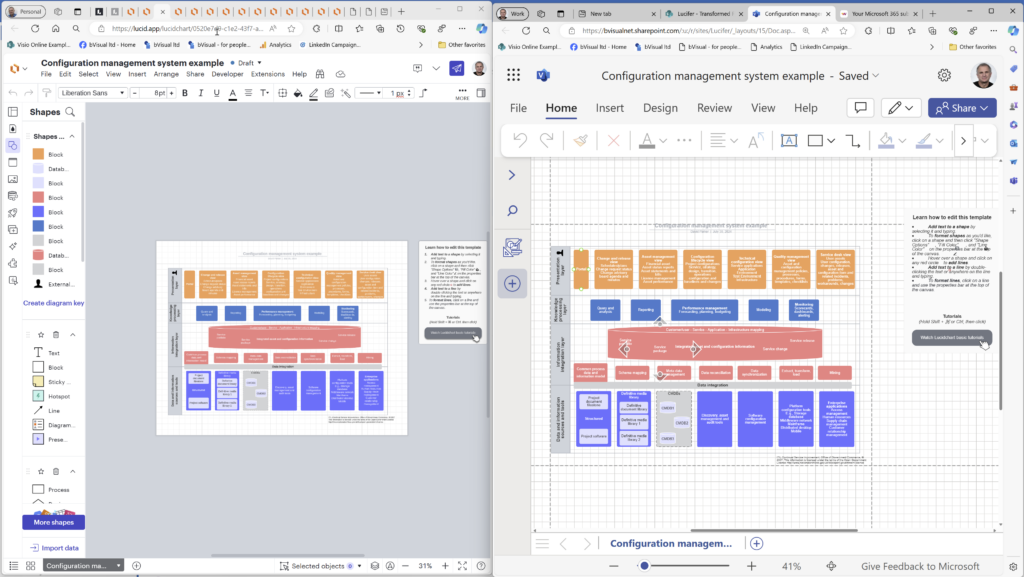
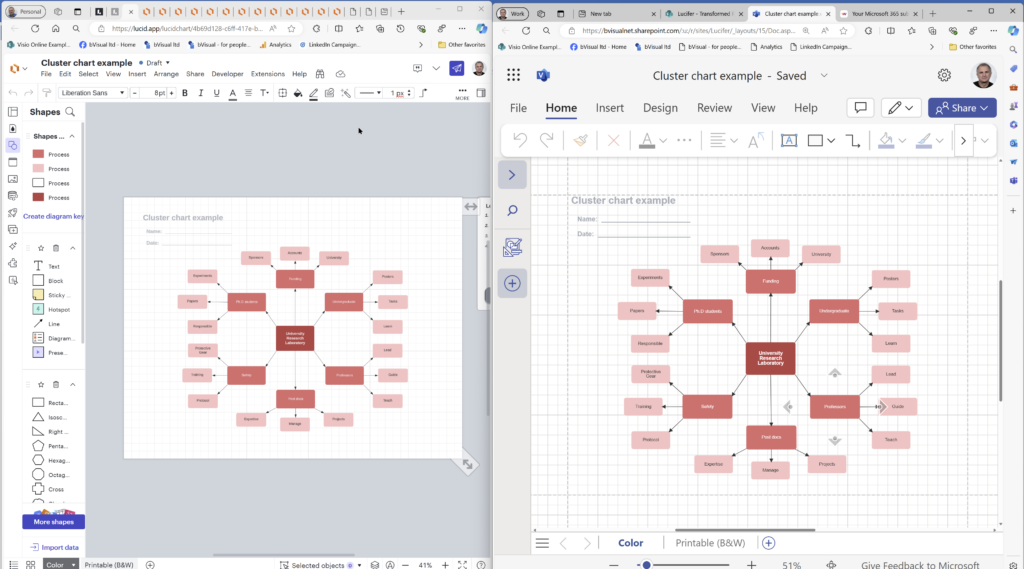
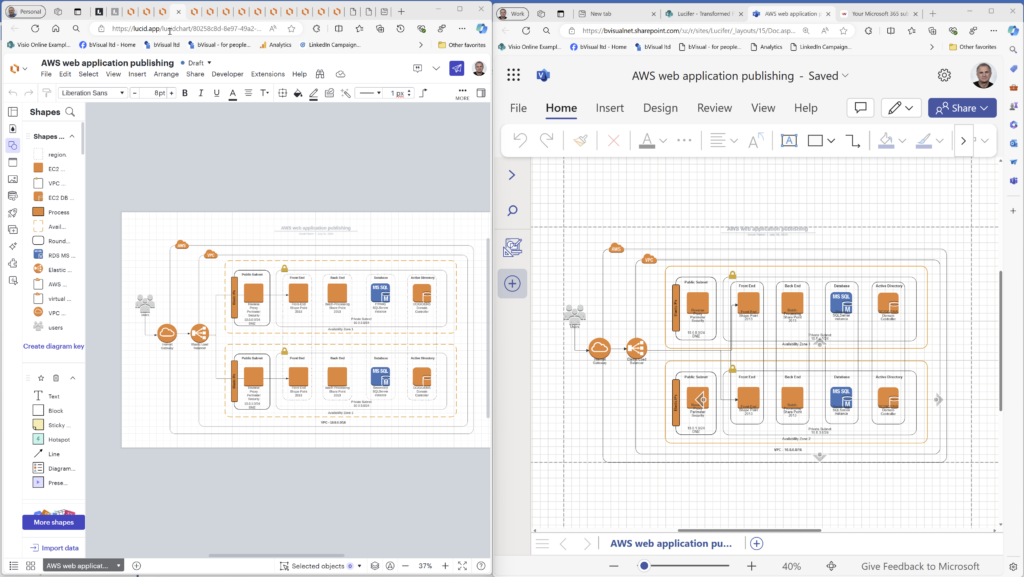
The following examples are conversions from Lucidchart to Visio Plan 1.

  • Org Chart
  • Configuration Management
  • Cluster Chart
  • AWS Web Application
  • Flow Chart
[Read more…] about How to migrate from Lucidchart to Visio

Filed Under: Visio for M365, Visio for Web, Visio Plan 1, Visio Plan 2 Tagged With: Lucidchart, Visio

Published on May 15, 2024 by David Parker

Linking Data to Shapes in Visio after using Data Visualizer

Data Visualizer (DV) in Visio Plan 2 (Data | Create from Data | Create ) is great because it provides a way of automatically creating a diagram from data, but it also prevents some of the other data-linking features in Visio from being used. This is because DV wants to take control of the data in the shapes to provide refreshes from the data source or send updates to the data source. This can be very annoying if you use DV to create the initial layout, then you enhance this, so it looks just perfect, and then you just want to update some of the data without affecting the layout. DV may re-layout your carefully crafted diagram, even if there are no updates to the data that should do that. Also, you may want to integrate data from other sources that were not available or accessible to the table or query used for by Data Visualizer. This is when you may want to use Data | External Data | Custom Import which also provides a much greater number of data source types. In this article, you will learn how you can do this manually, or automate it with the help of a little VBA code (or similar).

In this example, I have used table of personnel that I have used before, but added an extra column, Shape Type, that simply has the value Rectangle, which is simply the name of a simple Master shape that I have added to my macro-enabled stencil, ExDataLinker.vssm.

  • tblOrgData for the structure
  • DV Step 1
  • DV Step 2
  • DV Step 3
  • DV Step 4
  • DV Basic Layout
  • DV Re-layed out with Data Graphics
[Read more…] about Linking Data to Shapes in Visio after using Data Visualizer

Filed Under: Data Visualizer, External Data, VBA, Visio for Desktop, Visio Plan 2 Tagged With: Data Visualizer, External Data, VBA, Visio

Published on June 6, 2023 by David Parker

Navigate to named areas in Visio with SS Plus

Many years ago, when I was an architect, I used a Unix CAD system with large buildings. I was able to navigate quickly to rectangular areas that I had named. Well, the Export to PowerPoint feature in Visio Plan 2 provides Slide Snippets, which are named areas that can be exported to PowerPoint. My SS Plus add-in already provides enhancements to this feature that provides formatted text and hyperlinks to be exported too, but I was missing a trick. So, now I have added in a dynamic sub-menu that provides quick navigation to these named Slide Snippet areas and can optionally integrate with LayerManager to apply a named LayerSet too!

I have made a short video to demonstrate this:

[Read more…] about Navigate to named areas in Visio with SS Plus

Filed Under: LayerManager, PowerPoint, Slide Snippets, SS Plus, Visio Plan 2 Tagged With: LayerManager, PowerPoint, SS Plus, Visio

Published on May 15, 2023 by David Parker

My new book on Visualizing Processes with Microsoft Visio has launched

Back in the early 1990s, there was an application called ABC Flowcharter that was the market leader for diagramming business flowcharts, but some of the brains behind Aldus PageMaker saw an opportunity to create something smarter, and left to write the Visio product, with the stated aim to overtake ABC Flowcharter within 2 years. They did it in just 18 months and Visio expanded to cover more types of diagramming, especially organization charts and network diagramming. Visio became the default vector-based, data-diagramming application for the desktop, and so Microsoft acquired the company in 2000, who started to integrate it with Microsoft Office applications. Many imitators on the desktop tried to emulate Visio, but most fell by the wayside. There were constant requests for Visio to work on Apple Macs, but Microsoft resisted making a Mac specific version, and instead started to make Visio work in a web-browser, so it can work anywhere on any modern device. There are literally millions of lines of code on Visio, so it was never going to be straightforward or easy, but now we do have a light edition of Visio provided to all M365 business subscribers, and two extra subscription levels for more features and capabilities. We still have desktop Visio Standard and Professional, but the edition that straddles both the desktop and web is Visio Plan 2. It has some desktop only features delivered via web-services, and an enhanced browser-based editing experience. Visio Plan 2 is the edition for heavy or advanced users, but any of the desktop editions can be viewed as a design studio for content that can be used by the browser users because of Visio’s unique ShapeSheet feature that contains Excel-like formulas to control the properties of the shapes. Almost all of these formulas work in the web browser, but desktop Visio is required to write the formulas initially. This means that powerful customizations are possible without any web-scripting, and achievable by anyone who can write formulas in Excel!

So, this new book focuses on the original driver for Visio, process flowcharts, and explains how the different Visio editions can be used to create, edit, collaborate, comment, present, automate, export them, and finally how to customize them. Find out more at Visualize Complex Processes with Microsoft Visio!

[Read more…] about My new book on Visualizing Processes with Microsoft Visio has launched

Filed Under: Books, Data Visualizer, Ebooks, Process Flows, ShapeSheet Formulas, Visio, Visio for Desktop, Visio for M365, Visio for Web, Visio Plan 1, Visio Plan 2 Tagged With: My Books, Processes, Visio

Published on April 9, 2023 by David Parker

Understanding Visio Data Graphic’s Color by Value

The desktop Visio editions, Visio Professional and Visio Plan 2, have a great way of automatically displaying data as Data Bars, Icon Sets, Text Callouts and Color by Value. The first three types of Data Graphics require sub-shapes to be inserted into each shape that they are applied to, but the last one, Color by Value (CBV), merely requires some User-defined Cells and formulas. However, unlike the first three, there can be only one Shape Data value displayed as colours in each Data Graphic (DG). So, how can we easily update the colour assigned to each value using code, rather than manually using the manual dialogs provided?

  • One Data Graphic with 4 CBVs
  • The first in the list is applied
  • Numeric data can have two types of CBV
  • Locating the Data Graphic master
[Read more…] about Understanding Visio Data Graphic’s Color by Value

Filed Under: Data Graphics, ShapeSheet Formulas, Visio for Desktop, Visio Plan 2 Tagged With: Data Graphics, ShapeSheet, Visio

Published on January 9, 2023 by David Parker

Pushing Data Visualizer in Visio beyond its limits

My last post was about some of the lessons learnt when trying to push Data Visualizer to its limits, but this one has some ways of overcoming these limitations. The main lesson learnt is that DV binds the shapes within the DV container shape, CFF Data Visualizer, and controls some of the ShapeSheet cells that are normally available for customization. The label of the connector is bound to the respective column in the Excel table, and that, combined with the ability to modify the Dynamic connector master shape provides a way of overcoming some of the limitations discovered.

So, given that we want to use DV, and we need to have multiple flows between the same shapes, then they cannot be separate connectors. We need to combine multiple flows onto the same connector, and then find a way to selectively display different flows somehow by controlling the visibility of the connectors. However, we cannot make them invisible because they will be deleted by DV, so we need to control their transparency instead. We can do this by interpreting the label somehow, and we are going to modify the Dynamic connector to react to the text of the label, and we can also change the colour and line pattern too.

The following screenshots show the Excel table with the multiple flows between the same shapes concatenated with pipe characters, and the diagram created by Data Visualizer when this table is imported into a custom template using Data \ Create from Data \ Create:

[Read more…] about Pushing Data Visualizer in Visio beyond its limits

Filed Under: Connectors, Data Visualizer, Shape Data, Shape Reports, ShapeSheet Formulas, Uncategorized, Visio Plan 2 Tagged With: Connectors, Data Visualizer, ShapeSheet Functions

  • Page 1
  • Page 2
  • Page 3
  • Go to Next Page »

Primary Sidebar

  • LinkedIn
  • Twitter

Recent Posts

  • Co-authoring and Commenting with Visio Documents
  • Fixing dimensions of 2D shapes
  • Merging Linked Data from Similar Tables
  • Smart Radio Buttons and Check Boxes in Visio
  • Using Button Face Ids in Visio

Categories

Tags

Accessibility Add-Ins Connectors Containers Data Export Data Graphics Data Import Data Visualizer Educational Excel GraphDatabase Hyperlinks Icon Sets JavaScript LayerManager Layers Legend Link Data to Shapes Lists MSIgnite MVP Office365 Org Chart PowerApps PowerBI PowerQuery Processes Setup and Deployment Shape Data Shape Design ShapeSheet ShapeSheet Functions SharePoint 2013 SQL Teams Validation VBA Video Visio Visio 2007 Visio for the Web Visio Online Visio Services Visio Viewer Webinar

Footer

bVisual Profile

The UK-based independent Visio consultancy with a worldwide reach. We have over 25 years experience of providing data visualization solutions to companies around the globe.

Learn more about bVisual

  • Amazon
  • E-mail
  • Facebook
  • LinkedIn
  • Twitter
  • YouTube

Search this website

Recent posts

  • Co-authoring and Commenting with Visio Documents
  • Fixing dimensions of 2D shapes
  • Merging Linked Data from Similar Tables
  • Smart Radio Buttons and Check Boxes in Visio
  • Using Button Face Ids in Visio

Copyright © 2025 · Executive Pro on Genesis Framework · WordPress · Log in