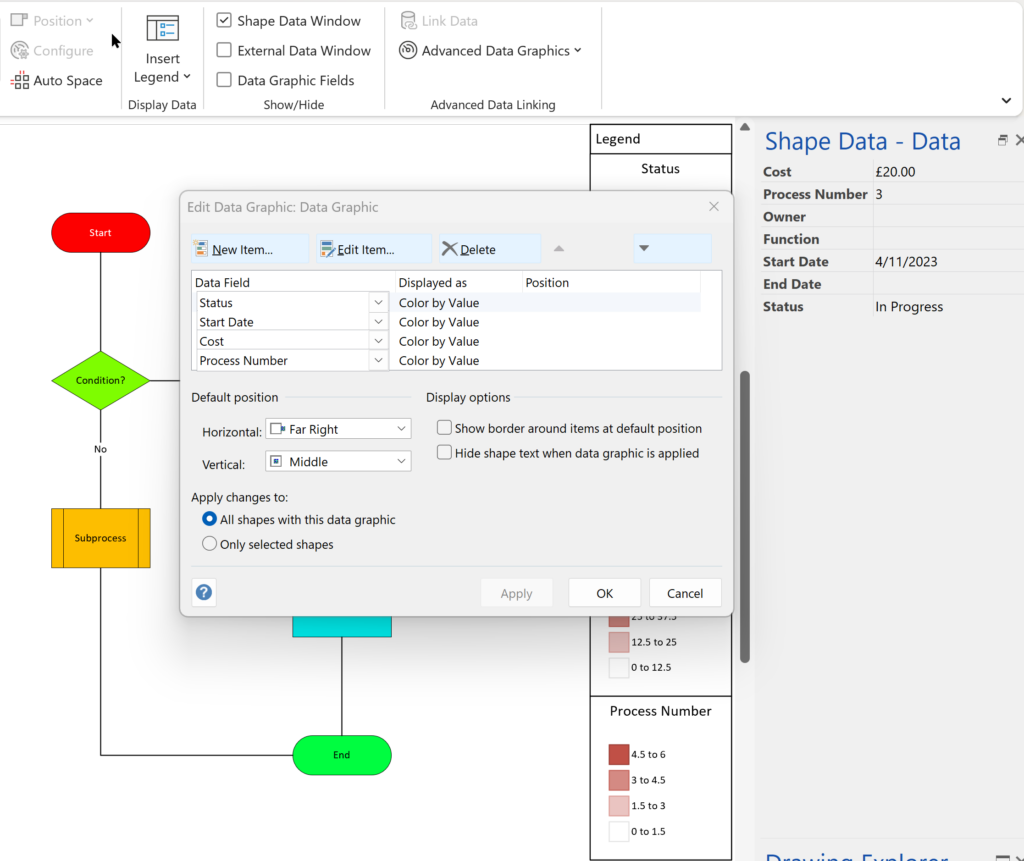
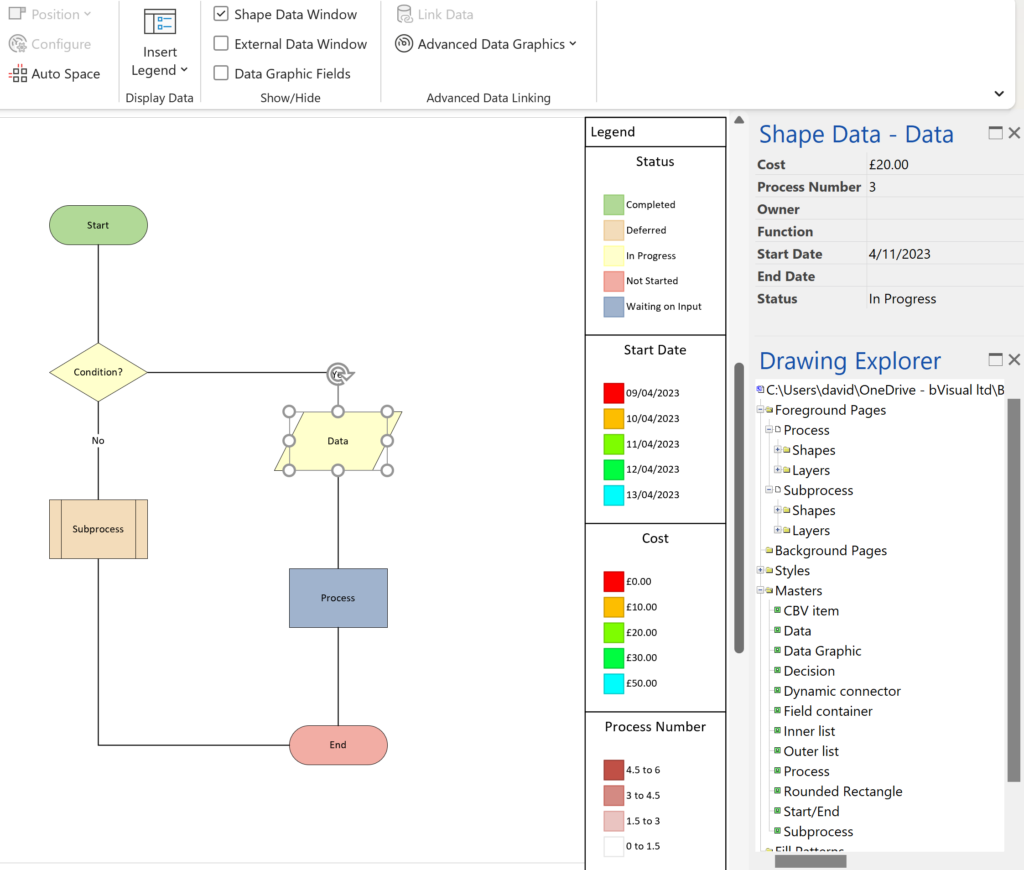
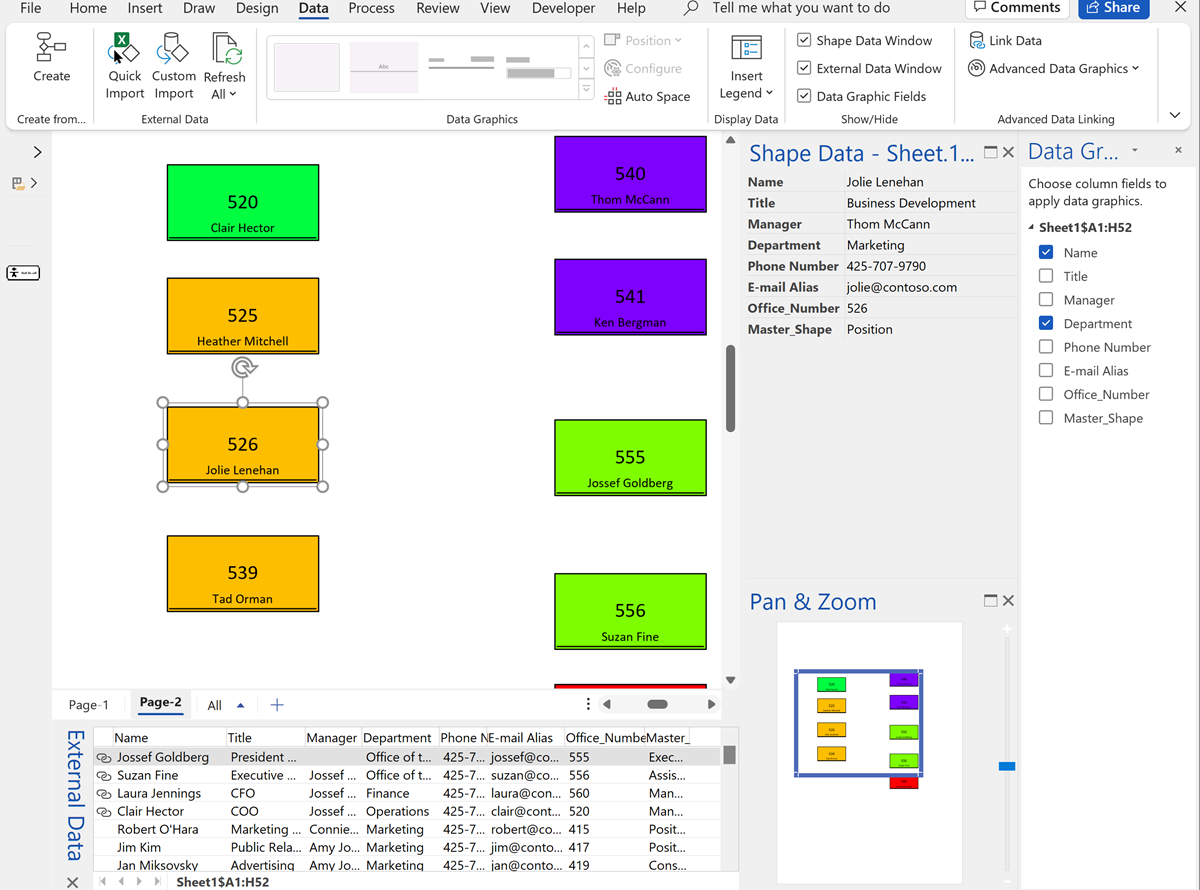
The desktop Visio editions, Visio Professional and Visio Plan 2, have a great way of automatically displaying data as Data Bars, Icon Sets, Text Callouts and Color by Value. The first three types of Data Graphics require sub-shapes to be inserted into each shape that they are applied to, but the last one, Color by Value (CBV), merely requires some User-defined Cells and formulas. However, unlike the first three, there can be only one Shape Data value displayed as colours in each Data Graphic (DG). So, how can we easily update the colour assigned to each value using code, rather than manually using the manual dialogs provided?
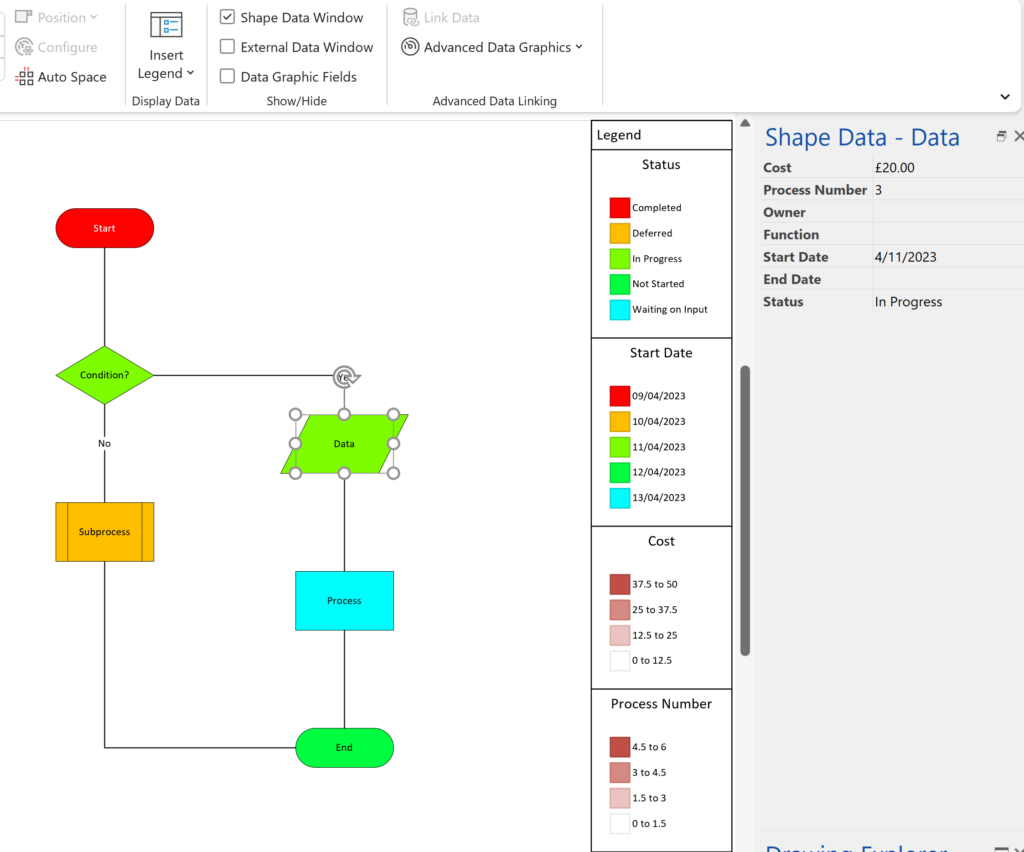
In the above screenshots, there is only one CBV visible in the shapes that have the DG applied to, but the inserted legend shows that there are actually four different CBVs defined in the DG itself.
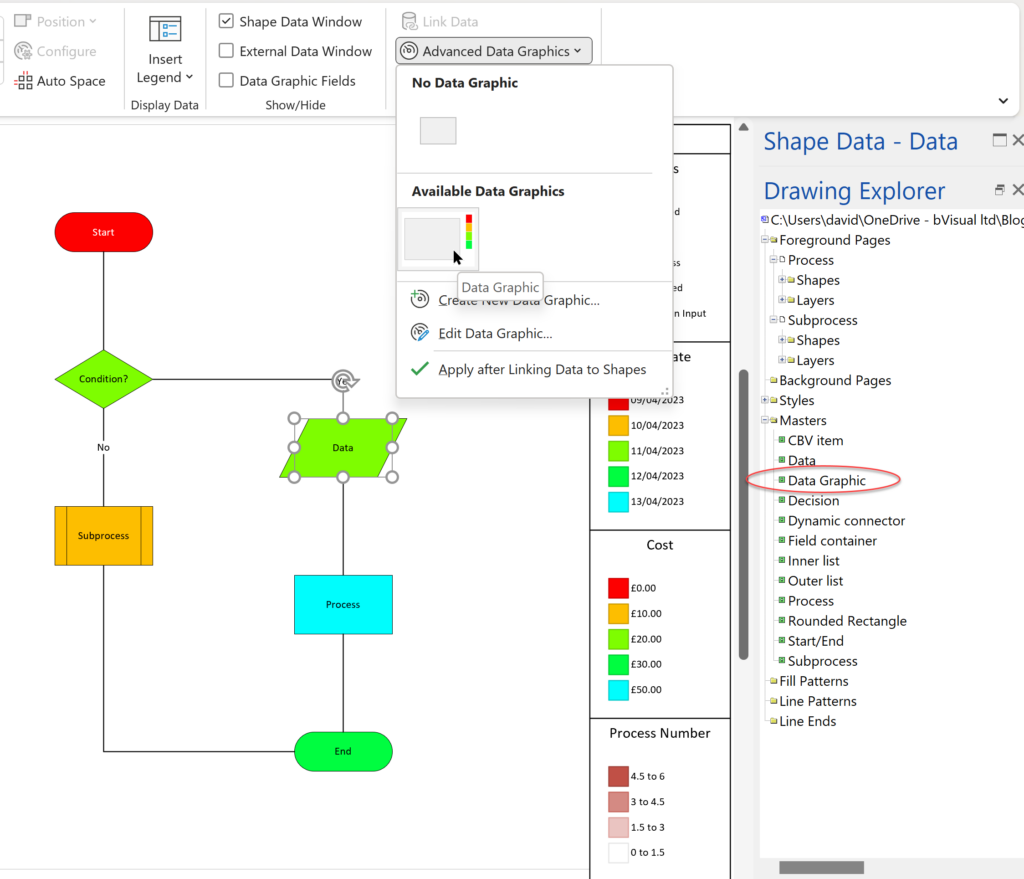
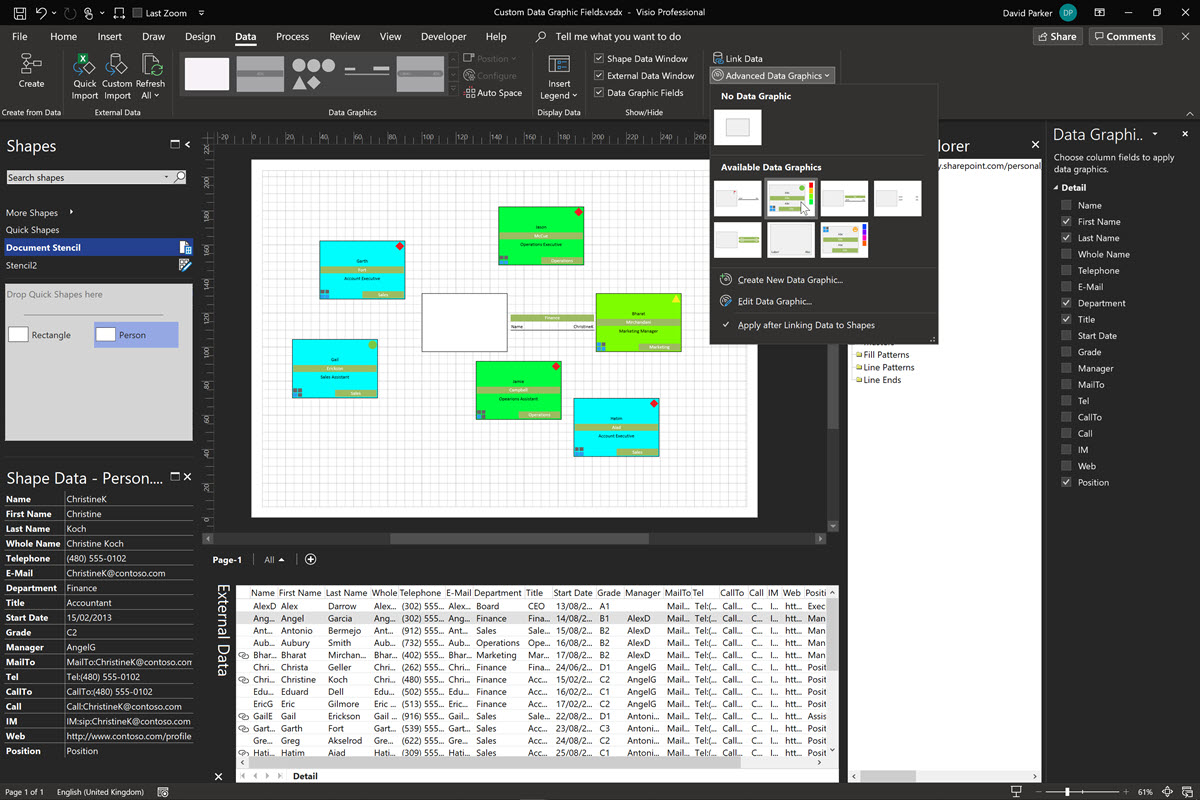
The definitions are stored in the User-defined Cells section of the DG master. This master is not visible in the Document Stencil, so it has to be edited from the Drawing Explorer window. If we open the ShapeSheet of the master shape, we can see all four of the definitions are held in User-defined Cells with names that start with visDGColorItem. It is the last one in the list that actually gets applied to the shapes in the page. If we look at the formulas for each of these rows then we can clearly see how the specification is defined.
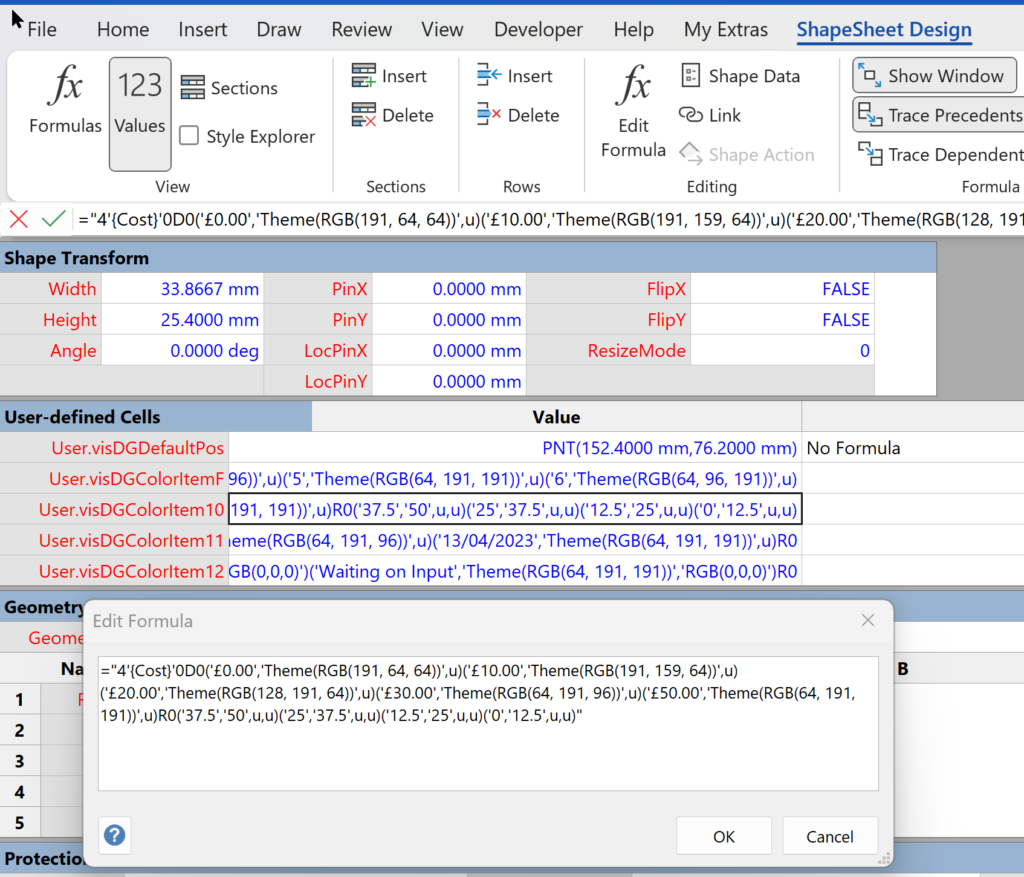
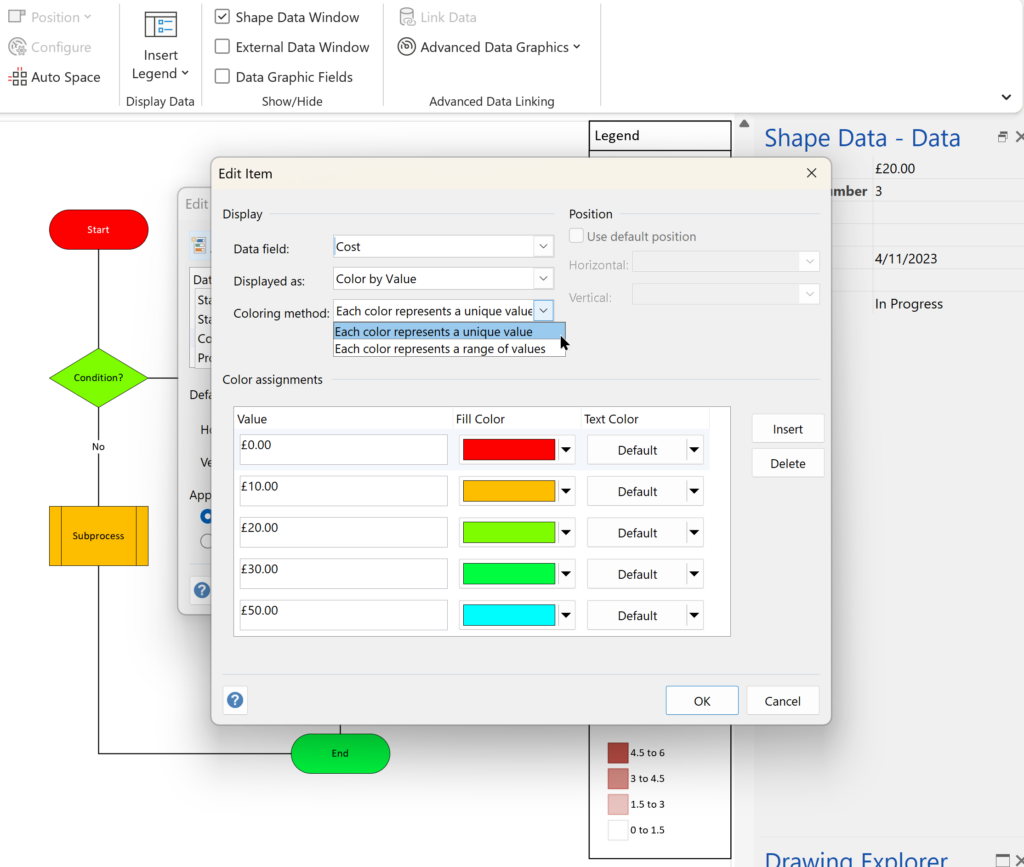
We can make the formula easier to understand by copying it into Notepad [Edit: or even Notepad++] and inserting some line return characters. We do not have to remove these characters when we edit the formula and paste it back into the Edit Formula dialog. The following formula is for the Shape Data row with the label Cost, and it holds the definitions for the Distinct values (starting with D0) and Range values (starting with R0):
="4'{Cost}'0
D0
('£0.00','Theme(RGB(191, 64, 64))',u)
('£10.00','Theme(RGB(191, 159, 64))',u)
('£20.00','Theme(RGB(128, 191, 64))',u)
('£30.00','Theme(RGB(64, 191, 96))',u)
('£50.00','Theme(RGB(64, 191, 191))',u)
R0
('37.5','50',u,u)
('25','37.5',u,u)
('12.5','25',u,u)
('0','12.5',u,u)"
I am not sure what the number 4 before the label is for, it does not seem to make a difference if changed. The 0 after the label means that it is numeric because non-numeric have an A for alphabetic.
The first set of colour definitions in the formula is the currently active one set. Each row of the Distinct set is a comma-separated list between brackets of the match value, the fill colour and font colour. A u character is used to specify undefined, so a default value is used.
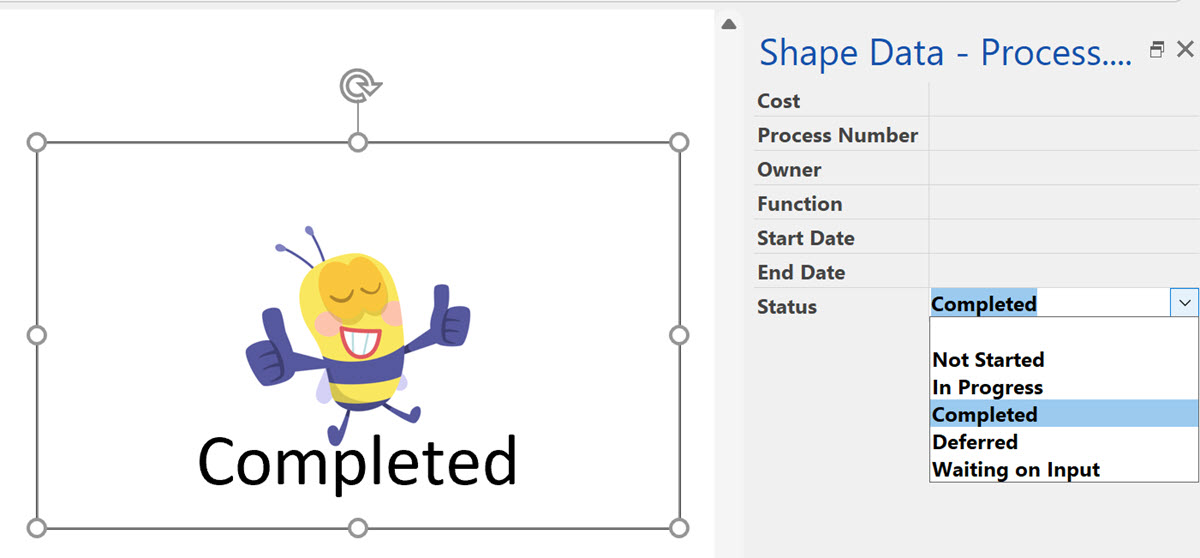
If we look at a formula for a non-numeric Shape Data row, then there is only one set of definitions for the Distinct (D0) values.
="1'{Status}'A
D0
('Completed','Theme(RGB(191, 64, 64))','RGB(255,255,255)')('Deferred','Theme(RGB(191, 159, 64))','RGB(0,0,0)')
('In Progress','Theme(RGB(128, 191, 64))','RGB(0,0,0)')
('Not Started','Theme(RGB(64, 191, 96))','RGB(0,0,0)')
('Waiting on Input','Theme(RGB(64, 191, 191))','RGB(0,0,0)')
R0"
Knowing how these definitions are specified makes it possible for us to use code to import our own pre-defined definitions for CBV, and to change which specification is active. For example, this following formula defines better colours for the Status values:
="1'{Status}'A
D0
('Completed','RGB(177,217,151)','RGB(0,0,0)')
('Deferred','RGB(243,220,186)','RGB(0,0,0)')
('In Progress','RGB(255,255,204)','RGB(0,0,0)')
('Not Started','RGB(242,173,164)','RGB(0,0,0)')
('Waiting on Input','RGB(160,179,205)','RGB(0,0,0)')
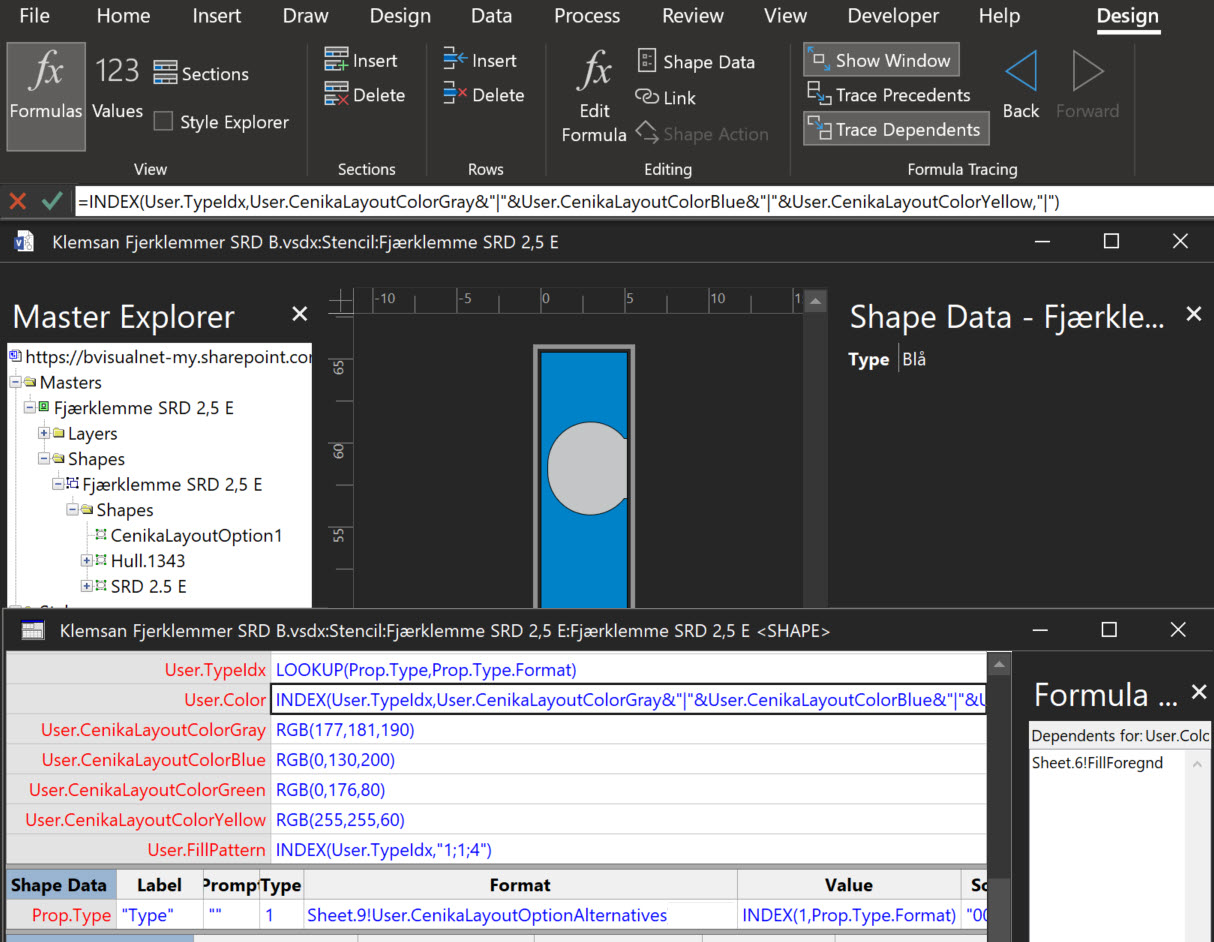
R0"When this is pasted into the last of the visDGColorItem rows of the ShapeSheet in the Data Graphic master shape, to replace the current definitions, then the result is:
Much better than the default colours! It is a pity that the Legend shape does not get automatically updated, and had to be manually replaced.
Related
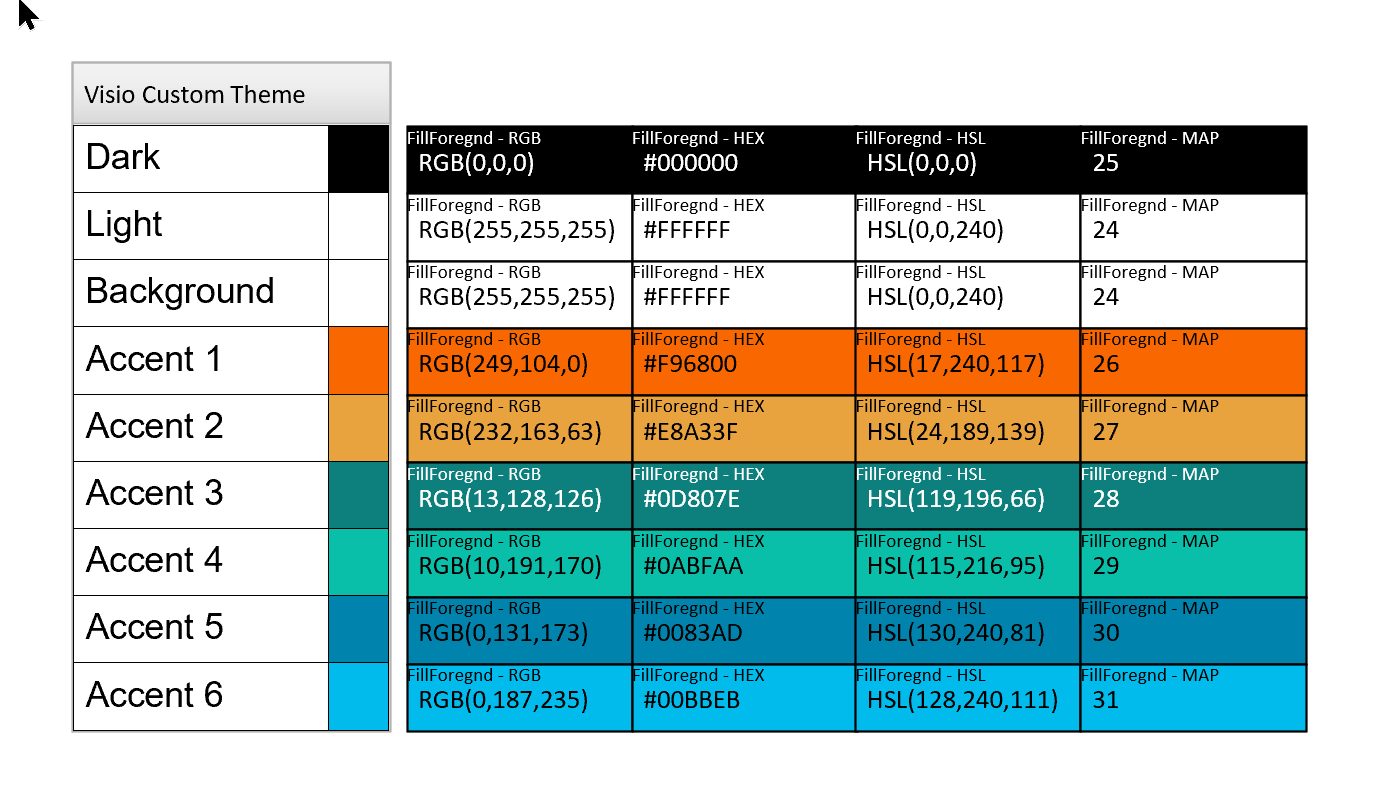
Custom Color Themes in Visio?
I was recently looking into custom color themes for corporate branding in desktop Microsoft Visio and became re-aware how different Visio still is from the rest of the Microsoft Office applications. A Visio page or document does not need to have any theme applied, but the documents of the other Office applications always have a…
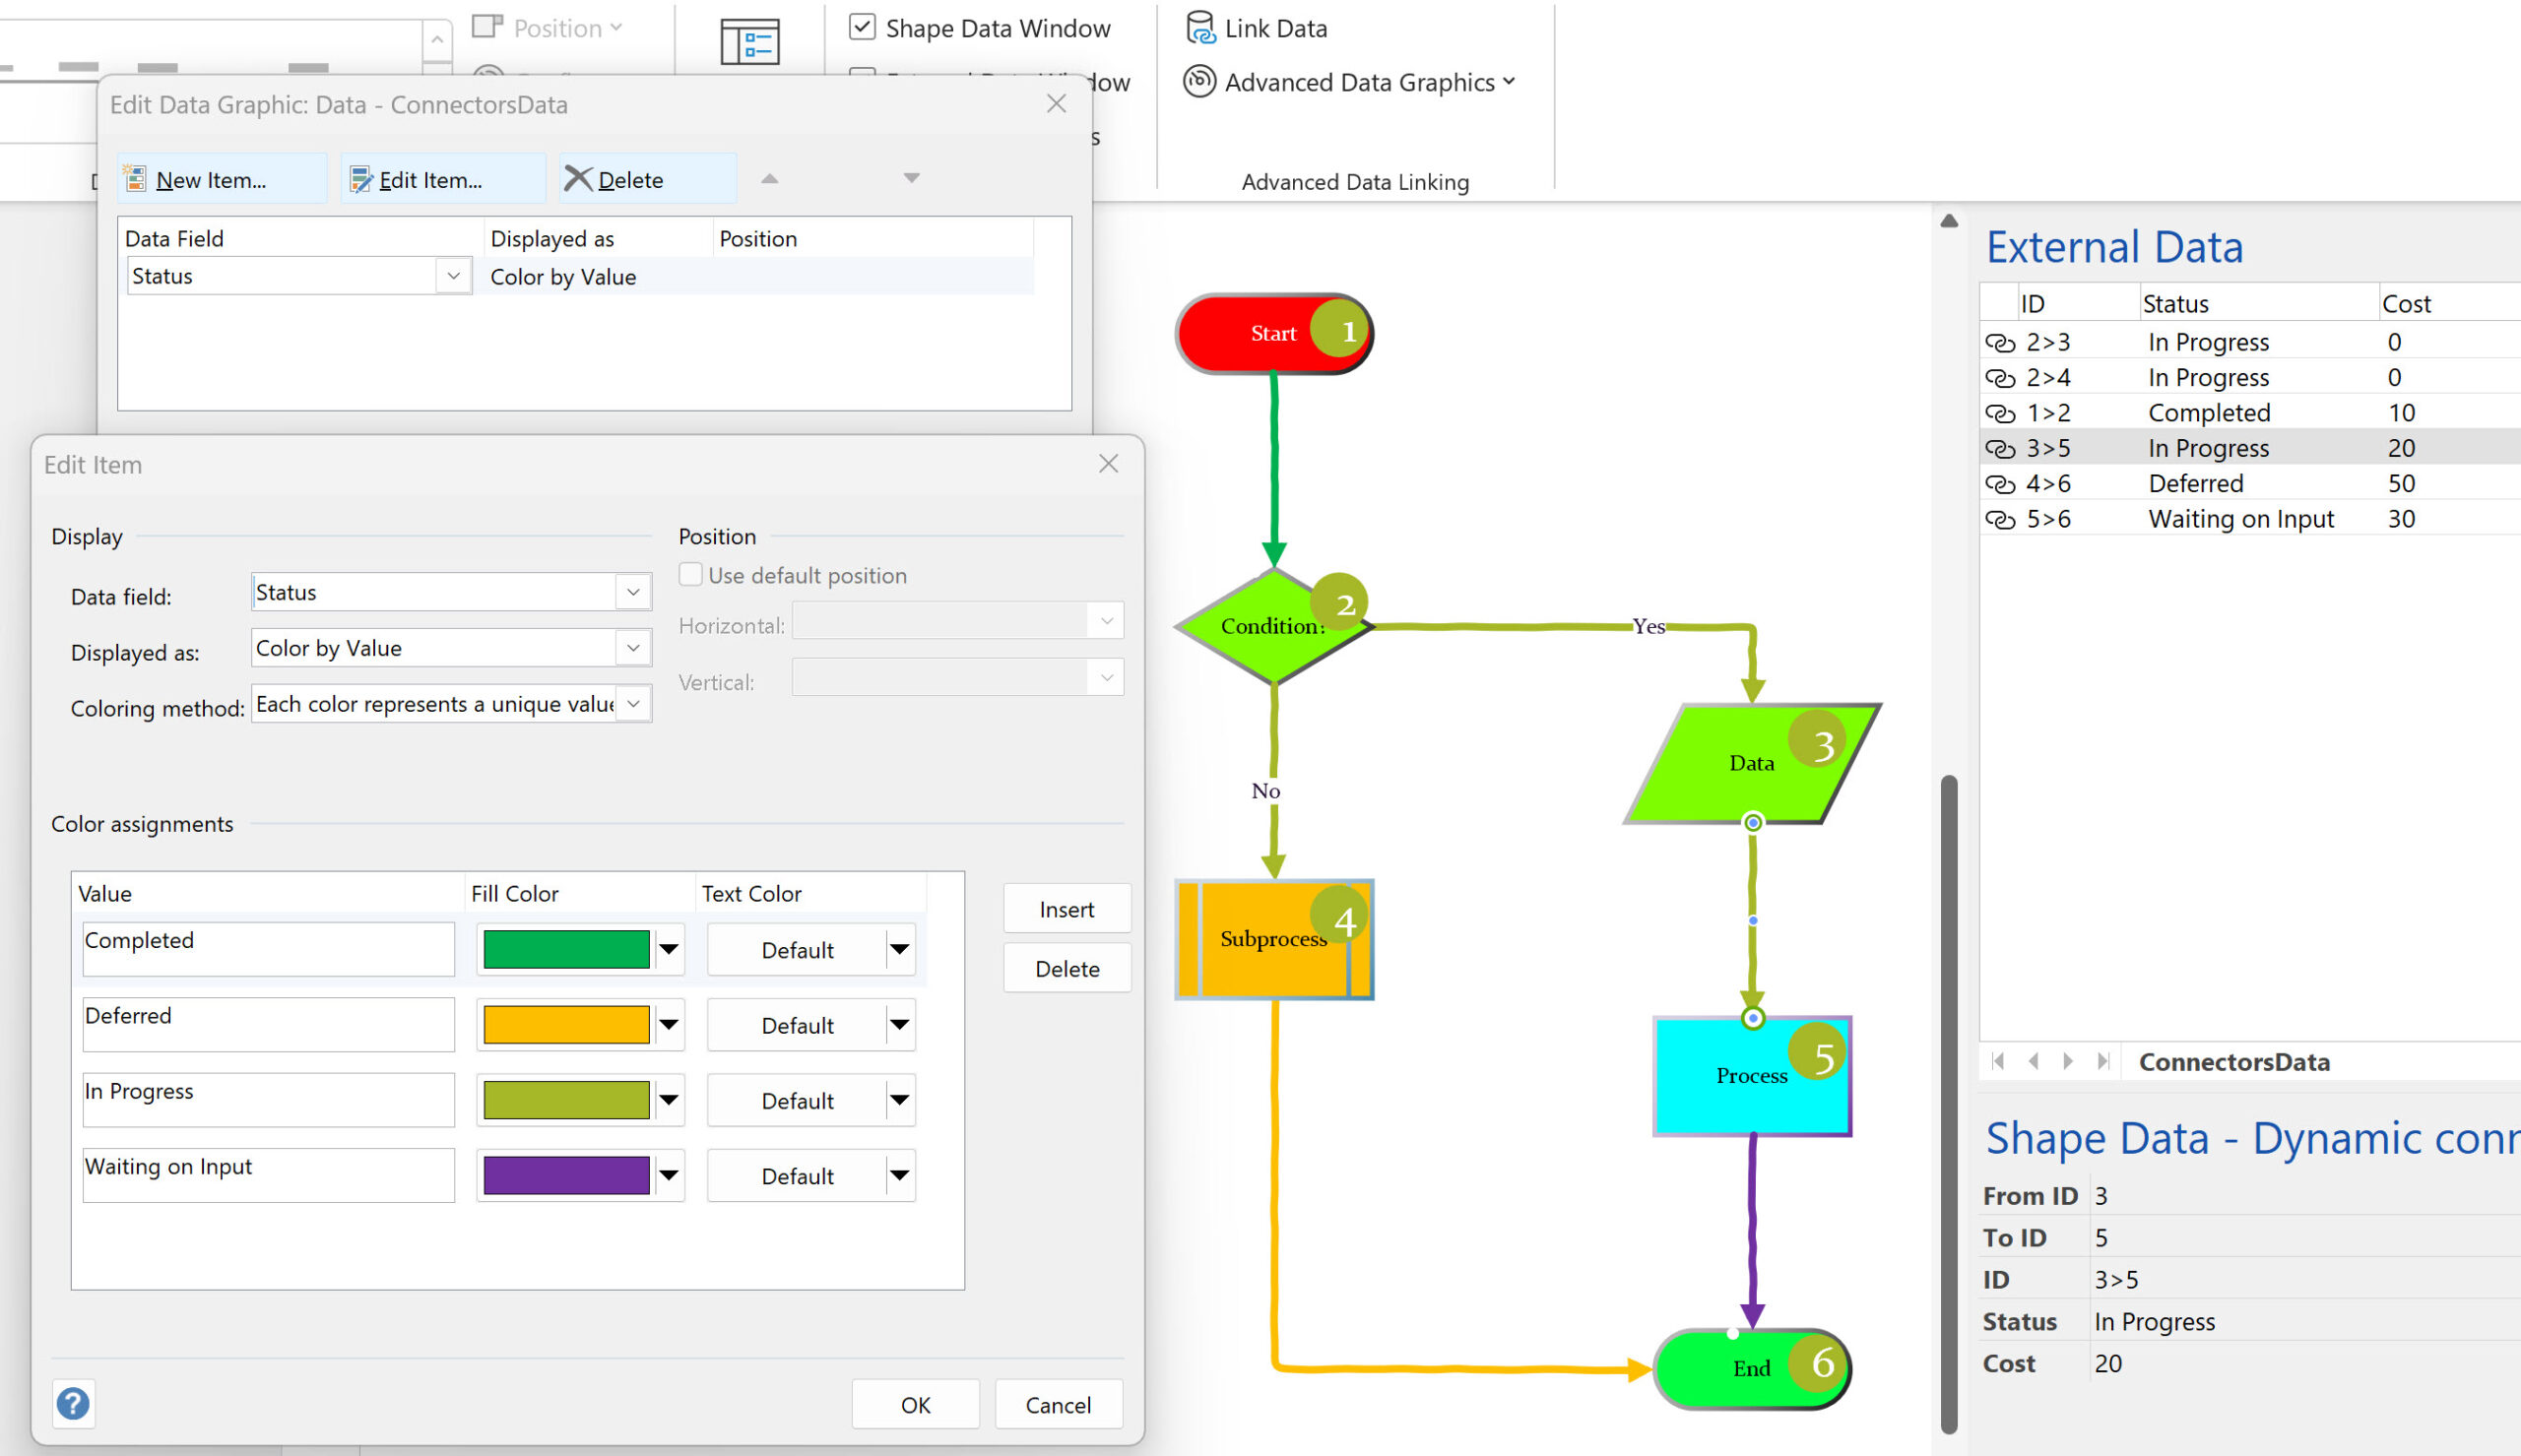
Using Visio Color by Value on Connectors
Data Graphics in Visio Plan 2 and Visio Professional is great, but it only enables us to use them with 2D shapes in Visio, i.e. not on connectors. So, what if you want to change the line colour of the connectors between the 2D shapes because of the data flowing between them? Well, it is…
Linking Data to Visio Shapes in Code
One of the most useful capabilities of Visio Professional and Visio Plan 2 is to link external data to shapes and have them refreshed by changes in the data source. So, many of my solutions involve writing code to make these links, and they are covered with some VBA examples in my book, Mastering Data…
Keeping Visio Data Graphic Items Level
My good friend Scott Helmers, Visio author and trainer, of Harvard Computing Group , recently asked for some help in keeping data graphic items level when their target shape is rotated. Fortunately, I was able to assist, so I thought I would explain how this can be done, and also update my Icon Maker macro…
Duplicating Visio Data Graphics
I was recently asked about switching between different Visio Data Graphics within a page, so I thought I should record a few short videos to explain how Visio Data Graphics work, how they can be edited and duplicated, and how to automate switching between them. (more…)
Testing Regional Settings in Visio
There are times that I have been caught out by assuming that everyone speaks “proper” English, like what I do (sic), and forgetting that there are other languages with their own formatting conventions. I think most of the world is bemused at the USA date format where they put the month before the day and…
Leave a Reply
You must be logged in to post a comment.