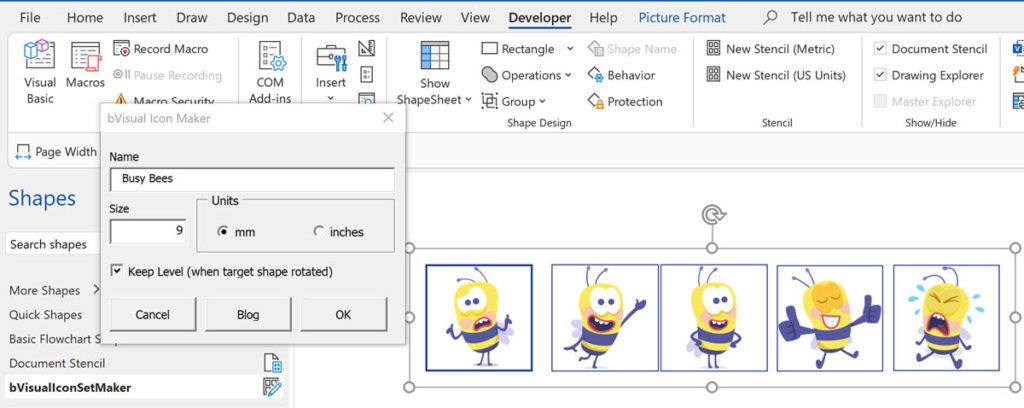
My good friend Scott Helmers, Visio author and trainer, of Harvard Computing Group , recently asked for some help in keeping data graphic items level when their target shape is rotated. Fortunately, I was able to assist, so I thought I would explain how this can be done, and also update my Icon Maker macro from a few years ago. The updated macro is available to download for free and includes the extra ability of sizing the icons. I chose to use some bee stickers from the Insert / Illustrations / Icons tool in Visio Plan 2, and the Status options from the Process shape in the Basic Flowchart Shapes stencil to demonstrate.
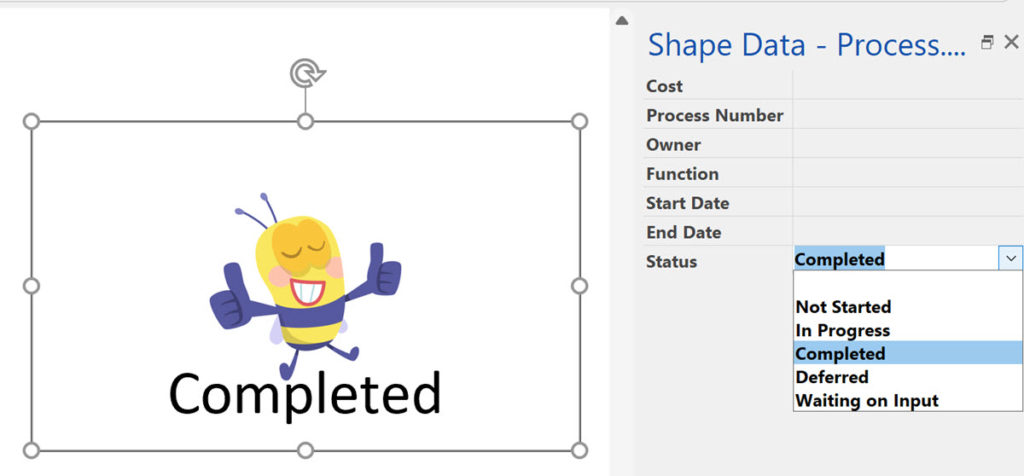
All I had to so was to associate a suitable bee with a Status value 🙂
The trick is to ensure that the graphic item is a group shape without any visible text or geometry, but must contain at least one line which is preferably horizontal. Then to have a User-Defined Cell, named, say, Angle with the following formula:
"=ANGLETOPAR(ANGLEALONGPATH(Geometry1.Path,1),Width,ThePage!PageWidth)"
This formula uses the ANGLEALONGPATH(…) function to get the angle of a specified geometry segment, then the ANGLETOPAR(…) function to get the angle relative to the page. See Visio ShapeSheet Functions A-C for more of an explanation of these functions.
Then the Angle cell in sub-shapes just need to reference the User.Angle cell of the top shape, but prefixed with a minus sign. The effect is that the icons will remain level to the page when the target shapes are rotated:
Simply run the bVisualIconSetMaker.IconSetMaker.MakeIconSetFromShapes macro in the bVisualIconSetMaker.vssm macro-enabled stencil to create a data graphic icon set from the selected shapes.
Docked Stencils in Visio for the Web
Visio desktop has multiple ways to specify the folder where docked stencils can be found, but, as far as I am aware, Visio for the Web only has one. I mostly create VSTO add-ins for Visio desktop, and I use Visio desktop as a studio for creating templates for Visio for the Web. Often, I…
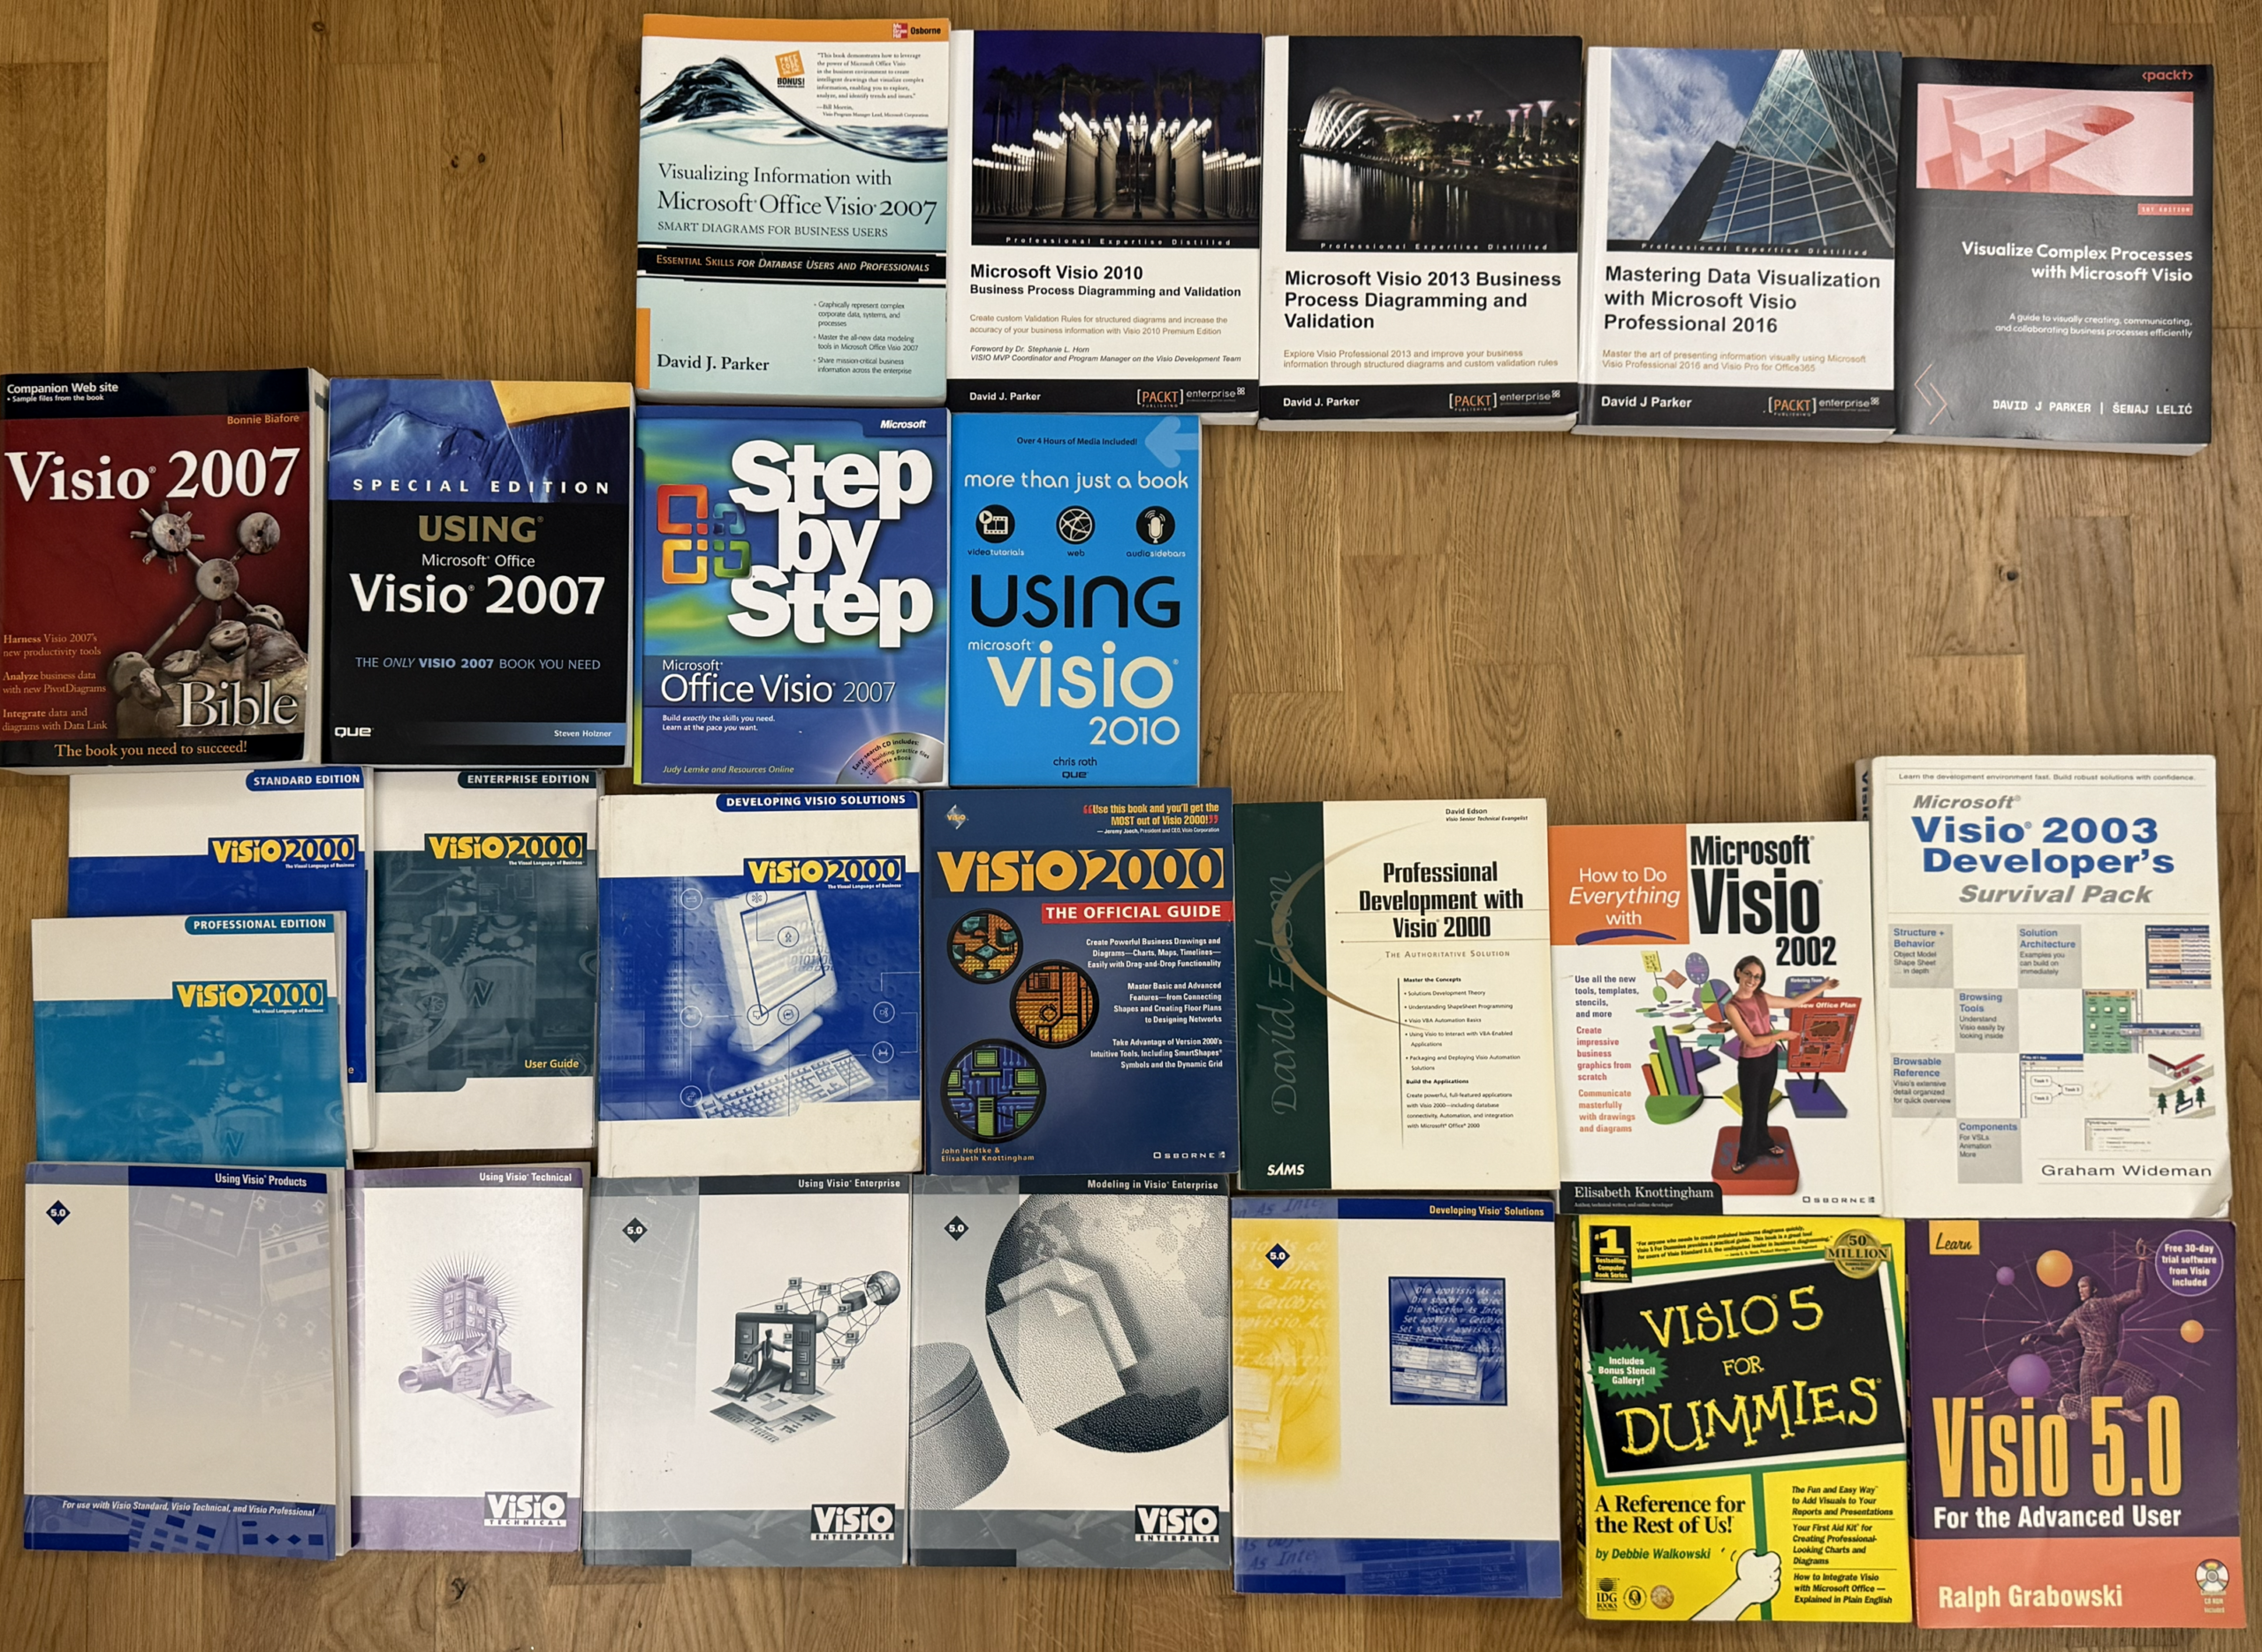
My Visio Books and Old pre-C# Work
We, as a family, are in the process of de-cluttering our house for hopefully a move closer to the south coast, so I decided to take a photo of my Visio books collection, and as you can see, back in the mid-1990’s, I started reading and learning from other peoples works, and then progressed to…

Migrating from Lucidchart to Visio?
My fellow Visio MVP, Michel Laplane, and I recently converted and transformed 15k Lucidchart documents to Microsoft Visio for a large multi-national organization. This was approximately 4 years after they had moved from Visio to Lucidchart! I do not know the full reason behind these changes in technology, and I do not have a particular…

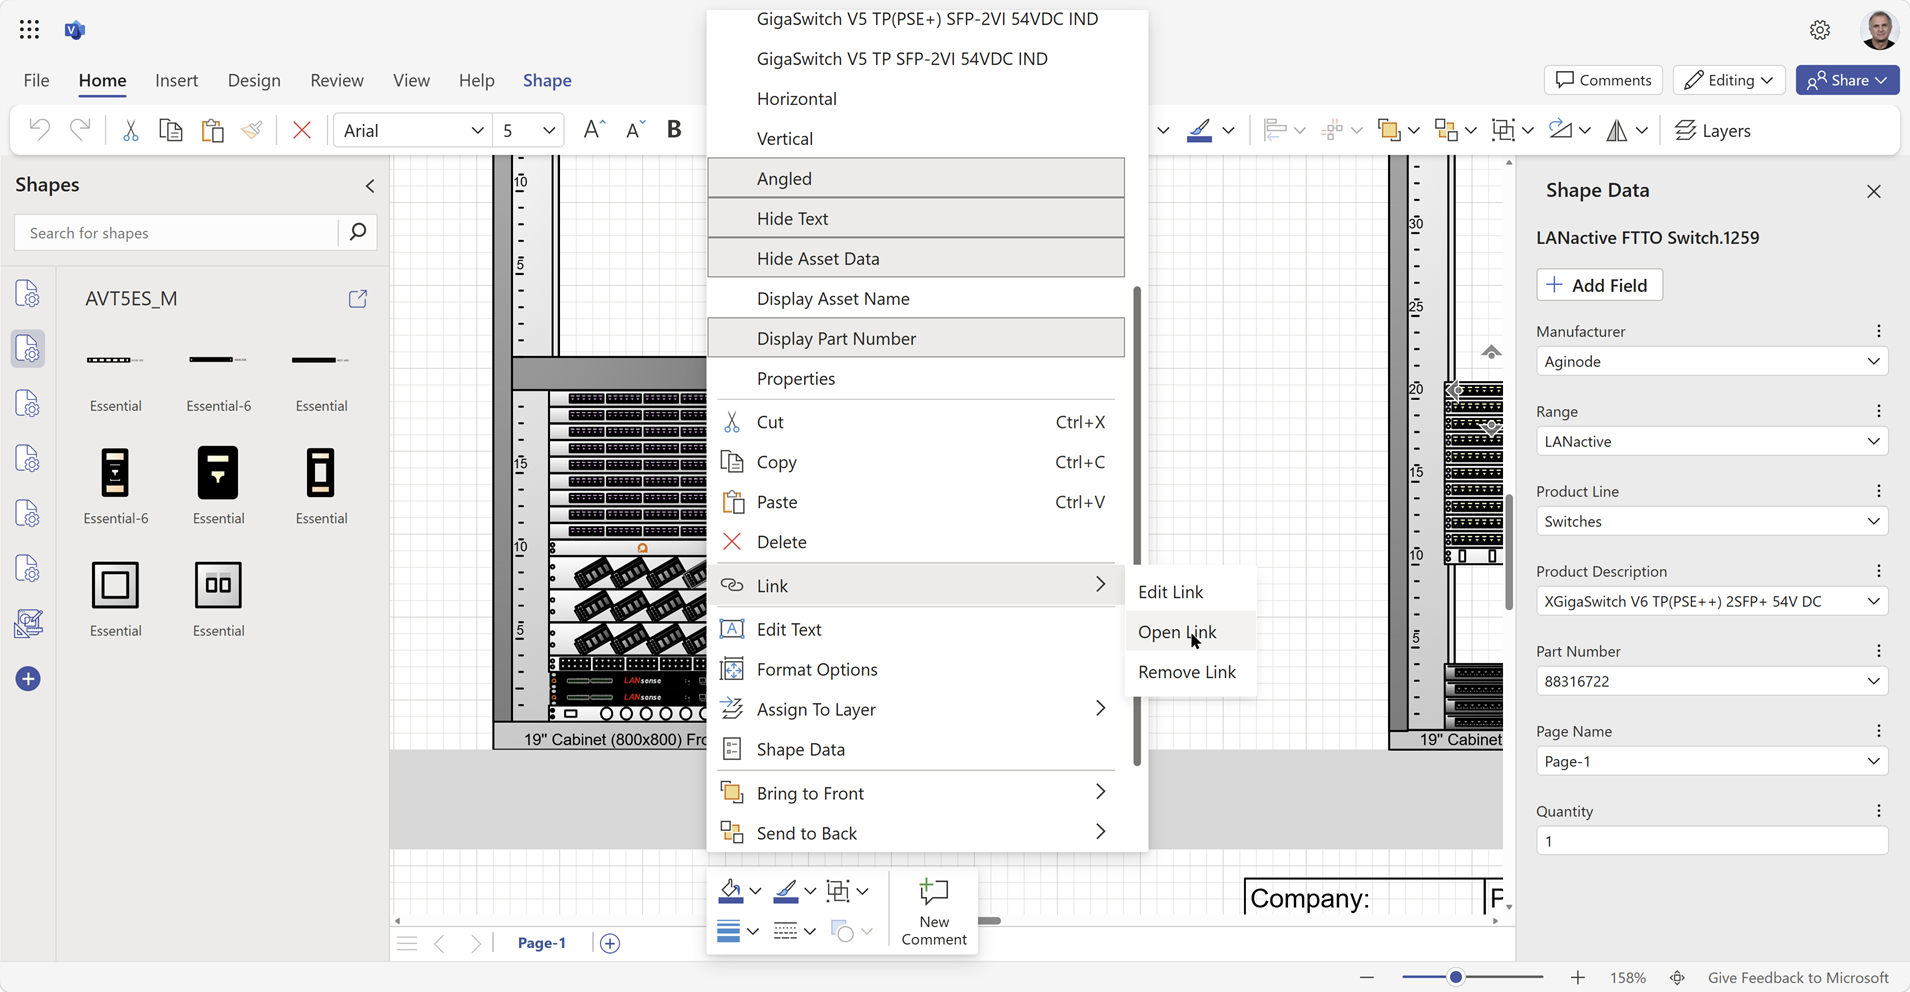
Creating Boolean Context Menus in Visio
Over the many, many years that I have been creating Microsoft Visio solutions, I have had to create numerous right-mouse context menus for shapes to control their Shape Data values. Over that time, patterns emerge, so this article is highlighting three different appearances for simple Boolean values, otherwise known as True/False or Yes/No values, and…

Installing Visio Templates and Stencils
I was recently on holiday but needed to update an installation of Visio Templates and Stencils for all languages. I use Advanced Installer in Enterprise mode so that I can edit the PublishComponent table like I have described in my earlier article ( see Using Advanced Installer with Visio VSTO Add-Ins – bVisual )Unfortunately I…

Creating a Dynamic connector master automatically
I have been creating Microsoft Visio solutions for 30 years now … my first was in 1996! I have been an advocate for custom Masters from the very start, every since I learnt how editing the Master can automatically update all of its instance shapes can be automatically updated throughout the document. Whenever you drag…
Leave a Reply
You must be logged in to post a comment.