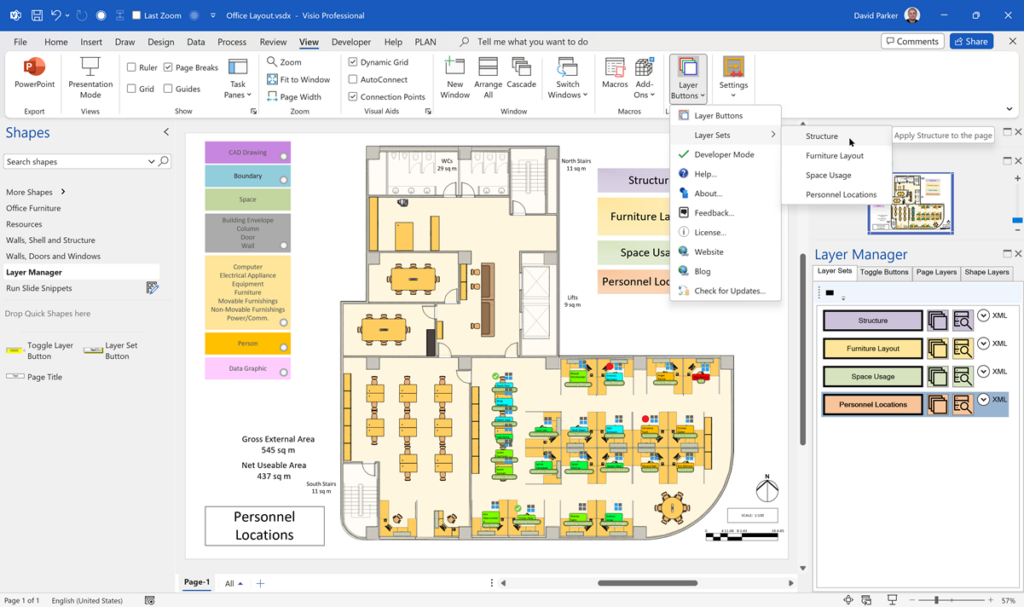
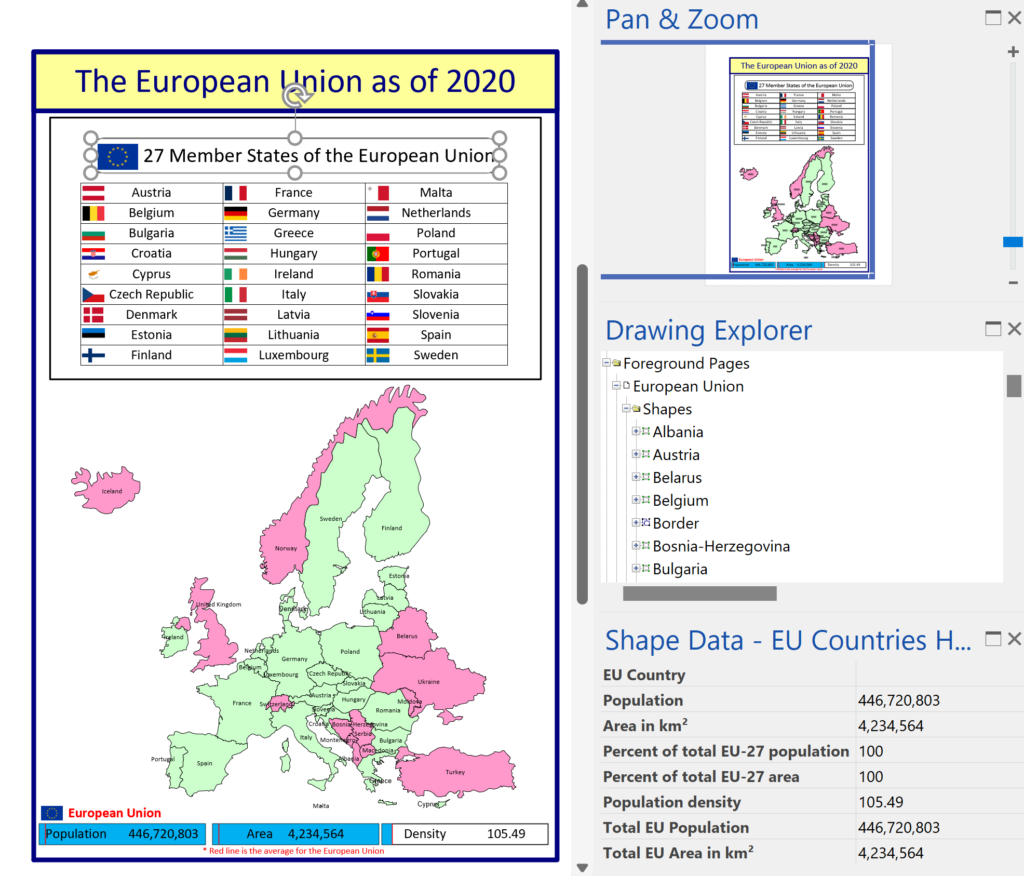
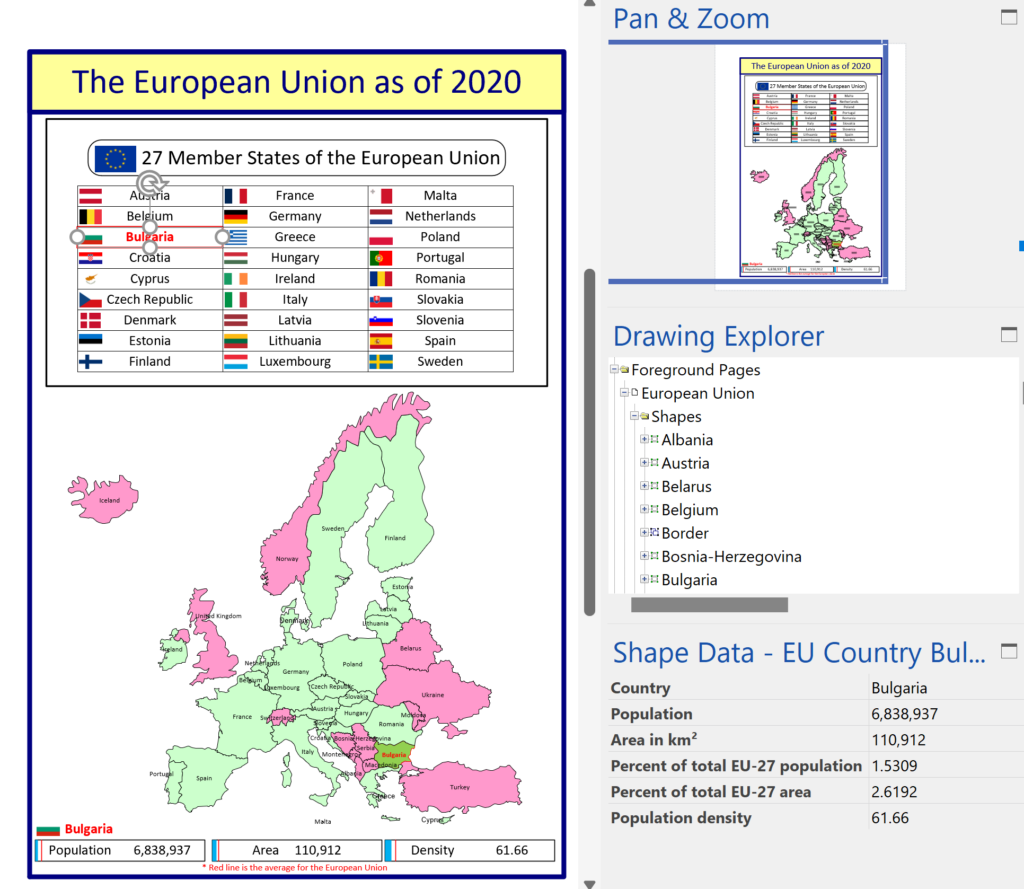
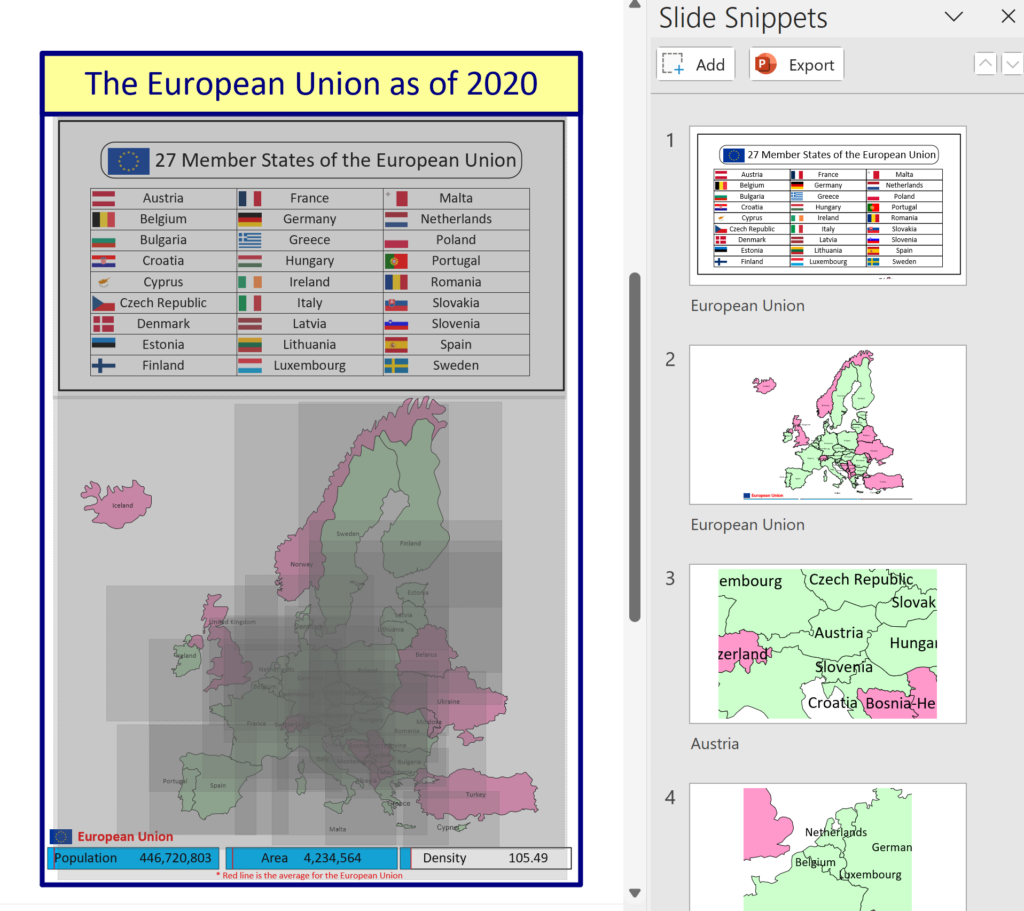
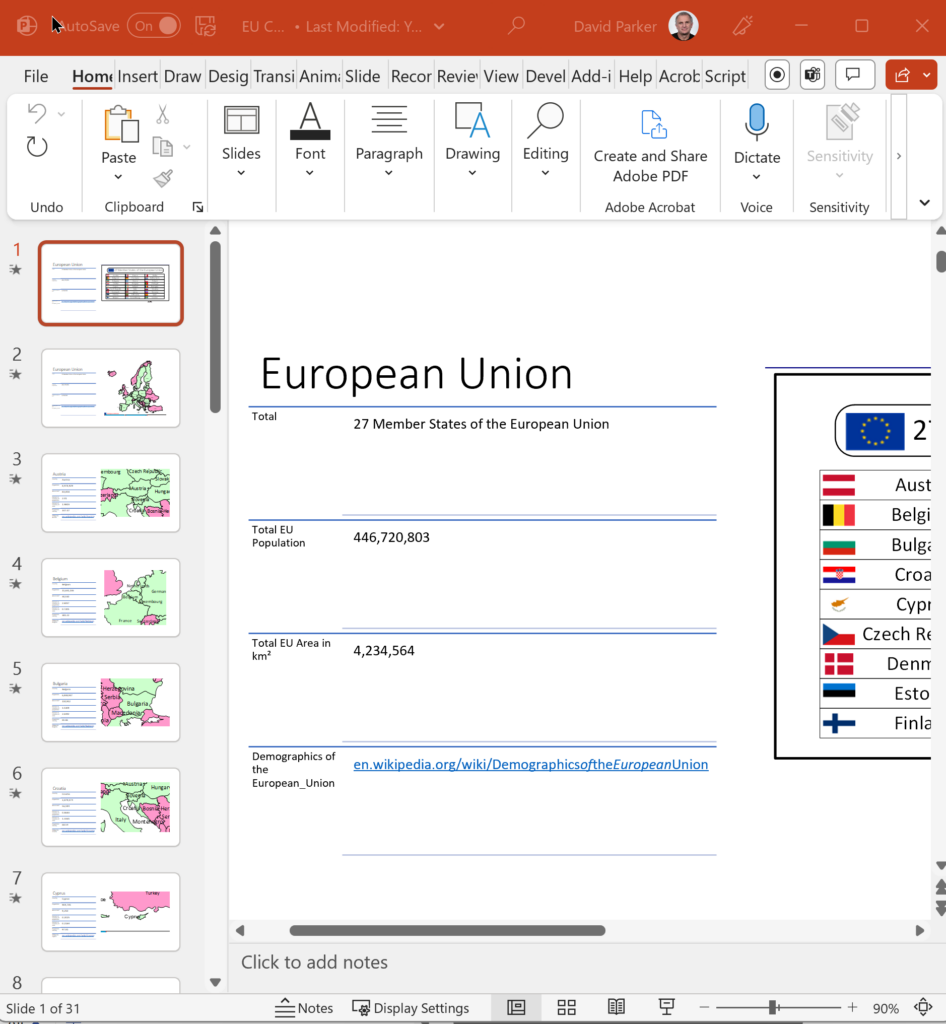
• Skip to main content
  • Skip to primary sidebar
  • Skip to footer

bVisual

  • Home
  • Services
    • How Visio smartness can help your business
    • Visio visual in Power BI
    • Visio Consulting Services
    • Visio Bureau Services
    • Visio Training and Support Services
  • Products
    • Visio Shape Report Converter
    • SS Plus
    • LayerManager
    • visViewer
    • Metro Icons
    • Rules Tools for Visio
    • The Visio 2010 Sessions App
    • Multi-Language Text for Visio
    • Document Imager for Visio
    • multiSelect for Visio
    • pdSelect for Visio
  • Case Studies
    • Case studies overview
    • Using Visio in Education for GIS
    • Visualizing Construction Project Schedules
    • Visio Online Business Process Mapping
    • Nexans Visio Template
    • CNEE Projects, WorldCom
    • Chase Manhattan Bank
  • News
    • Recent news
    • News archive
  • Resources
    • Articles➡
      • ShapeSheet Functions A-Z
      • Comparing Visio for the Web and Desktop
      • Customising Visio Shapes for the Web App
      • Key differences between the Visio desktop and web apps
      • Using the Visio Data Visualizer in Excel
      • Using Visio in Teams
      • Creating Visio Tabs and Apps for Teams with SharePoint Framework (SPFx)
      • Designing Power Automate Flows with Microsoft Visio
      • Innovative uses of Visio Lists
    • Webcasts ➡
      • Visio in Organizations
      • My session and other Visio sessions at MSIgnite 2019
      • Power up your Visio diagrams
      • Vision up your Visio diagrams
      • The Visio 2010 MVP Sessions
    • Visio Web Learning Resources
    • Books➡
      • Visualize Complex Processes with Microsoft Visio
      • Mastering Data Visualization with Microsoft Visio
      • Microsoft Visio Business Process Diagramming and Validation
      • Visualizing Information with Microsoft Visio
  • Blog
    • Browse blog articles
    • Visio Power BI articles
    • Visio for Web articles
    • A history of messaging and encryption
  • About us
    • About bVisual
    • Testimonials
    • Bio of David Parker
    • Contact Us
    • Website Privacy Policy
    • Website terms and conditions
    • Ariba Network

Shape Design

Published on April 28, 2023 by David Parker

Interactive Demographics of the European Union in Visio

I was recently contacted by a reader, Stanley M. Max (Towson University lecturer), who had started creating a Visio map of the 27 countries in the European Union in 2020, along with the demographics culled from Wikipedia. He wanted to know if the map and stats could be combined to make a more appealing presentation. Well, that prompted me to not only combine the data and country shapes, but to explore ways in which a presentation of the map can be made more interesting in Visio. So, I added data and hyperlinks to the shapes, and set up a page property for the selected country which automatically highlights the country shape, statistics, and header, to which I added flags. So, the user can either set the page country using the Shape Data window for the page, or context menu of each country, or simply by double-clicking.

  • The original Visio page
  • The original Excel table
  • The enhanced Visio page
  • A country selected for the page
  • Adding Slide Snippets
  • Exported to PowerPoint
  • Export to Word previews
  • Exported to Word
[Read more…] about Interactive Demographics of the European Union in Visio

Filed Under: Geographic, PowerPoint, Shape Data, ShapeSheet Formulas, Slide Snippets, SS Plus, Visio for Desktop, Visio for Web Tagged With: PowerPoint, Shape Data, Slide Snippets, Visio, word

Published on April 9, 2023 by David Parker

Understanding Visio Data Graphic’s Color by Value

The desktop Visio editions, Visio Professional and Visio Plan 2, have a great way of automatically displaying data as Data Bars, Icon Sets, Text Callouts and Color by Value. The first three types of Data Graphics require sub-shapes to be inserted into each shape that they are applied to, but the last one, Color by Value (CBV), merely requires some User-defined Cells and formulas. However, unlike the first three, there can be only one Shape Data value displayed as colours in each Data Graphic (DG). So, how can we easily update the colour assigned to each value using code, rather than manually using the manual dialogs provided?

  • One Data Graphic with 4 CBVs
  • The first in the list is applied
  • Numeric data can have two types of CBV
  • Locating the Data Graphic master
[Read more…] about Understanding Visio Data Graphic’s Color by Value

Filed Under: Data Graphics, ShapeSheet Formulas, Visio for Desktop, Visio Plan 2 Tagged With: Data Graphics, ShapeSheet, Visio

Published on March 17, 2023 by David Parker

Update to LayerManager add-in for non-English users

A French user of LayerManager recently reported that the Refresh Counts button was not working for him, and a few other users were recently finding that the trial period was reporting expired immediately after download. Both of these issues have hopefully been addressed in the latest version 23.3.1, which is available for free to current users.

  • Before clicking Refresh Counts
  • After clicking Refresh Counts
[Read more…] about Update to LayerManager add-in for non-English users

Filed Under: LayerManager, Layers, Visio for Desktop Tagged With: LayerManager, Layers, Visio

Published on January 9, 2023 by David Parker

Pushing Data Visualizer in Visio beyond its limits

My last post was about some of the lessons learnt when trying to push Data Visualizer to its limits, but this one has some ways of overcoming these limitations. The main lesson learnt is that DV binds the shapes within the DV container shape, CFF Data Visualizer, and controls some of the ShapeSheet cells that are normally available for customization. The label of the connector is bound to the respective column in the Excel table, and that, combined with the ability to modify the Dynamic connector master shape provides a way of overcoming some of the limitations discovered.

So, given that we want to use DV, and we need to have multiple flows between the same shapes, then they cannot be separate connectors. We need to combine multiple flows onto the same connector, and then find a way to selectively display different flows somehow by controlling the visibility of the connectors. However, we cannot make them invisible because they will be deleted by DV, so we need to control their transparency instead. We can do this by interpreting the label somehow, and we are going to modify the Dynamic connector to react to the text of the label, and we can also change the colour and line pattern too.

The following screenshots show the Excel table with the multiple flows between the same shapes concatenated with pipe characters, and the diagram created by Data Visualizer when this table is imported into a custom template using Data \ Create from Data \ Create:

[Read more…] about Pushing Data Visualizer in Visio beyond its limits

Filed Under: Connectors, Data Visualizer, Shape Data, Shape Reports, ShapeSheet Formulas, Uncategorized, Visio Plan 2 Tagged With: Connectors, Data Visualizer, ShapeSheet Functions

Published on January 3, 2023 by David Parker

Pushing Data Visualizer in Visio to the limits!

Regular readers of my blog will know that I like to use the Data Visualizer (DV) in Visio Plan 2, but I recently tried to help a user who really decided to push it to the limits. In this scenario, there were multiple connections, but with different labels, being created between the same flowchart shapes, and the plea was how to make it work! Well, I experimented with this, and found that DV does not really work well in this way, and then proposed an alternative approach, which I will explain in this article.

First, I will show how it fails by setting up an Excel table that does contains multiple connections, but fails to update the labels consistently.

Excel Table with Multiple Links
[Read more…] about Pushing Data Visualizer in Visio to the limits!

Filed Under: Connectors, Data Visualizer, External Data, Layers, Shape Data, Shape Reports, ShapeSheet Formulas, Visio Plan 2 Tagged With: Data Visualizer, Visio

Published on December 1, 2022 by David Parker

Teams Tuesday Podcast Recording about Visio

I am delighted to share the link to my recent demonstration and conversation with fellow MVP Peter Ward about Visio in Teams. We discussed more than just Visio … and I look a bit like Max Headroom!

[Read more…] about Teams Tuesday Podcast Recording about Visio

Filed Under: Data Visualizer, Diagram Types, MVP, Office 365, PowerBI, Shape Design, SharePoint Online, Teams, Visio Tagged With: SharePoint, Teams, Visio, Visio for M365, Visio for the Web, Visio Online

  • « Go to Previous Page
  • Page 1
  • Interim pages omitted …
  • Page 3
  • Page 4
  • Page 5
  • Page 6
  • Page 7
  • Interim pages omitted …
  • Page 35
  • Go to Next Page »

Primary Sidebar

  • LinkedIn
  • Twitter

Recent Posts

  • Fixing dimensions of 2D shapes
  • Merging Linked Data from Similar Tables
  • Smart Radio Buttons and Check Boxes in Visio
  • Using Button Face Ids in Visio
  • Grid Snapping Revisited

Categories

Tags

Accessibility Add-Ins Connectors Containers Data Export Data Graphics Data Import Data Visualizer Educational Excel GraphDatabase Hyperlinks Icon Sets JavaScript LayerManager Layers Legend Link Data to Shapes Lists MSIgnite MVP Office365 Org Chart PowerApps PowerBI PowerQuery Processes Setup and Deployment Shape Data Shape Design ShapeSheet ShapeSheet Functions SharePoint 2013 SQL Teams Validation VBA Video Visio Visio 2007 Visio for the Web Visio Online Visio Services Visio Viewer Webinar

Footer

bVisual Profile

The UK-based independent Visio consultancy with a worldwide reach. We have over 25 years experience of providing data visualization solutions to companies around the globe.

Learn more about bVisual

  • Amazon
  • E-mail
  • Facebook
  • LinkedIn
  • Twitter
  • YouTube

Search this website

Recent posts

  • Fixing dimensions of 2D shapes
  • Merging Linked Data from Similar Tables
  • Smart Radio Buttons and Check Boxes in Visio
  • Using Button Face Ids in Visio
  • Grid Snapping Revisited

Copyright © 2025 · Executive Pro on Genesis Framework · WordPress · Log in