• Skip to main content
  • Skip to primary sidebar
  • Skip to footer

bVisual

  • Home
  • Services
    • How Visio smartness can help your business
    • Visio visual in Power BI
    • Visio Consulting Services
    • Visio Bureau Services
    • Visio Training and Support Services
  • Products
    • Visio Shape Report Converter
    • SS Plus
    • LayerManager
    • visViewer
    • Metro Icons
    • Rules Tools for Visio
    • The Visio 2010 Sessions App
    • Multi-Language Text for Visio
    • Document Imager for Visio
    • multiSelect for Visio
    • pdSelect for Visio
  • Case Studies
    • Case studies overview
    • Using Visio in Education for GIS
    • Visualizing Construction Project Schedules
    • Visio Online Business Process Mapping
    • Nexans Visio Template
    • CNEE Projects, WorldCom
    • Chase Manhattan Bank
  • News
    • Recent news
    • News archive
  • Resources
    • Articles➡
      • ShapeSheet Functions A-Z
      • Comparing Visio for the Web and Desktop
      • Customising Visio Shapes for the Web App
      • Key differences between the Visio desktop and web apps
      • Using the Visio Data Visualizer in Excel
      • Using Visio in Teams
      • Creating Visio Tabs and Apps for Teams with SharePoint Framework (SPFx)
      • Designing Power Automate Flows with Microsoft Visio
      • Innovative uses of Visio Lists
    • Webcasts ➡
      • Visio in Organizations
      • My session and other Visio sessions at MSIgnite 2019
      • Power up your Visio diagrams
      • Vision up your Visio diagrams
      • The Visio 2010 MVP Sessions
    • Visio Web Learning Resources
    • Books➡
      • Visualize Complex Processes with Microsoft Visio
      • Mastering Data Visualization with Microsoft Visio
      • Microsoft Visio Business Process Diagramming and Validation
      • Visualizing Information with Microsoft Visio
  • Blog
    • Browse blog articles
    • Visio Power BI articles
    • Visio for Web articles
    • A history of messaging and encryption
  • About us
    • About bVisual
    • Testimonials
    • Bio of David Parker
    • Contact Us
    • Website Privacy Policy
    • Website terms and conditions
    • Ariba Network

Shape Design

Published on July 13, 2008 by David Parker

Flags of the World

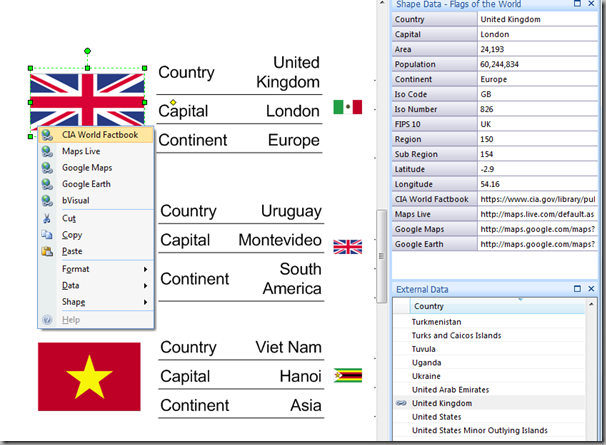
I was recently asked how to add a country flag to Visio Org Chart shapes automatically.  Well, as I am currently working with world data at the moment, I have taken up the challenge.  Firstly, the CIA have an excellent source of information, called the World Factbook ( https://www.cia.gov/library/publications/the-world-factbook/ ).  You can find all sorts of information about every country in the world, including, of course, their flags.  There are over 240 countries at the moment, and there are various codes used by different systems to identify them.  Even the name may not be the same, for example, do I live in UK, United Kingdom, Great Britain, United Kingdom of Great Britain and Northern Ireland or just plain old England?  Answers on a post card, please, addressed to …..?

Alternatively, a country can be identified accurately with a code, but you need to know which system is being used.  United Kingdom can be identified by GB in the Iso 2 character system, or 826 in the Iso numeric system, or UK in the FIPS 10 system.  The CIA World Factbook utilises the FIPS 10 code, so consequently, all of the country related web pages and images are coded with this system.

I have already created an Access database with all this information, so I decided to use this knowledge to create a Flags of the World Visio Master.
image
[Read more…] about Flags of the World

Filed Under: Geographic, ShapeSheet Formulas, VBA, Visio

Published on June 19, 2008 by David Parker

Enhancing Visio Data Graphics Text Callouts

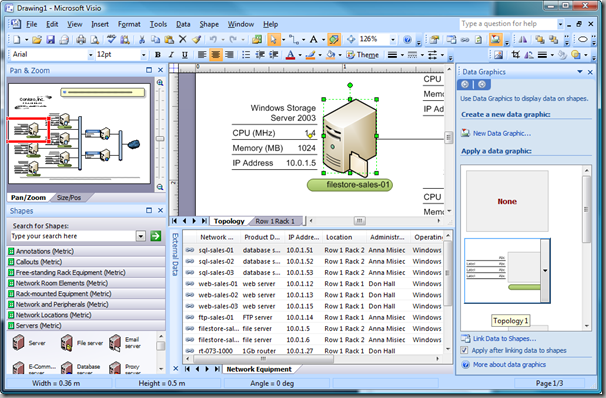
Visio 2007 Professional introduced the wonderful Data Graphics feature to display Shape Data in a clear visual way, but it is not clear how you may, for example, change the font of even the simplest Graphic Item type, Text Callouts.  In this blog, I’ll show you one method that I employ to vary the appearance of Text Callouts.  The same technique can be used for other Graphic Item types, Icon Sets and Data Bars.

I am using the  the sample IT Asset Management drawing to demonstrate throughout, which can be found in the Samples Template Category.  In this diagram, the server shapes on the topology page use the Topology 1 Data Graphic, which can be seen in the Data Graphics panel.

image
[Read more…] about Enhancing Visio Data Graphics Text Callouts

Filed Under: Data Graphics, Visio

Published on April 20, 2008 by David Parker

Setting Visio Shape Cell Values By Connections

A recent newsgroup poster asked me to explain how to set the line color and weight of a connector according to the shapes it is connected to.  So, in this article, I have tried to explain one method of achieving this with minimal external coding.

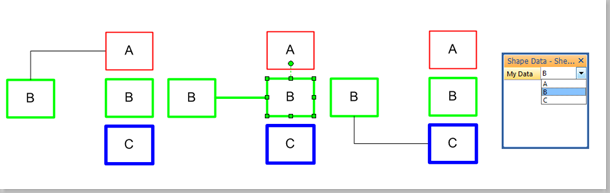
In this example, I have created a rectangle shape that has a single Shape Data row, MyData, which has a fixed list of values, A;B;C.

The connector shape has been modified to trigger an event whenever a connection is made or unmade.  If the user successfully connects two rectangles with the same MyData value, then the line (weight and color) of the connector shape is amended to match the rectangle shapes.

image
[Read more…] about Setting Visio Shape Cell Values By Connections

Filed Under: Connections, Connectors, VBA, Visio

Published on April 4, 2008 by David Parker

UK Counties and Boroughs Map Shapes for Visio

My friend and colleague, Chris Roth, has made lots of maps available in Visio, his latest being Germany ( http://www.visguy.com/2008/03/01/map-of-germany/ ).  Well, we Brits hate being outdone by a German-American, so I have decided to make my UK Map shapes for Visio publicly available at UK Geography Structure.vsd .

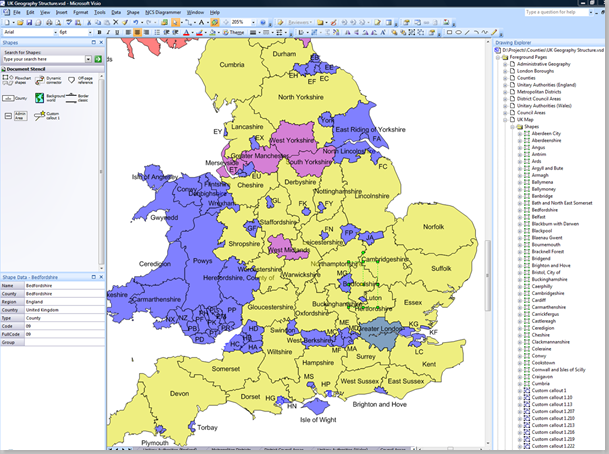
I created the UK map several years ago by converting from PDF to SVG to Visio, and each of the counties and boroughs have a single rectangular Master, Admin Area.  I used code to replace the rectangle geometry with the actual shape geometry.  This means that, although they are all different, they have the same Master, thus making it easier to propagate any changes, such as Shape Data rows.

image
[Read more…] about UK Counties and Boroughs Map Shapes for Visio

Filed Under: External Data, Geographic, Shape Data, Visio

Published on March 17, 2008 by David Parker

Using Fill Patterns with DataGraphic Color By Value

Microsoft Office Visio 2007 Professional provides the ability to color shapes by different values in selected cells.  This is great, but just how many color variations can your eyes detect?  If you have lots of different values, then the color by value automatically produced colors can look too similar to be able to distinguish them apart. In this article, I propose a method of automatically assigning different fill patterns to similar colors so that they can be visually separated.
[Read more…] about Using Fill Patterns with DataGraphic Color By Value

Filed Under: Color, Visio

Published on December 10, 2007 by David Parker

Creating PolyLines From Existing Shapes in Visio

A couple of posts in the Visio newsgroups got me thinking this weekend.  One was from an Autocad conversant user who would prefer Visio to draw a continuous line between points rather than doing the normal click, hold and drag with line tool because he has tendonitis; and the other wanted to draw a circle centered on a vertex because he is drawing land boundaries.

Visio has a PolyLine line type, but, as far as I am aware, it can only be created in code – there is no menu or toolbar button to enable you to use it.  It was introduced for converting CAD lines, and is simply a series of X and Y co-ordinates in a single cell, rather than the normal co-ordinate per row.
[Read more…] about Creating PolyLines From Existing Shapes in Visio

Filed Under: ShapeSheet Formulas, VBA, Visio

  • « Go to Previous Page
  • Page 1
  • Interim pages omitted …
  • Page 33
  • Page 34
  • Page 35
  • Page 36
  • Go to Next Page »

Primary Sidebar

  • LinkedIn
  • Twitter

Recent Posts

  • Introducing a free Visio Report Runner application
  • Protecting the integrity of custom Visio masters
  • Docked Stencils in Visio for the Web
  • My Visio Books and Old pre-C# Work
  • Migrating from Lucidchart to Visio?

Categories

Tags

Accessibility Add-Ins AdvancedInstaller Connectors Containers Data Export Data Graphics Data Import Data Visualizer Educational Excel GraphDatabase Hyperlinks Icon Sets JavaScript LayerManager Layers Legend Link Data to Shapes MSIgnite Office365 Org Chart PowerApps PowerBI PowerQuery Processes Setup and Deployment Shape Data Shape Design ShapeSheet ShapeSheet Functions SharePoint 2013 SQL Teams Validation VBA Video Visio Visio 2007 Visio for the desktop Visio for the Web Visio Online Visio Services Visio Viewer Webinar

Footer

bVisual Profile

The UK-based independent Visio consultancy with a worldwide reach. We have over 25 years experience of providing data visualization solutions to companies around the globe.

Learn more about bVisual

  • Amazon
  • E-mail
  • Facebook
  • LinkedIn
  • Twitter
  • YouTube

Search this website

Recent posts

  • Introducing a free Visio Report Runner application
  • Protecting the integrity of custom Visio masters
  • Docked Stencils in Visio for the Web
  • My Visio Books and Old pre-C# Work
  • Migrating from Lucidchart to Visio?

Copyright © 2026 · Executive Pro on Genesis Framework · WordPress · Log in