Microsoft Office Visio 2007 Professional provides the ability to color shapes by different values in selected cells. This is great, but just how many color variations can your eyes detect? If you have lots of different values, then the color by value automatically produced colors can look too similar to be able to distinguish them apart. In this article, I propose a method of automatically assigning different fill patterns to similar colors so that they can be visually separated.
First, we must try to understand how the color by value works. In the following example based on a large number of uniquely named departments, I wish to be able to distinguish the spaces assigned to each one on a floor plan. I have just shown the color assignments for the first 20 departments (automatically sorted alphabetically) created with a Color By Value Data Graphic item for the Department shape data values.
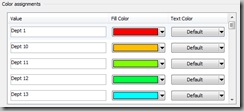
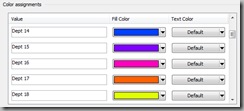
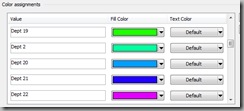
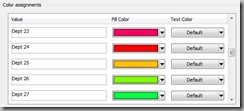
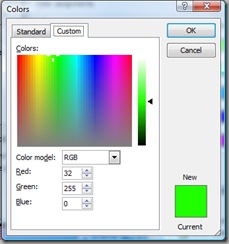
Notice how the color assignments have started again from the Red for Dept 23? So, we have reached the limit of automatically assigned colors. Of course, we could decide to blend our own colors using the color picker, and there are a possible 16,777,216 different color combinations using the RGB or HSL notation, but just how many variations can the human eye perceive?
Now, the Data Graphic Color By Value formulae are added to an automatically created User.visDGCBVFill cell in the ShapeSheet of the Data Graphic master, and, therefore to all shapes that use it.
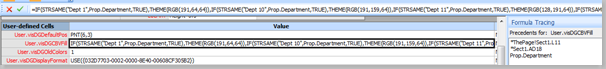
In fact, if the shape is a group, then an almost identical formula is added to the sub shapes too, except that they refer to the cell value in the group shape. Thus Prop.Department would become Sheet.5!Prop.Department (or whatever the sheet ID is).
N.B. If you intend to use Data Graphics with instances of a Master, then it is probably worthwhile making it into a group at the start, since any other Data Graphic items (Text Callouts, Data Bars and Icon Sets) will automatically convert the instances into groups.
The color of the background fill (FillBkgnd) is read from the result of User.visDGCBVFill and the foreground fill (FillForegnd) is a TINT of the back ground fill.
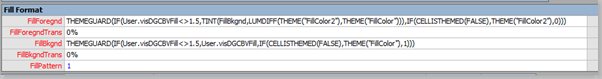
I should explain (or remind you if you knew this already) that the foreground and background fill colors are only both used when the fill pattern is not 1 (Solid). In fact, the presentation of foreground and background is reversed in the user interface when a fill pattern is not Solid.
This is the standard fill patterns, starting with no fill, then white (RGB(255,255,255)) solid fill foreground then applying each standard fill pattern with a blue (RGB(31, 71, 125)) pattern color. Notice how the FillForegnd and FillBkgnd cell values switch above a FillPattern of 1.
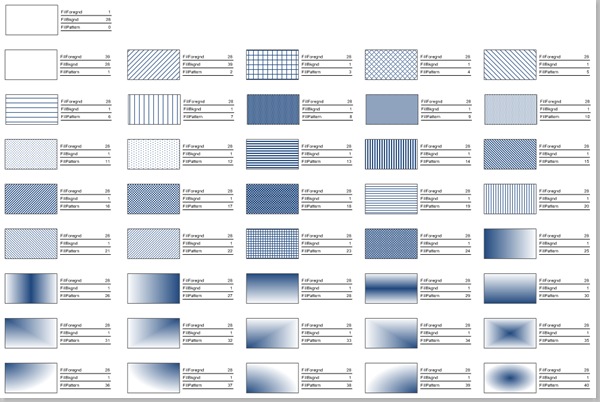
Now, the Data Graphic Color By Value uses Solid colors, therefore it is necessary to look at the reverse of the above to get a better idea of how these fill patterns would appear in a shape.
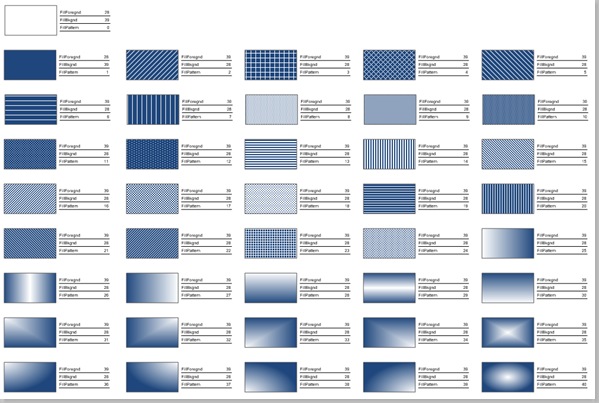
Now, not all shapes will be rectangular in appearance, so some patterns work better than others.
So, here are 40 different departments using the default color by value colors…
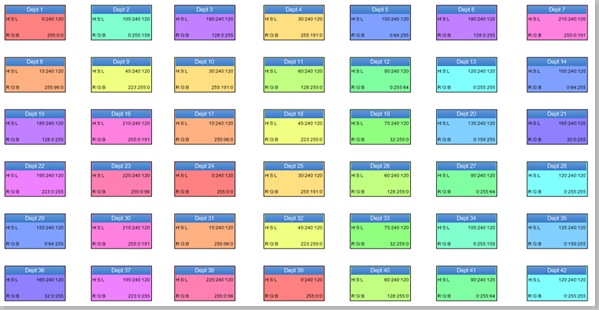
As you can see, it is a little difficult to distinguish some of the colors because they are exactly the same!
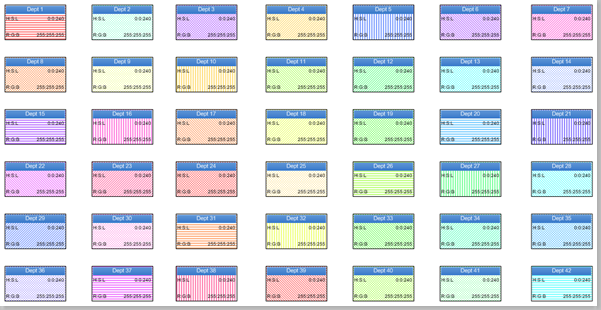
In the screenshot below, I have applied a VBA function, UpdateCBVFillPatterns, which has additionally cycled through a list of fill pattern numbers (in this case “13;14;15;16;17;18” ).
You can now visually distinguish different departments!
I have included the whole VBA code below for you to try. Please note that this currently expects you to select one shape that uses Color By Value before running the it, and it only updates the active page, but it could be extended to update the whole document quite easily.
In addition, I am looking into extending the legends created by our own DataLegends product (http://www.bvisual.net/Products/DataLegends.aspx ) to also show the fill patterns.
Public Sub UpdateCBVFillPatterns()
Dim shp As Visio.Shape
If Visio.ActiveWindow.Selection.Count = 0 Then
MsgBox “There is no shape selected!”
Exit Sub
Else
Set shp = Visio.ActiveWindow.Selection.PrimaryItem
End If
Dim mstDG As Visio.Master
If shp.DataGraphic Is Nothing Then
MsgBox “The selected shape does not have a data graphic!”
Exit Sub
Else
Set mstDG = shp.DataGraphic
End If
Dim gi As Visio.GraphicItem
For Each gi In mstDG.GraphicItems
If gi.Type = visTypeColorByValue Then
Exit For
End If
Next gi
If gi.Type <> visTypeColorByValue Then
MsgBox “The selected shape does not have a Color by Value graphic item!”
Exit Sub
End If
‘Enter the list of standard patterns to use
Dim patternList As String
patternList = “13;14;15;16;17;18”
Dim bkgndColor As String
bkgndColor = “RGB(255,255,255)”
Dim mst As Visio.Master
Dim shpMst As Visio.Shape
‘The Shape could have a master, so best to update it
If Not shp.Master Is Nothing Then
Set mst = shp.Master.Open
addTriggerCell mst.Shapes(1), patternList, bkgndColor
‘Could be applied to a sub-shape
For Each shpMst In mst.Shapes(1).Shapes
addTriggerCell shpMst, patternList, bkgndColor
Next
mst.Close
End If
Dim sel As Visio.Selection
Dim shpSel As Visio.Shape
Dim shpSub As Visio.Shape
‘Select all of the shapes in the active page that use this Data Graphic
Set sel = Visio.ActivePage.CreateSelection(visSelTypeByDataGraphic, 0, mstDG)
For Each shpSel In sel
addTriggerCell shpSel, patternList, bkgndColor
‘Could be applied to a sub-shape
For Each shpSub In shpSel.Shapes
addTriggerCell shpSub, patternList, bkgndColor
Next
Next
End Sub
Private Sub addTriggerCell(ByVal shp As Visio.Shape, _
ByVal patternList As String, ByVal bkgndColor As String)
‘Check that visDGCBVFill cell exists
If shp.CellExists(“User.visDGCBVFill”, Visio.VisExistsFlags.visExistsLocally) = 0 Then
Exit Sub
End If
‘Get the color formula
Dim clrFormula As String
clrFormula = shp.Cells(“User.visDGCBVFill”).FormulaU
‘Collect the matching values in order
Dim aryFormula() As String
aryFormula = Split(clrFormula, “STRSAME(“)
If UBound(aryFormula) < 1 Then
Exit Sub
End If
Dim ipart As Integer
Dim aryValues() As String
For ipart = 1 To UBound(aryFormula)
ReDim Preserve aryValues(ipart – 1)
aryValues(ipart – 1) = Split(aryFormula(ipart), “,”)(0)
Next ipart
‘Get the cell reference
Dim cellRef As String
cellRef = Split(aryFormula(1), “,”)(1)
‘Create the index of the value from the lookup list
Dim idxPart As String
idxPart = “LOOKUP(” & cellRef & “,””” & Replace(Join(aryValues, “;”), “”””, “”) & “””)”
Dim aryPatterns() As String
aryPatterns() = Split(patternList, “;”)
‘Build the trigger formula
Dim tFormula As String
tFormula = “DEPENDSON(User.visDGCBVFill)”
tFormula = tFormula & “+SETF(GetRef(FillPattern),INDEX(MODULUS(”
tFormula = tFormula & idxPart & “,” & CStr(UBound(aryPatterns) + 1)
tFormula = tFormula & “),””” & patternList & “””))”
tFormula = tFormula & “+IF(INDEX(MODULUS(”
tFormula = tFormula & idxPart & “,” & CStr(UBound(aryPatterns) + 1)
tFormula = tFormula & “),””” & patternList & “””)”
tFormula = tFormula & ” < 2,SETF(GetRef(FillBkgnd),” & bkgndColor & “),”
tFormula = tFormula & “SETF(GetRef(FillForegnd),” & bkgndColor & “))”
Dim irow As Integer
If shp.CellExistsU(“User.PatternTrigger”, Visio.VisExistsFlags.visExistsAnywhere) = 0 Then
irow = shp.AddNamedRow(Visio.visSectionUser, “PatternTrigger”, 0)
Else
shp.Cells(“User.PatternTrigger”).FormulaU = “=”
End If
‘Apply the formula
shp.Cells(“User.PatternTrigger”).FormulaU = “=” & tFormula
End Sub
Hi, David.
I’m trying to use this on Visio 2010, and I’m getting syntax errors.
Can you update this code to work with Visio 2010, if that’s the nature of the issue? I think this is exactly what I need, but I can’t get it to work properly.
There should be no difference for the code required for Visio 2007 and 2010, but I will check … and see if Visio 2013 is any different.
Hi, David.
First let me express my appreciation for your expertise. I have found many solutions to Visio challenges from your content. Huge thanks!
Regarding the use of color-by-value, I have a group of data graphics that all include a color-by-value item and then different placements of text items based on other factors. I now need to change colors assigned to the color-by-value data field of each. Sixteen different data graphics need to be updated. I was hoping to accomplish this through VBA.
The stratagey you used here with patterns to distinguish between colors seems to be applied to the shapes rather than the data graphic master. The macro recorder does not play nice with recording data-graphic changes.
Is it possible to update colors used in the data graphic master through VBA?
Thanks again for all your amazing Visio content!
Kevin
Yes, it can be… You have to update the Data Graphic master, and then the right User-defined Cell that begins with visDGColorItem … ther may be more than one such row, but only one of them is able to be applied at any one time