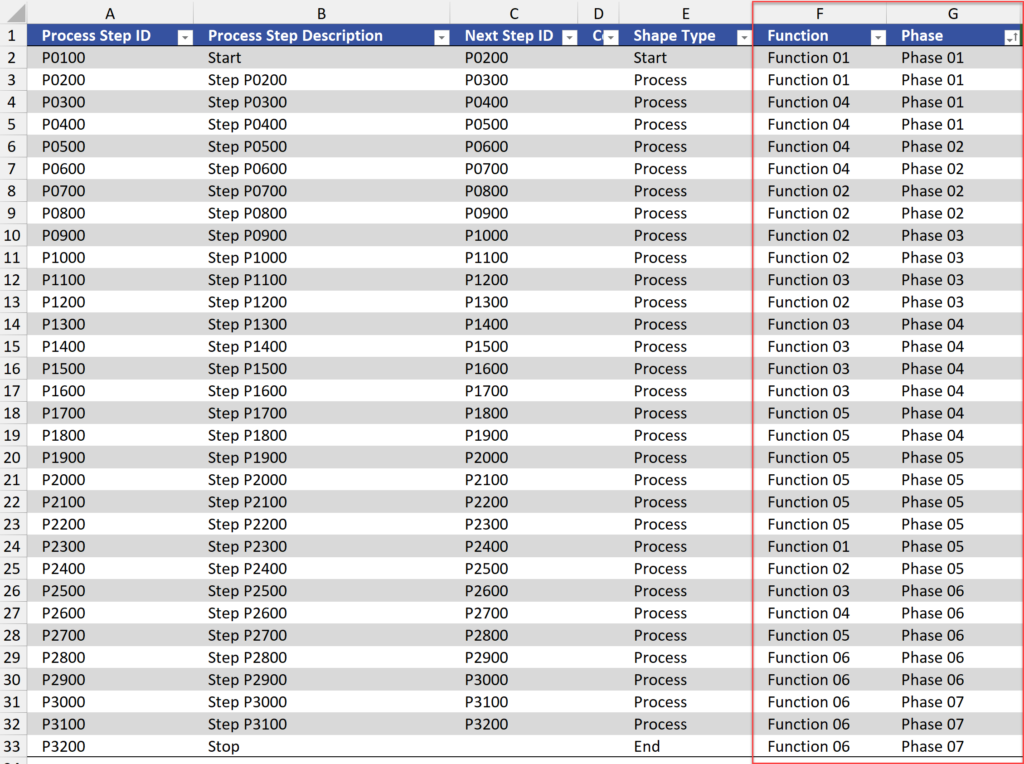
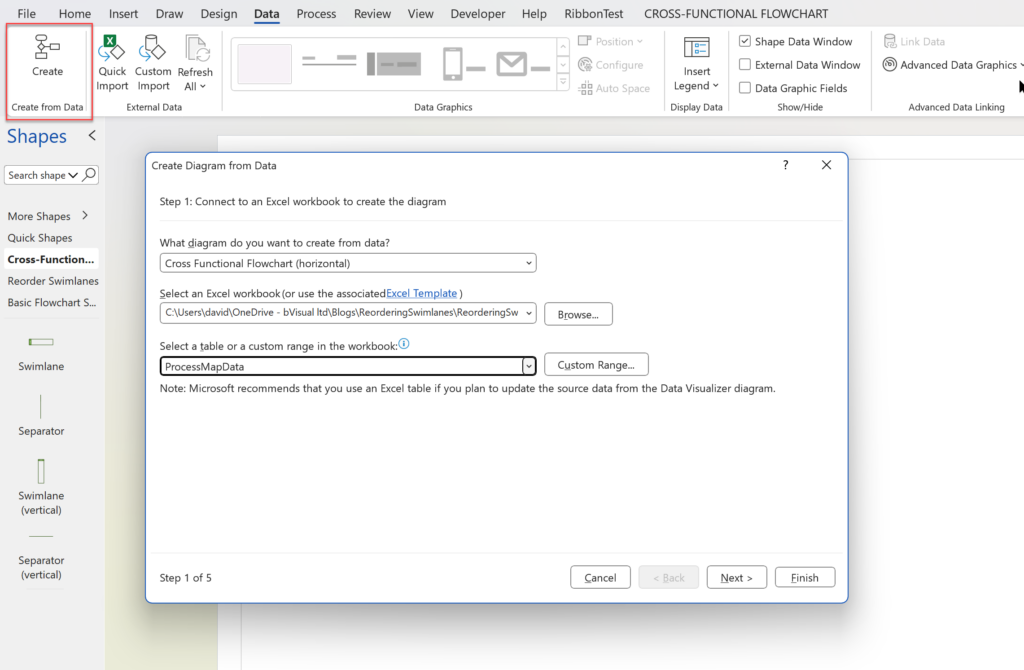
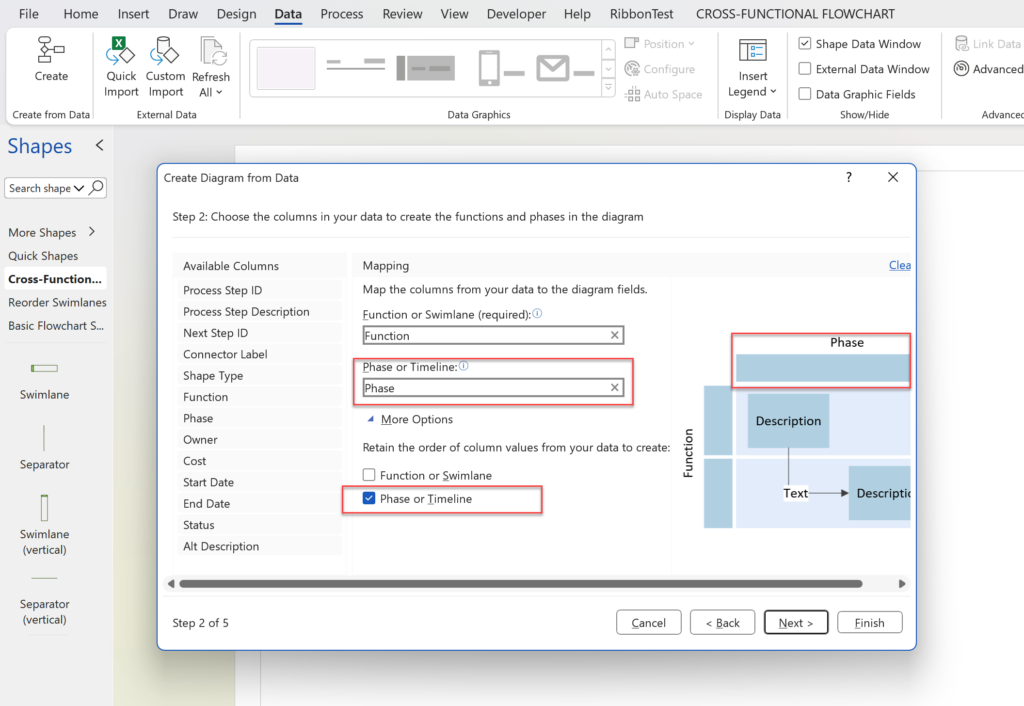
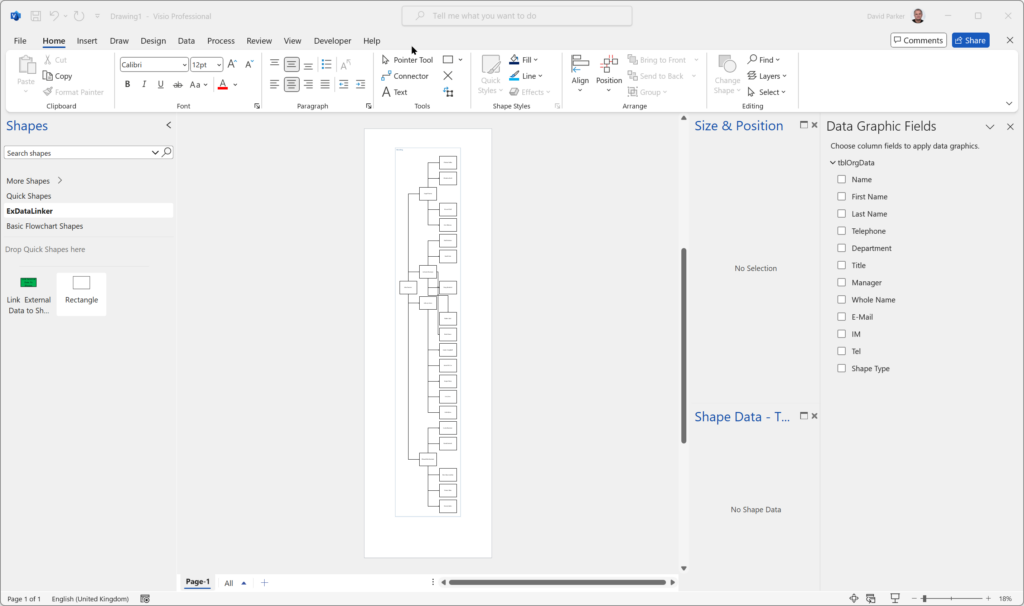
Microsoft Visio desktop Plan 2 and Professional editions provides the ability to create and synchronize cross-functional flowcharts between the diagram and an Excel table. This is great, and widely used for many types of processes. The Excel table normally has a Function / Swimlane column that contains text that becomes labels on the swimlane containers, and a Phase / Timeline column that contains text that becomes the label of the phase or separator containers. The import provides the option to order the diagram by Function and/or Phase, but it is impossible to get them ordered by both! This article provides a solution using a free macro-enabled Visio stencil.
[Read more…] about Optimize Visio Flowcharts: Swimlane Reordering TipsData Visualizer
Linking Data to Shapes in Visio after using Data Visualizer
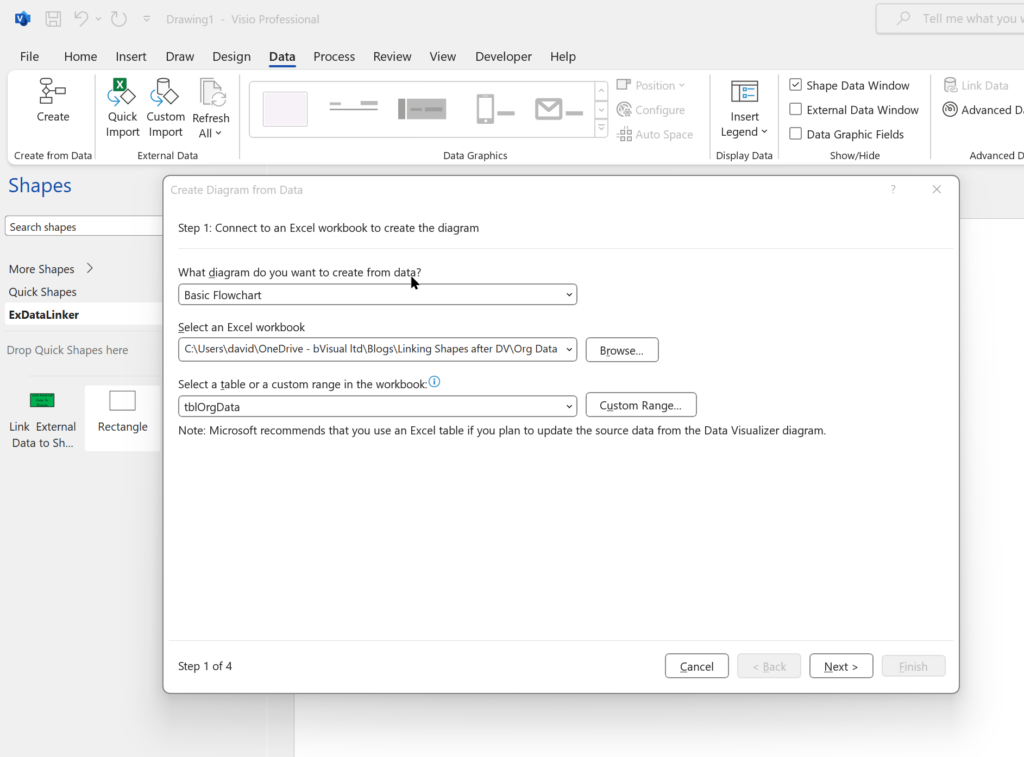
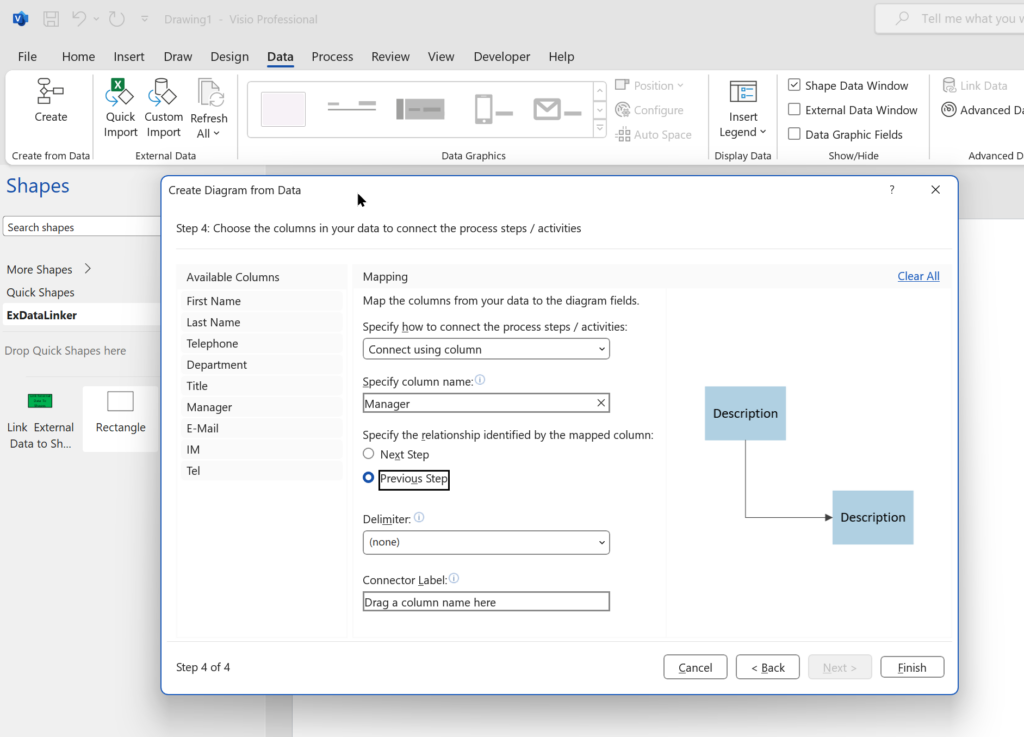
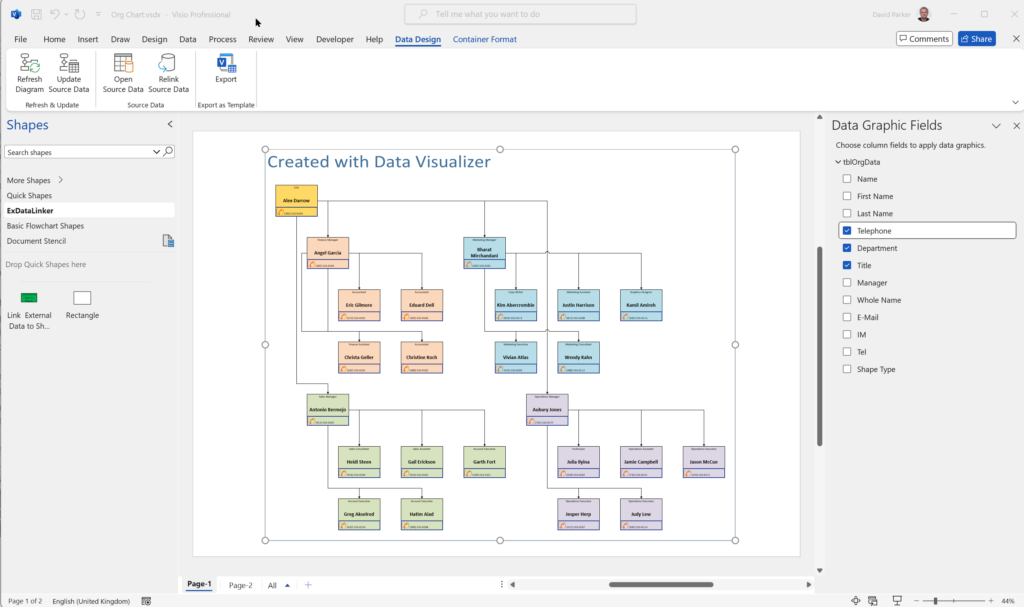
Data Visualizer (DV) in Visio Plan 2 (Data | Create from Data | Create ) is great because it provides a way of automatically creating a diagram from data, but it also prevents some of the other data-linking features in Visio from being used. This is because DV wants to take control of the data in the shapes to provide refreshes from the data source or send updates to the data source. This can be very annoying if you use DV to create the initial layout, then you enhance this, so it looks just perfect, and then you just want to update some of the data without affecting the layout. DV may re-layout your carefully crafted diagram, even if there are no updates to the data that should do that. Also, you may want to integrate data from other sources that were not available or accessible to the table or query used for by Data Visualizer. This is when you may want to use Data | External Data | Custom Import which also provides a much greater number of data source types. In this article, you will learn how you can do this manually, or automate it with the help of a little VBA code (or similar).
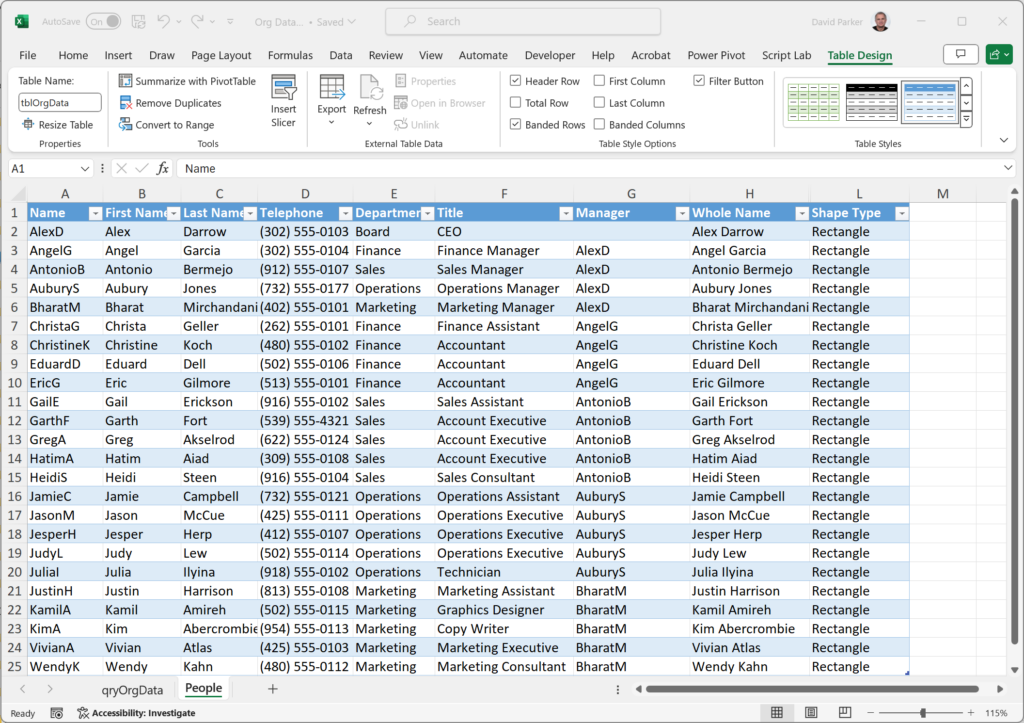
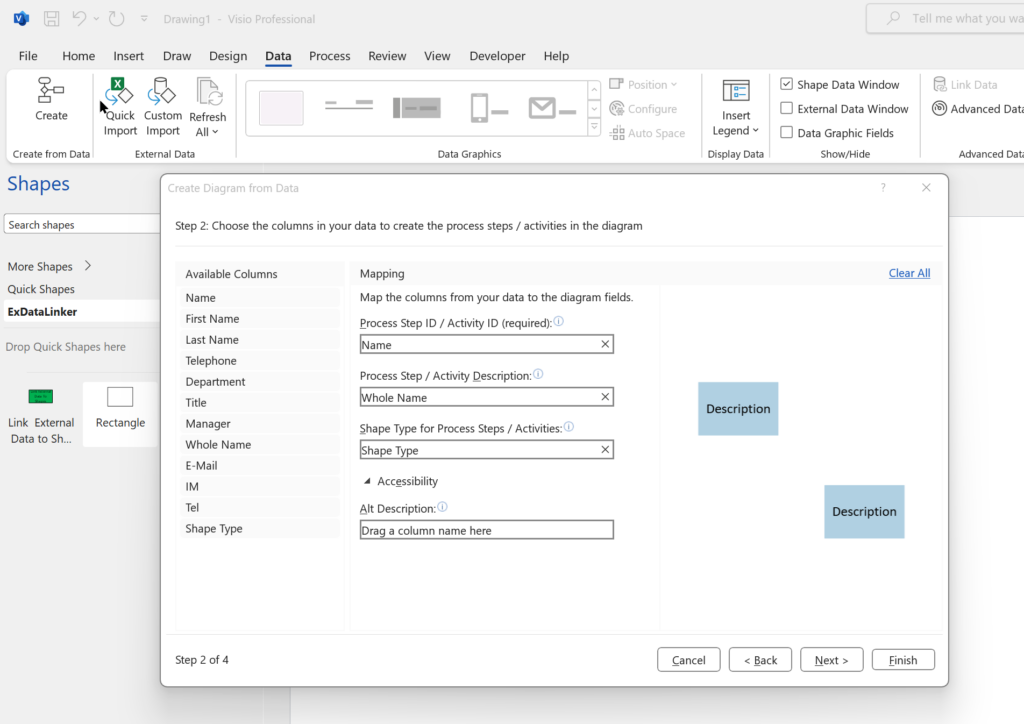
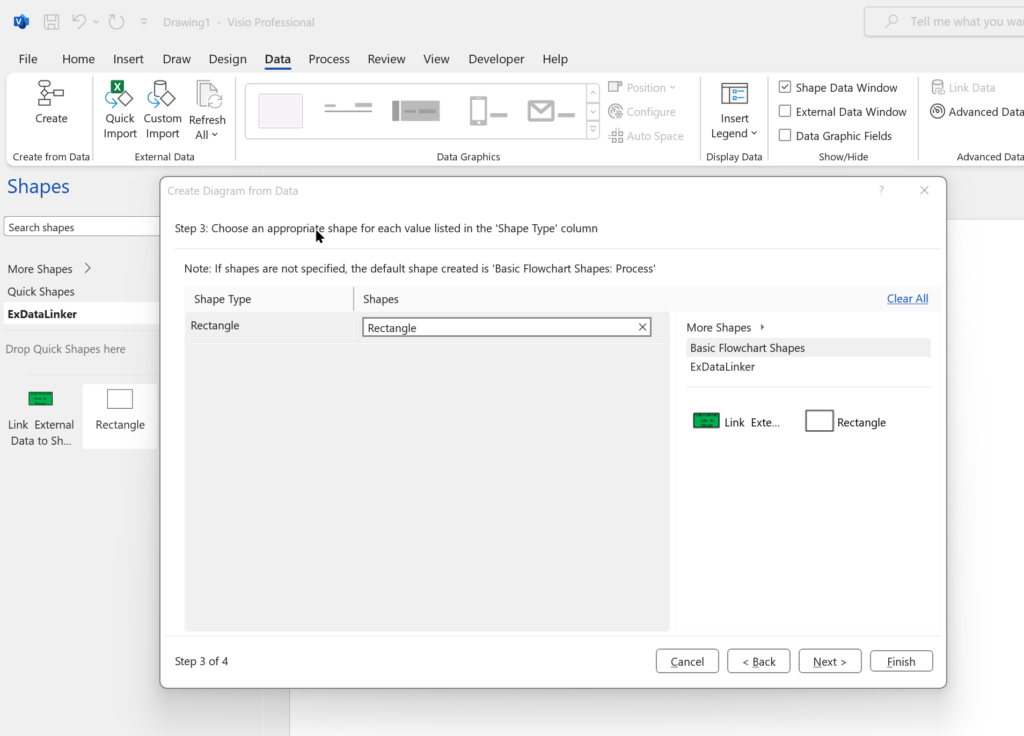
In this example, I have used table of personnel that I have used before, but added an extra column, Shape Type, that simply has the value Rectangle, which is simply the name of a simple Master shape that I have added to my macro-enabled stencil, ExDataLinker.vssm.
[Read more…] about Linking Data to Shapes in Visio after using Data VisualizerMy new book on Visualizing Processes with Microsoft Visio has launched
Back in the early 1990s, there was an application called ABC Flowcharter that was the market leader for diagramming business flowcharts, but some of the brains behind Aldus PageMaker saw an opportunity to create something smarter, and left to write the Visio product, with the stated aim to overtake ABC Flowcharter within 2 years. They did it in just 18 months and Visio expanded to cover more types of diagramming, especially organization charts and network diagramming. Visio became the default vector-based, data-diagramming application for the desktop, and so Microsoft acquired the company in 2000, who started to integrate it with Microsoft Office applications. Many imitators on the desktop tried to emulate Visio, but most fell by the wayside. There were constant requests for Visio to work on Apple Macs, but Microsoft resisted making a Mac specific version, and instead started to make Visio work in a web-browser, so it can work anywhere on any modern device. There are literally millions of lines of code on Visio, so it was never going to be straightforward or easy, but now we do have a light edition of Visio provided to all M365 business subscribers, and two extra subscription levels for more features and capabilities. We still have desktop Visio Standard and Professional, but the edition that straddles both the desktop and web is Visio Plan 2. It has some desktop only features delivered via web-services, and an enhanced browser-based editing experience. Visio Plan 2 is the edition for heavy or advanced users, but any of the desktop editions can be viewed as a design studio for content that can be used by the browser users because of Visio’s unique ShapeSheet feature that contains Excel-like formulas to control the properties of the shapes. Almost all of these formulas work in the web browser, but desktop Visio is required to write the formulas initially. This means that powerful customizations are possible without any web-scripting, and achievable by anyone who can write formulas in Excel!
So, this new book focuses on the original driver for Visio, process flowcharts, and explains how the different Visio editions can be used to create, edit, collaborate, comment, present, automate, export them, and finally how to customize them. Find out more at Visualize Complex Processes with Microsoft Visio!

Pushing Data Visualizer in Visio beyond its limits
My last post was about some of the lessons learnt when trying to push Data Visualizer to its limits, but this one has some ways of overcoming these limitations. The main lesson learnt is that DV binds the shapes within the DV container shape, CFF Data Visualizer, and controls some of the ShapeSheet cells that are normally available for customization. The label of the connector is bound to the respective column in the Excel table, and that, combined with the ability to modify the Dynamic connector master shape provides a way of overcoming some of the limitations discovered.
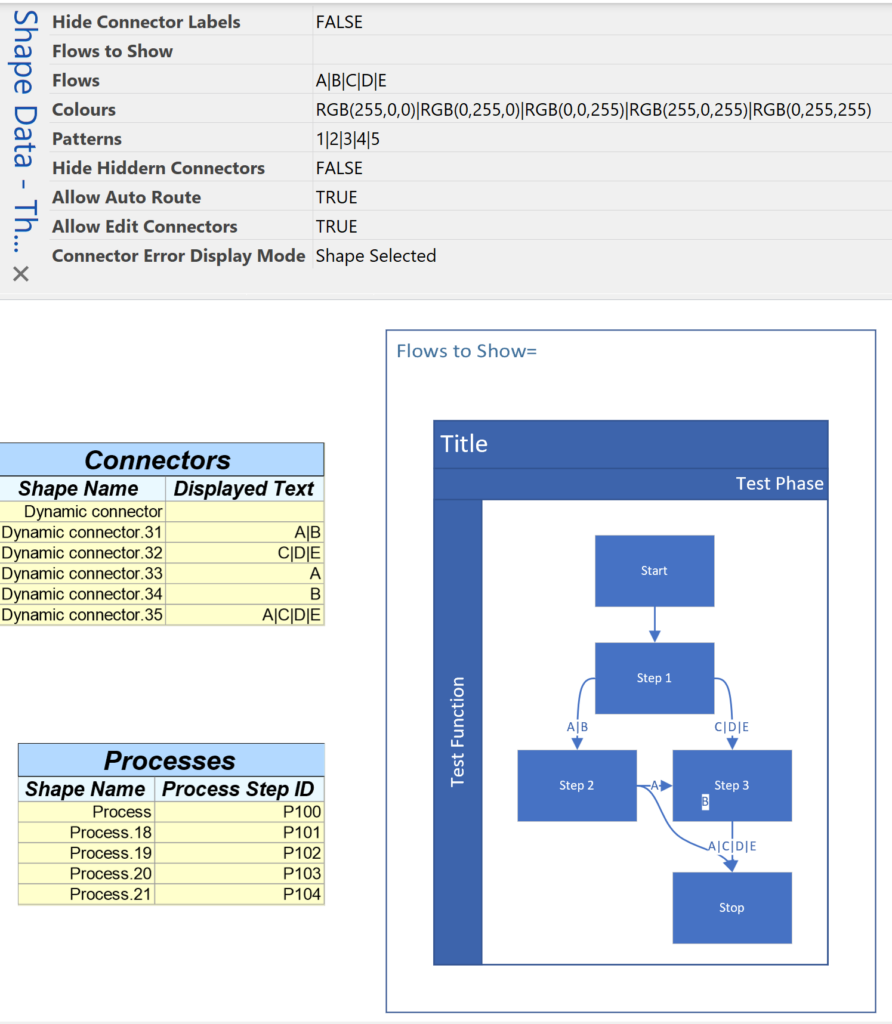
So, given that we want to use DV, and we need to have multiple flows between the same shapes, then they cannot be separate connectors. We need to combine multiple flows onto the same connector, and then find a way to selectively display different flows somehow by controlling the visibility of the connectors. However, we cannot make them invisible because they will be deleted by DV, so we need to control their transparency instead. We can do this by interpreting the label somehow, and we are going to modify the Dynamic connector to react to the text of the label, and we can also change the colour and line pattern too.
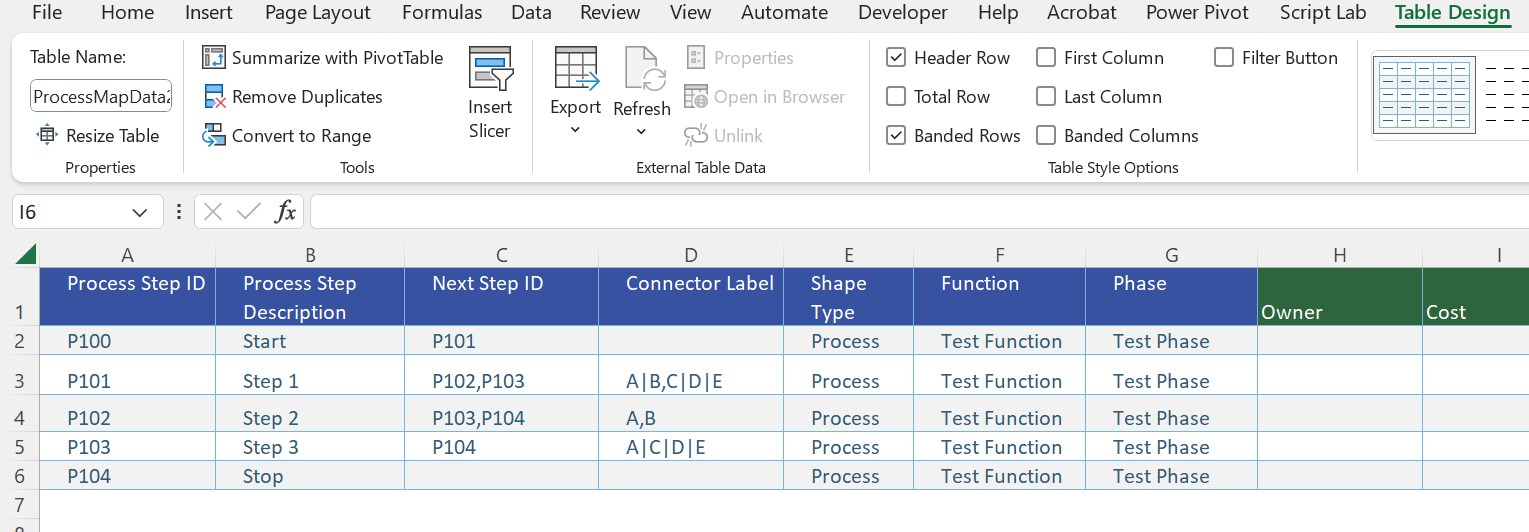
The following screenshots show the Excel table with the multiple flows between the same shapes concatenated with pipe characters, and the diagram created by Data Visualizer when this table is imported into a custom template using Data \ Create from Data \ Create:
[Read more…] about Pushing Data Visualizer in Visio beyond its limitsPushing Data Visualizer in Visio to the limits!
Regular readers of my blog will know that I like to use the Data Visualizer (DV) in Visio Plan 2, but I recently tried to help a user who really decided to push it to the limits. In this scenario, there were multiple connections, but with different labels, being created between the same flowchart shapes, and the plea was how to make it work! Well, I experimented with this, and found that DV does not really work well in this way, and then proposed an alternative approach, which I will explain in this article.
First, I will show how it fails by setting up an Excel table that does contains multiple connections, but fails to update the labels consistently.

Teams Tuesday Podcast Recording about Visio
I am delighted to share the link to my recent demonstration and conversation with fellow MVP Peter Ward about Visio in Teams. We discussed more than just Visio … and I look a bit like Max Headroom!

