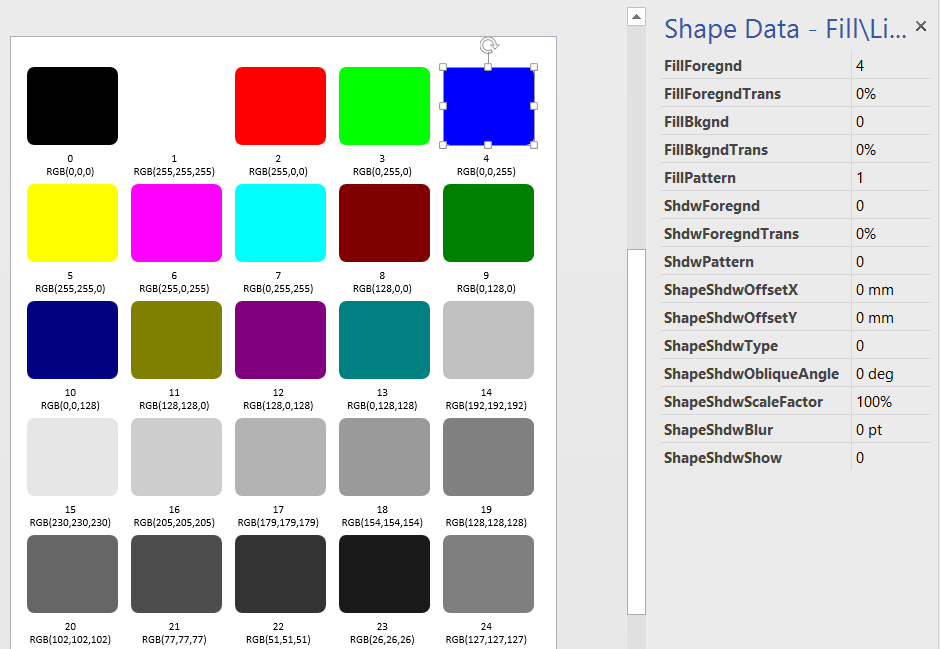
This is just a quick note to say that I have just had a blog post published on a Microsoft web-site. It is a very selective history of messaging and encryption, using Visio SmartShapes to demonstrate some aspects of this : download a pdf of the article because the original website has been archived.
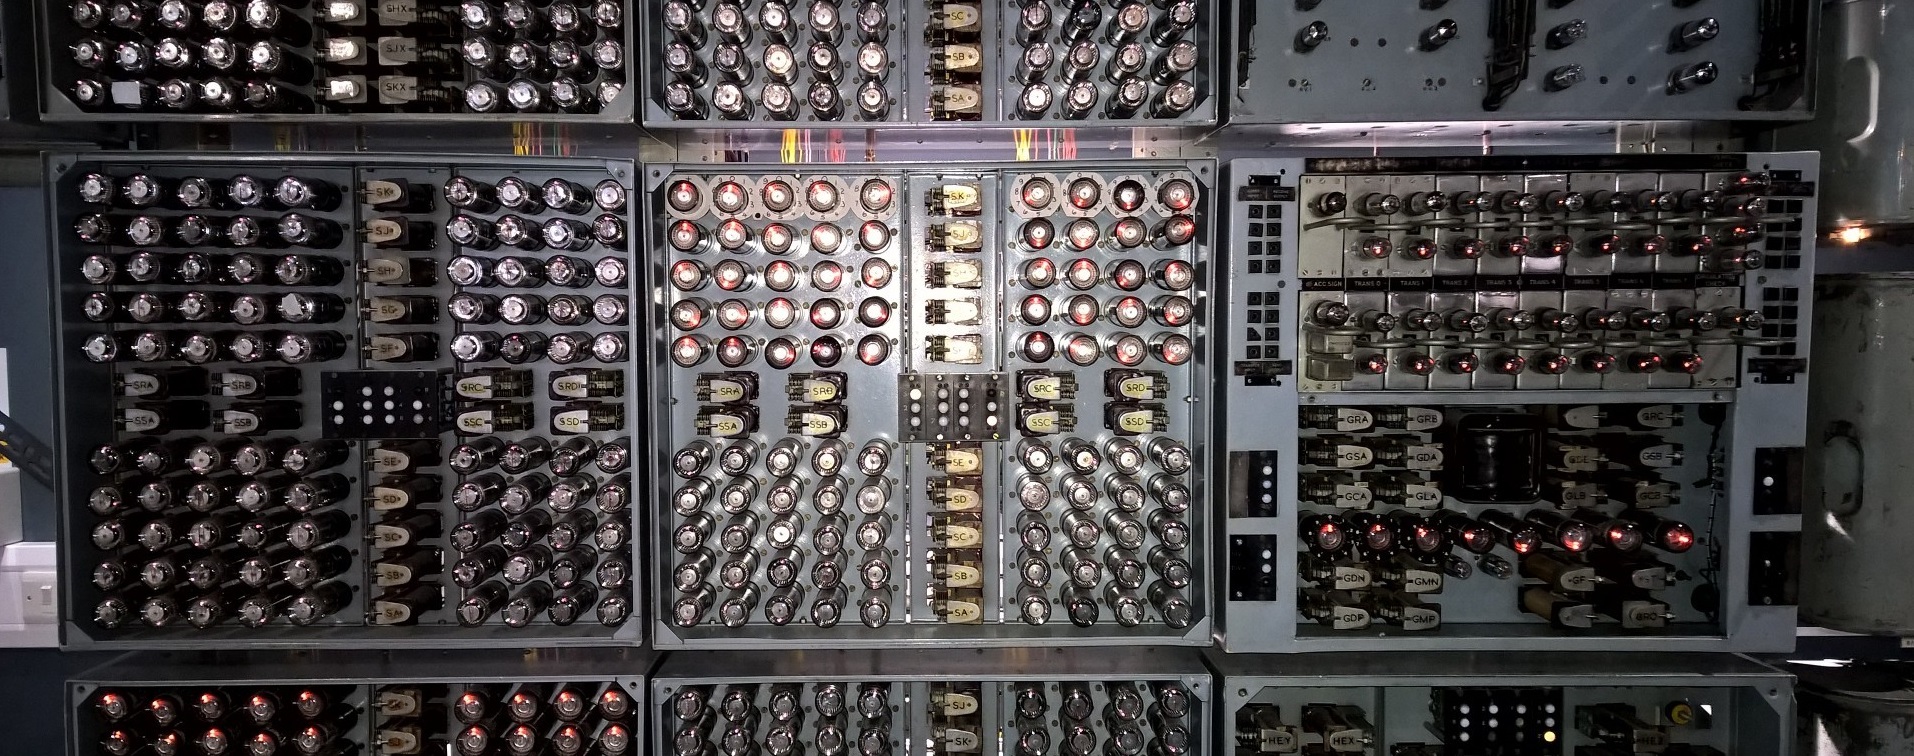
You too an visit The National Museum of Computing at http://www.tnmoc.org/