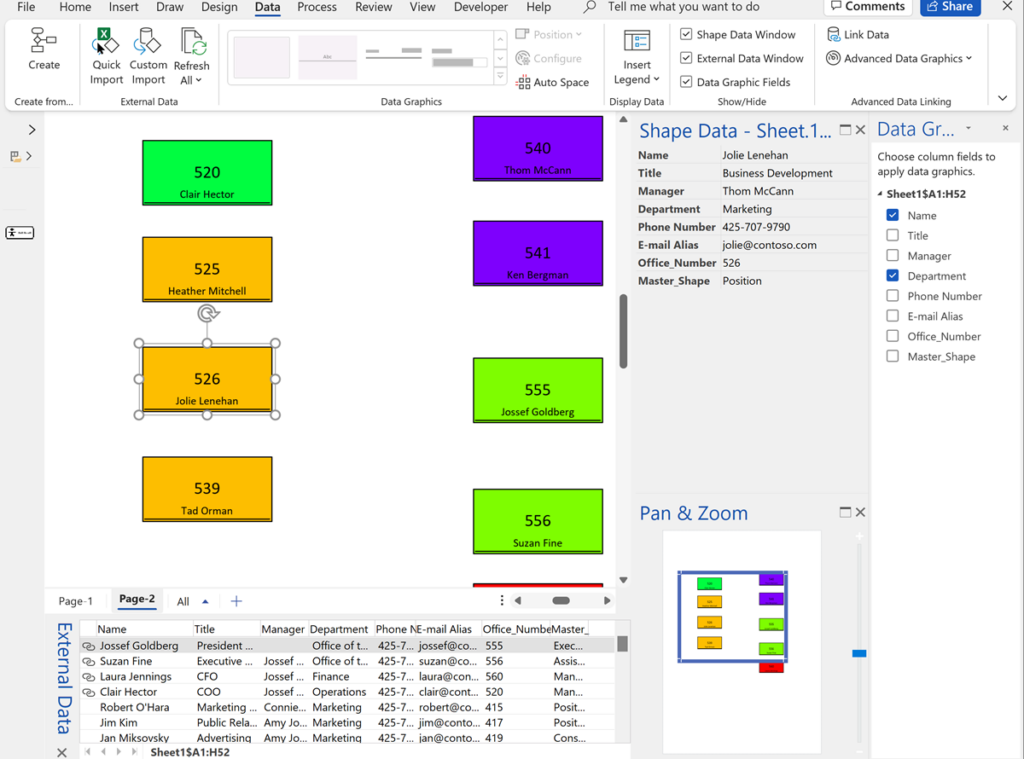
• Skip to main content
  • Skip to primary sidebar
  • Skip to footer

bVisual

  • Home
  • Services
    • How Visio smartness can help your business
    • Visio visual in Power BI
    • Visio Consulting Services
    • Visio Bureau Services
    • Visio Training and Support Services
  • Products
    • Visio Shape Report Converter
    • SS Plus
    • LayerManager
    • visViewer
    • Metro Icons
    • Rules Tools for Visio
    • The Visio 2010 Sessions App
    • Multi-Language Text for Visio
    • Document Imager for Visio
    • multiSelect for Visio
    • pdSelect for Visio
  • Case Studies
    • Case studies overview
    • Visualizing Construction Project Schedules
    • Visio Online Business Process Mapping
    • Nexans Visio Template
    • CNEE Projects, WorldCom
    • Chase Manhattan Bank
  • News
    • Recent news
    • News archive
  • Resources
    • Articles➡
      • ShapeSheet Functions A-Z
      • Comparing Visio for the Web and Desktop
      • Customising Visio Shapes for the Web App
      • Key differences between the Visio desktop and web apps
      • Using the Visio Data Visualizer in Excel
      • Using Visio in Teams
      • Creating Visio Tabs and Apps for Teams with SharePoint Framework (SPFx)
      • Designing Power Automate Flows with Microsoft Visio
      • Innovative uses of Visio Lists
    • Webcasts ➡
      • Visio in Organizations
      • My session and other Visio sessions at MSIgnite 2019
      • Power up your Visio diagrams
      • Vision up your Visio diagrams
      • The Visio 2010 MVP Sessions
    • Visio Web Learning Resources
    • Books➡
      • Mastering Data Visualization with Microsoft Visio
      • Microsoft Visio Business Process Diagramming and Validation
      • Visualizing Information with Microsoft Visio
  • Blog
    • Browse blog articles
    • Visio Power BI articles
    • Visio for Web articles
    • A history of messaging and encryption
  • About us
    • About bVisual
    • Testimonials
    • Bio of David Parker
    • Contact Us
    • Website Privacy Policy
    • Website terms and conditions
    • Ariba Network

Shape Data

Published on September 4, 2019 by David Parker

Testing Visio shape text for WCAG 2.0 pass

The Web Content Access Guidelines (WCAG) 2.0 provides the current recommendations for making web content accessible to users with vision impairment, but how do you test if your Visio shapes pass? There are several web sites out there that provide this capability, but all of them require the HEX values, rather than the RGB or HSL that Visio provides natively. Therefore, I have created a Visio callout shape that can be associated with a target shape to report on the values of each of its main color elements, and provides hyperlinks to automatically check the contrast ratio on WebAIM.

Color Values Shape


The colour formats that can be selected from either the Shape Data window or the right mouse menu are:

[Read more…] about Testing Visio shape text for WCAG 2.0 pass

Filed Under: Accessibility, Color, Shape Data, Visio, Visio Online Tagged With: Accessibility, Hyperlinks, Shape Data, WCAG

Published on August 8, 2019 by David Parker

Multi-line text in Visio Shape Data

The Shape Data (nee Custom Properties) dialog and window only provides a single line to view or edit text values. It is a great shame because the value can be up to 64k characters, and long text can be pasted into it. I, and many others, have complained about this for many years to Microsoft, but nothing has been done to rectify this. Of course, I do develop custom user interface components for many customers, but that is not always desirable. Therefore I sometimes re-purpose standard Visio elements to provide the ability to view or edit multi-line text in Shape Data rows.

  • Description Shape Data row
  • Edit using ScreenTip or Action
  • Scrollable multi-line text
    Scrollable multi-line text
  • The first 248 characters are displayed on mouse hover
  • Simple ShapeSheet formulas to do this
[Read more…] about Multi-line text in Visio Shape Data

Filed Under: Shape Data, ShapeSheet Formulas, Visio Tagged With: Shape Data, ShapeSheet, ShapeSheet Functions

Published on July 5, 2019 by David Parker

Understanding Visio Navigation Order

Visio defaults to tabbing from shape to shape in the order that the shapes are added to the page. However, this can end up with an illogical order if you are trying to navigate a diagram with the keyboard, which is often an accessibility requirement. Fortunately, Visio provides a Diagram Navigation pane so that the tab order can be changed, but how does it do it? The following short video shows how the navigation order, displayed as numbers in each shape, is assigned a value as soon as the order is edited.


Accessibility is important in my current project, so understanding how this happens was important to understand, and to surface this order to JavaScript, as we want to list the shapes in a logical order too.
I managed this by adding a User.visNavOrder to the master shape of all the significant masters, and a hidden Shape Data row, labelled “Navigation Order“. This has the following formula for its value:

[Read more…] about Understanding Visio Navigation Order

Filed Under: Accessibility, ShapeSheet Formulas, SharePoint, Visio, Visio Online Tagged With: Accessibility, Shape Data, ShapeSheet

Published on March 7, 2019 by David Parker

Changing Visio Shape Size and Angle with Linked Data

I was recently laying out a computer room floor plan to scale in Visio, from survey data of the cabinets\racks within it, and it occurred to me that I could work a bit smarter than I first thought. Originally, I was going to just add lots of rectangles, size them, rotate them, and label each them with their name. Then I thought, why not use the Width, Depth and Name columns from the survey data to do most of the work for me? It was so simple to do, and only took a few minutes, so I thought I would share my methodology because it demonstrates how easy it is to work smarter with Visio….

These are the simple steps shown above, written out for your education….

[Read more…] about Changing Visio Shape Size and Angle with Linked Data

Filed Under: Excel, External Data, mFormula, ShapeSheet Formulas, Visio Tagged With: Shape Data, Shape Design, ShapeSheet, ShapeSheet Functions

Published on June 5, 2018 by David Parker

Data Centre Racks in Visio in PowerBI

I have often diagrammed rack and cabinet layouts and elevations using Visio linked to a database or Excel tables. There is a Rack Diagram template in Visio which is great for manually creating cabinet elevations manually, but there is nothing currently out of the box to automate this process, so it can be a laborious task unless you have some custom code. It is quite simple to draw a computer room layout of the racks and cabinets and to link each one to a row of data. In this article, I have a table of rack equipment in Excel, and used PowerQuery in PowerBI to summarize these rows for each data center, rack and U height position, since there are sometimes more than one item of equipment per U height. In this example, I have color coded the criticality of each equipment such that the most important display as red, and the least important as green. This means that a PowerBI user can quickly see where the critical racks, U heights and equipment are. Of course, I could have used any metric, such as power consumption, heat output or humidity, for the colour-coding. It all depends on the data available, and the audience for the report.

[Read more…] about Data Centre Racks in Visio in PowerBI

Filed Under: Network Diagrams, PowerBI, Visio Tagged With: Excel, PowerQuery, Shape Data

Published on February 13, 2018 by David Parker

Using JSON text in Visio shapes

I often create Visio masters with a fixed number of Shape Data rows, and sometimes I get requests to modify them because of changes in business needs. Well, my previous posts about Graph Databases got me thinking if it would be possible to embed JSON text in Visio shapes in some sort of meaningful way. Then the user could enter just attribute-value pairs at will, without the need for me to modify their master shape. Alternatively, the data could be inserted into the shape from a database, such as SQL server. So, in this article I discuss the suitability of JSON text in Visio shapes.

[Read more…] about Using JSON text in Visio shapes

Filed Under: Graph Database, JSON, Shape Data, ShapeSheet Formulas, SQL Server, Visio, Visio 2016 Tagged With: GraphDatabase, JSON, Shape Data, ShapeSheet

  • « Go to Previous Page
  • Go to page 1
  • Go to page 2
  • Go to page 3
  • Go to page 4
  • Interim pages omitted …
  • Go to page 8
  • Go to Next Page »

Primary Sidebar

  • LinkedIn
  • Twitter

Recent Posts

  • Pushing Data Visualizer in Visio beyond its limits
  • Pushing Data Visualizer in Visio to the limits!
  • Teams Tuesday Podcast Recording about Visio
  • Linking Data to Visio Shapes in Code
  • Editing Visio Layer Colours with LayerManager

Categories

Tags

Accessibility Add-Ins Connectors Containers Data Export Data Graphics Data Import Data Visualizer Educational Excel GraphDatabase Hyperlinks Icon Sets JavaScript Layers Legend Link Data to Shapes Lists MSIgnite MVP Office365 Org Chart PowerApps PowerBI PowerQuery Processes Shape Data Shape Design ShapeSheet ShapeSheet Functions SharePoint 2013 SQL Teams Themes Validation VBA Video Visio Visio 2007 Visio 2013 Visio for the Web Visio Online Visio Services Visio Viewer Webinar

Footer

bVisual Profile

The UK-based independent Visio consultancy with a worldwide reach. We have over 25 years experience of providing data visualization solutions to companies around the globe.

Learn more about bVisual

  • LinkedIn
  • Twitter

Search this website

Recent posts

  • Pushing Data Visualizer in Visio beyond its limits
  • Pushing Data Visualizer in Visio to the limits!
  • Teams Tuesday Podcast Recording about Visio
  • Linking Data to Visio Shapes in Code
  • Editing Visio Layer Colours with LayerManager

Copyright © 2023 · Executive Pro on Genesis Framework · WordPress · Log in