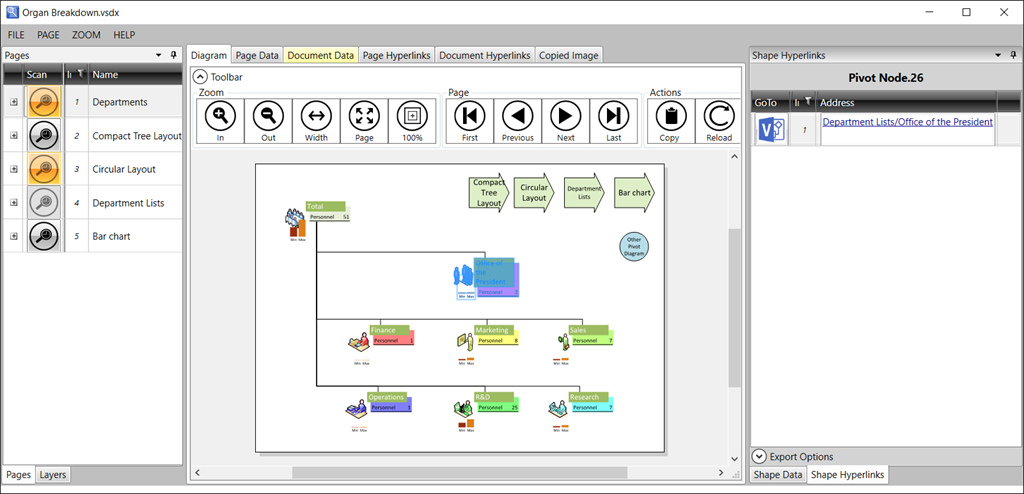
I have made some small improvements to my visViewer application ( see http://www.visviewer.com/ ), and it will now work with the Microsoft Visio Viewer 2016 edition ( see Download Microsoft Visio 2016 Viewer from Official )
I have made some small improvements to my visViewer application ( see http://www.visviewer.com/ ), and it will now work with the Microsoft Visio Viewer 2016 edition ( see Download Microsoft Visio 2016 Viewer from Official )


I have a new book on Visio coming out in June called Mastering Data Visualization with Microsoft Visio Professional 2016. It covers the ins and outs of data with Visio!
Please visit http://bit.ly/1SeVfwW for more information.
Packt Publishing are currently running a deal on my last book, Microsoft Visio 2013 Business Process Diagramming and Validation , until 12th April 2016:
Follow this link : 1LHNDwI
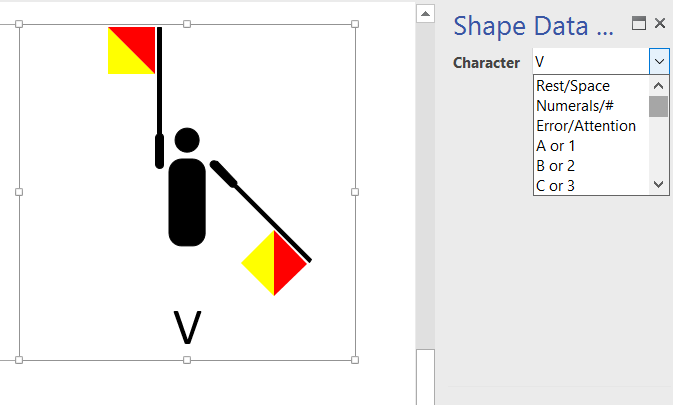
My good friend and fellow Visio MVP, John Goldsmith, aka visualsignals.co.uk, was telling me about a family visit to a semaphore tower over the weekend. Well, I just couldn’t resist making a flag semaphore shape in Visio. First, I looked up semaphore up Wikipedia https://en.wikipedia.org/wiki/Flag_semaphore .
The character can easily be changed with the Shape Data panel … and watch the arms rotate … best with a wheel mouse rolling up and down in the Character drop-down
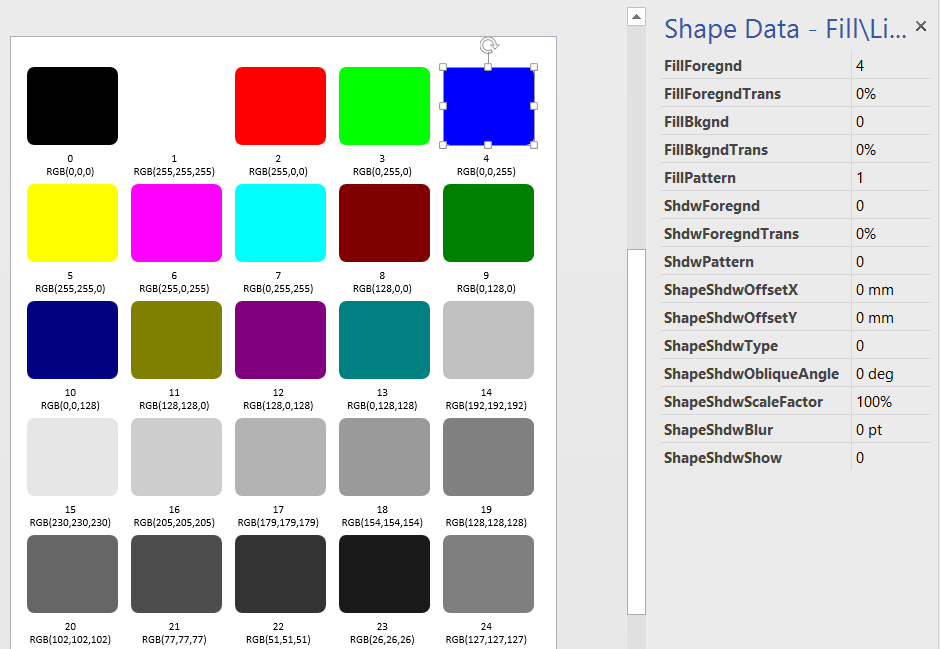
[Read more…] about Visio Rocks for Flag Semaphore … or another use of ListsA few years ago, I wrote an article about displaying the RGB value of shapes ( see http://blog.bvisual.net/2010/04/22/displaying-the-rgb-values-of-shapes ). I had forgotten about it, but a reader recently asked if it was possible to force the Foregnd field to display the RGB value for the standard color palette values. For example, red is number 2 in the palette, and has a value of RGB(255,0,0). In revisiting the article, I realised that there is a smarter way to display the values, without the need of any macros.
I simply created a master shape that exposes each of the cells in the Fill and Line sections as Shape Data rows. This allows me to enter values in the Shape Data window and see the effect on the shape immediately. So, it was easy to drop one shape, insert text fields, and then use the Array Shapes tool to layout the shapes. Finally, I just entered the the standard color map numbers 0 to 24 in the FillForegnd Shape Data row.
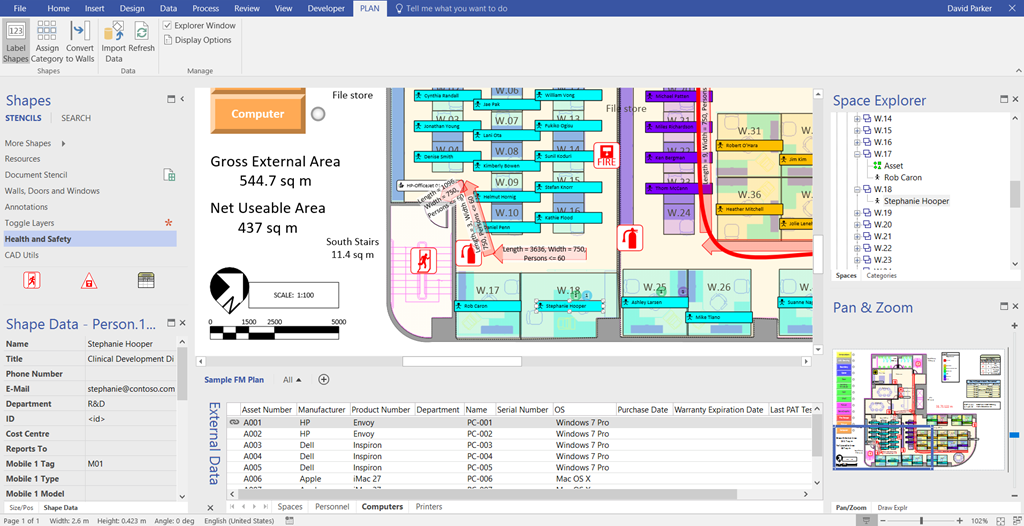
Today I demonstrated how Visio could be used for Facilities Management. I covered CAD integration, space chargeback, personnel and asset locations, and finished off with fire escape routes and equip.
You can register for see the recording, and get the pdf of the slide deck, at https://vts.inxpo.com/Launch/QReg.htm?ShowKey=27721 .
I have made some of the materials available from my OneDrive – Sample CAD file, Excel data and Visio Drawing : https://1drv.ms/f/s!AqkzN8kb1lAzlspZ6XOX4d-sI4royw
A screenshot of the Visio drawing
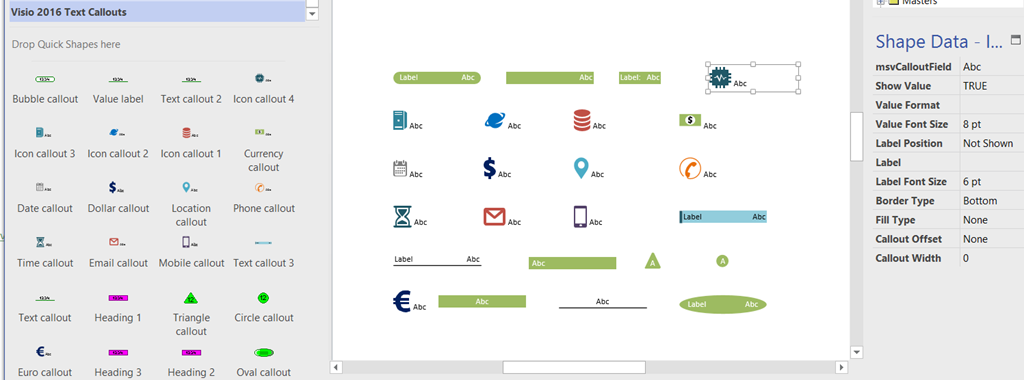
Last year, I blogged about using the master shapes used in Data Graphics in Visio 2013 Professional for displaying data directly, rather than embedded in other shapes as graphic items. Now that Visio Professional 2016 is released, and because there have been some improvements to the graphics, especially for Text Callouts, I have created stencils from the new masters, with some slight changes as outlined in my earlier articles. As before, the stencils can be downloaded into the My Shapes folder, from where they will be available for use at any time. These stencils are freely available to anyone with a Visio Professional 2016 license.