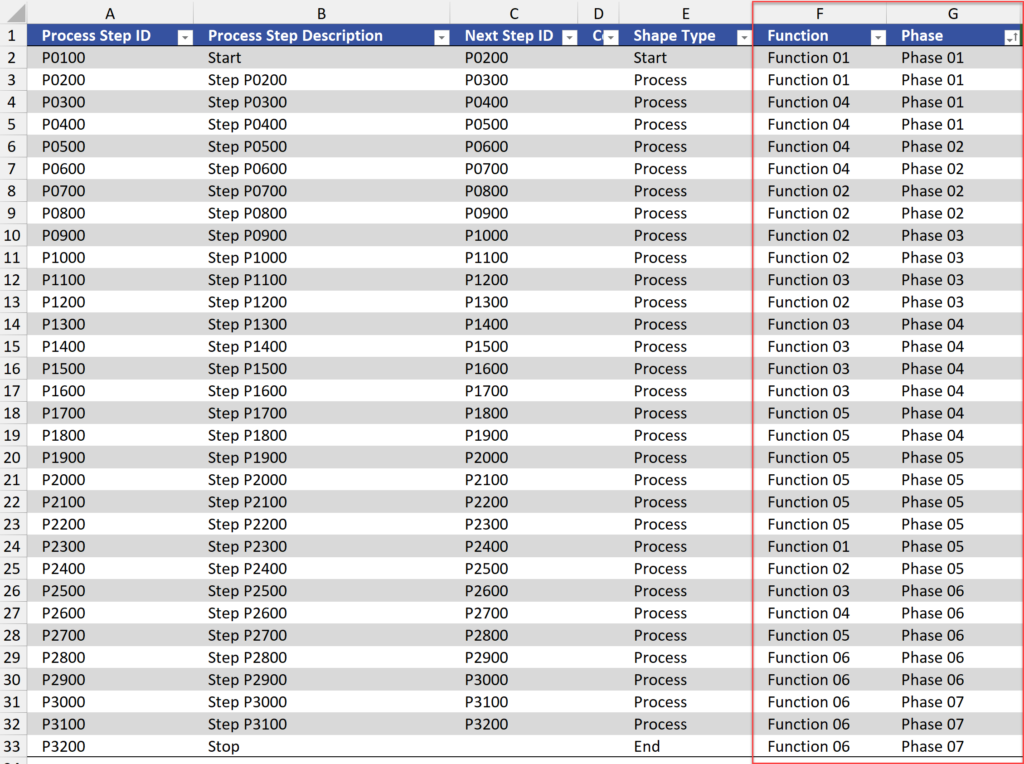
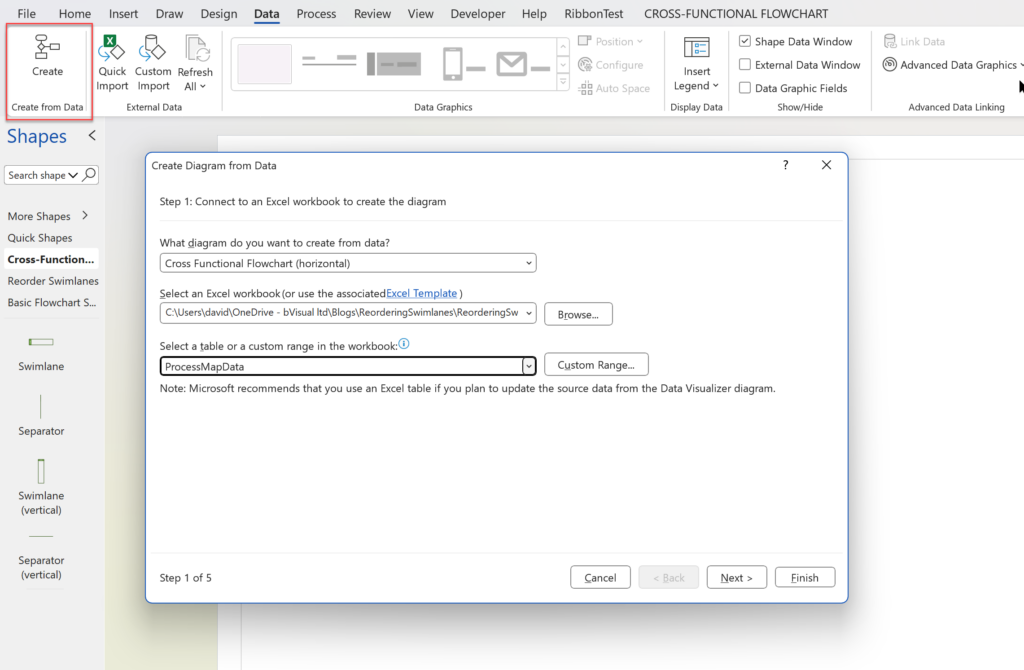
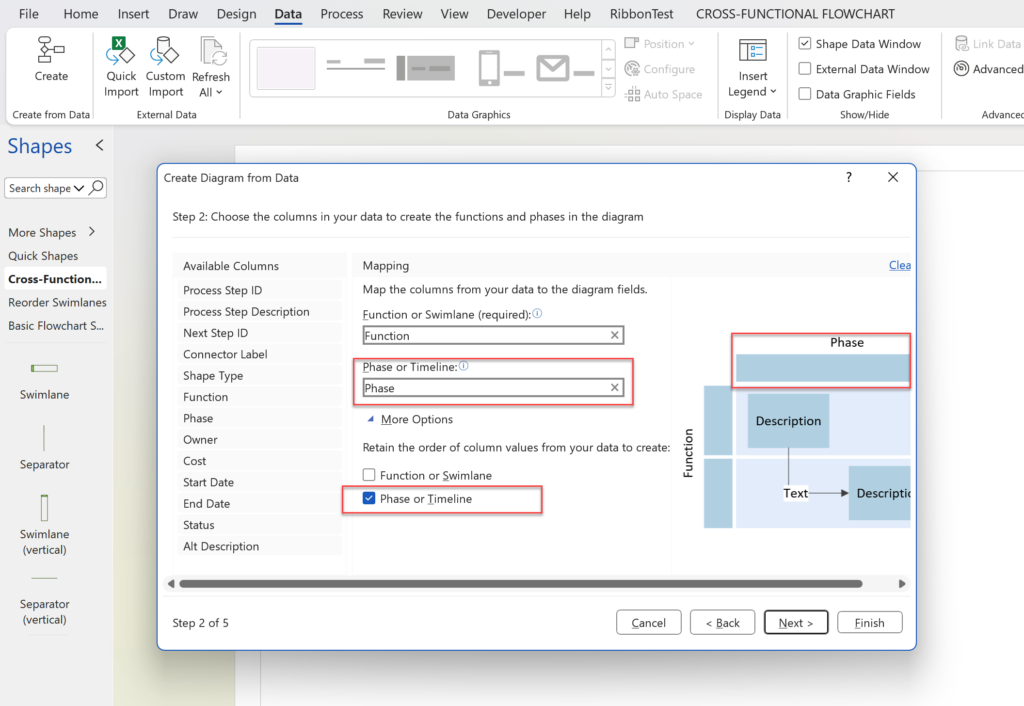
Microsoft Visio desktop Plan 2 and Professional editions provides the ability to create and synchronize cross-functional flowcharts between the diagram and an Excel table. This is great, and widely used for many types of processes. The Excel table normally has a Function / Swimlane column that contains text that becomes labels on the swimlane containers, and a Phase / Timeline column that contains text that becomes the label of the phase or separator containers. The import provides the option to order the diagram by Function and/or Phase, but it is impossible to get them ordered by both! This article provides a solution using a free macro-enabled Visio stencil.
[Read more…] about Optimize Visio Flowcharts: Swimlane Reordering TipsExcel
Visio Shape Report Converter Excel add-in available
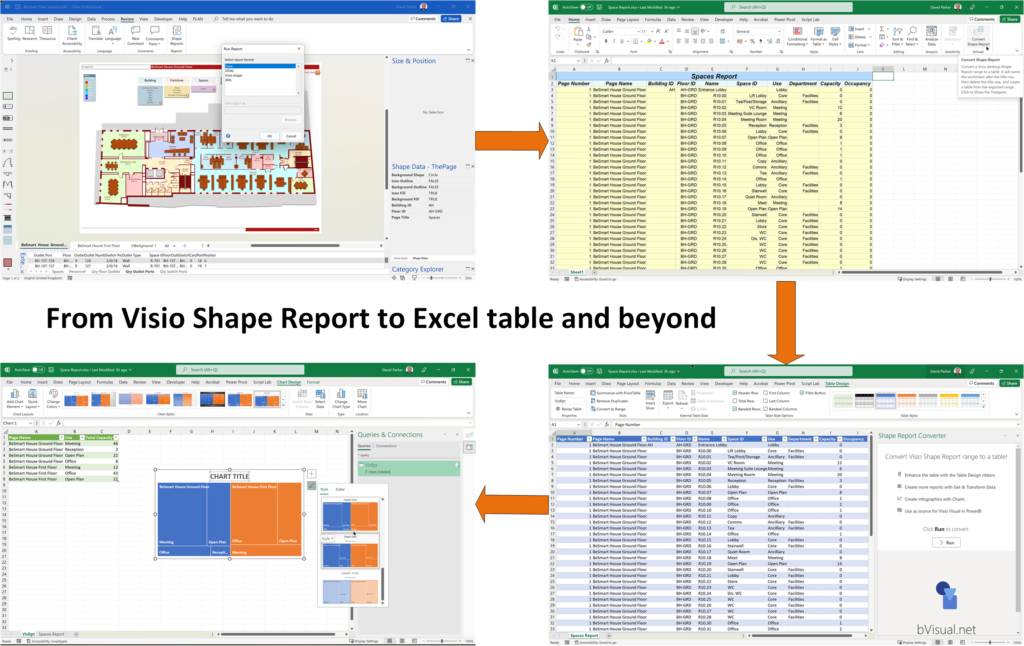
I am delighted to announce that I have just had my first Excel add-in accepted in the Office Add-ins Store! It is called Shape Report Converter because all it does is convert a Shape Report converted from Visio for Desktop to a modern Excel table with one click!
It isn’t a complicated add-in, and it doesn’t do anything that you can’t do manually, but it does save time, and ensures consistency … and it is free!
[Read more…] about Visio Shape Report Converter Excel add-in availableBinding Visio and Excel with Data Visualizer
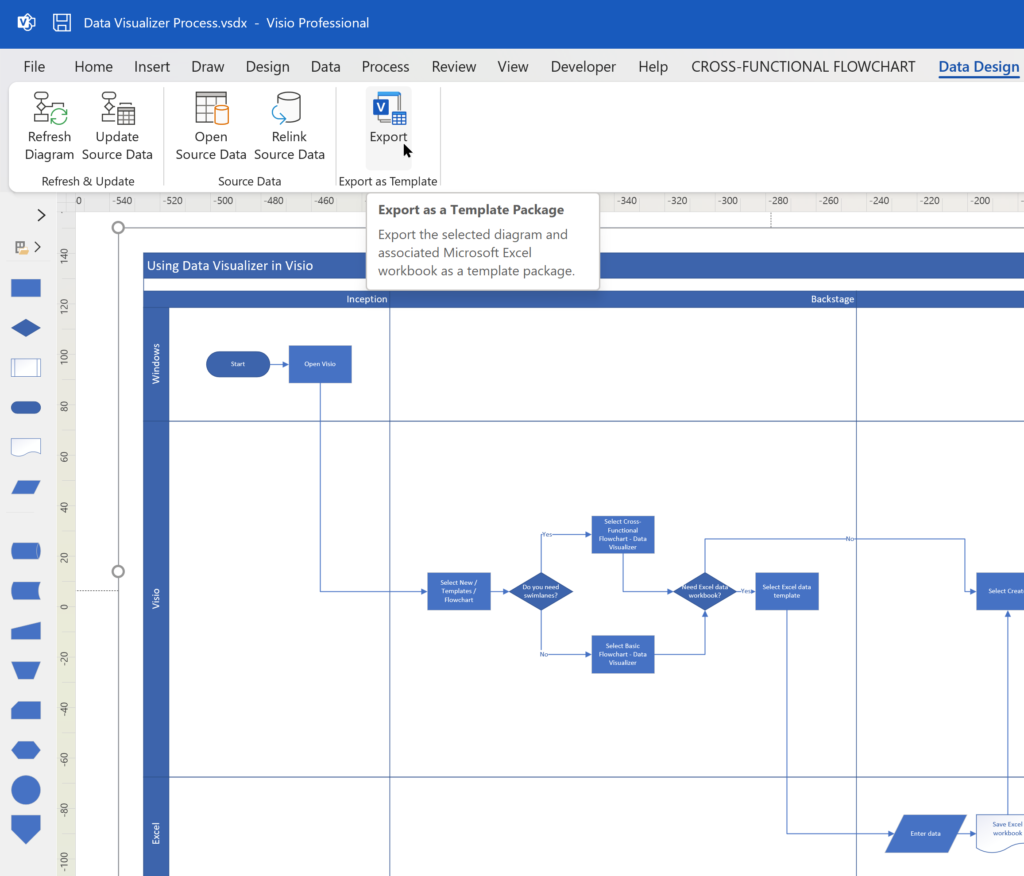
I re-vamped some of my content about the Visio Data Visualizer add-in for Excel in my last post, so I thought I should expand a bit more on the Data Visualizer feature in Visio for Desktop (Visio Plan 2) and Excel for Desktop. I have described it in detail in previous posts, but I never published the process diagram I created for the Data Visualizer Wizard in Visio. So, I thought I would use it to demonstrate a few cool features of Visio for Desktop.
[Read more…] about Binding Visio and Excel with Data VisualizerEditing Visio Data Visualizer in Excel
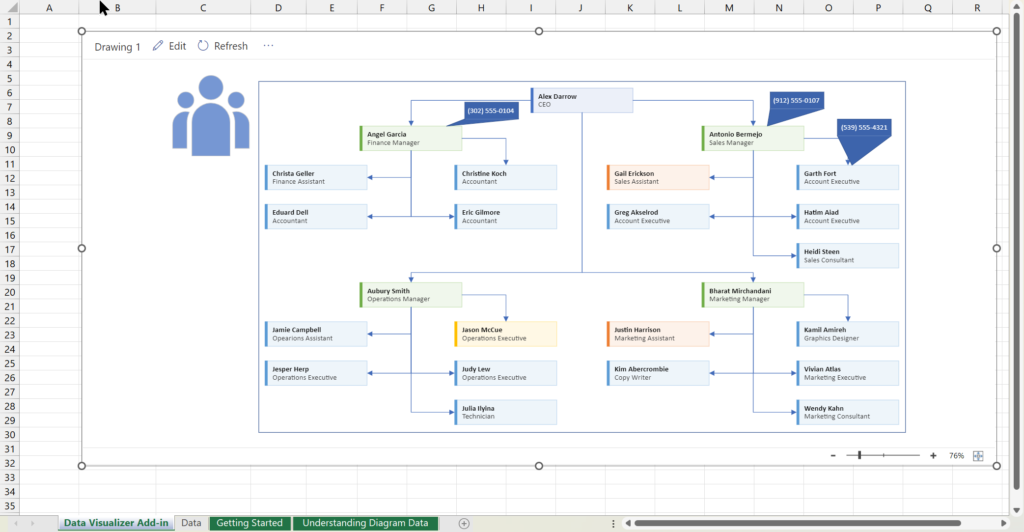
I have previously described how to use the Visio Data Visualizer add-in in Excel, but I didn’t make it clear how you can edit the diagram created if you have a Visio license. So, I have recorded three short videos to briefly explain this.
[Read more…] about Editing Visio Data Visualizer in ExcelSpotting Custom UI Errors in Visio Add-ins
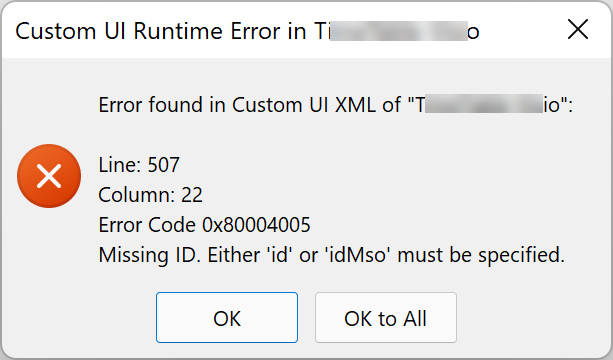
I have written many COM and VSTO add-ins for Visio, but got confused when a client recently reported that the following Custom UI Runtime Error was appearing. I wasn’t getting the same error on any of my test laptops, so I chatted with my good friend, and fellow Visio MVP, John Goldsmith ( John Goldsmith’s visLog (typepad.co.uk) ). He gave me an excellent tip….
[Read more…] about Spotting Custom UI Errors in Visio Add-insVisio Data Visualizer Tips
The Microsoft Visio product team have released a great video introduction to the Visio Data Visualizer, but even that does not reveal all of its power. So, here are some tips about using the Microsoft Visio Data Visualizer add-in in Excel. Firstly, the add-in currently offers three different types of diagram, and each have a number of alternative layout arrangements.
- Basic Flowchart – 4 layouts
- Cross-Functional Flowchart – 5 layouts
- Organization Chart – 5 layouts
Although these are the proposed diagram types, there is no reason why other types of data, such as network devices, cannot be used with any of them.
[Read more…] about Visio Data Visualizer Tips