I recently wrote a series of articles about some of the new capabilities of the Visio desktop and web app.
Using the Visio Data Visualizer in Excel
Creating Visio Tabs and Apps for Teams with SharePoint Framework (SPFx)
Published on by David Parker
I recently wrote a series of articles about some of the new capabilities of the Visio desktop and web app.
Using the Visio Data Visualizer in Excel
Creating Visio Tabs and Apps for Teams with SharePoint Framework (SPFx)
Published on by David Parker
I work a lot with layers in Visio, and written an add-in, LayerManager, to assist, but I was asked an interesting question recently: How can shapes by assigned to layers automatically from a list in Excel? So, I thought I would present my solution. This particular request was for a Timeline diagram, where the Milestone shapes are to be on specific layers. So, I just used one of the samples provided with Visio.
[Read more…] about Assigning Visio Shapes to Layers from Excel TablePublished on by David Parker
Microsoft Visio does have CHAR() and UNICHAR() ShapeSheet functions, just like Excel, but it does not have the inverse CODE() and UNICODE() functions, unlike Excel. However, there is a way to create a formula in the Visio ShapeSheet to provide these functions.
The following worksheet demonstrates how the CHAR(), CODE(), UNICHAR(), and UNICODE() functions work in Excel.
| Column | Formula |
| Index | n |
| Char | =IFERROR( CHAR(INT([@Index])),””) |
| Code | =IFERROR( CODE([@Char]),””) |
| Unichar | =UNICHAR(INT([@Index])) |
| Unicode | =UNICODE([@Unichar]) |
Published on by David Parker
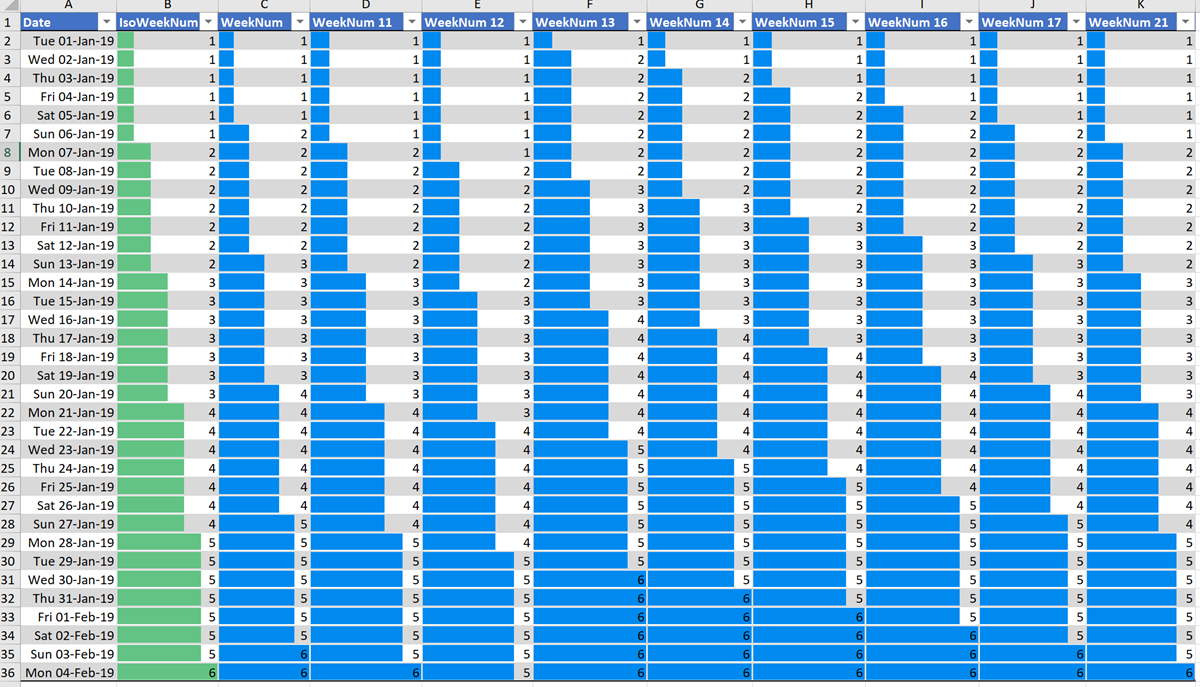
I needed to display the week number of dates in a Visio project of mine, but there is no WeekNum(…) function built-in, so I had to write one, and allow for the date that the week numbers begin in to be varied from 1st January. I also needed to allow for the week numbers to go backwards from the specified week number begin date.
Excel has a WeekNum(..) function, which can take an optional parameter for the day of the week to begin on, and an IsoWeekNum(..) function, and the following table shows the values change for the first 35 days of the year:

[Read more…] about Writing a WeekNum(…) function for Visio
Published on by David Parker
In these days of political uncertainty in the UK, and our position in Europe or the world, there is only one thing that I can say: Sorry about Brexit … in every main language of the EU countries!

Published on by David Parker
I am working on an application where the horizontal axis of the Visio page represents dates from left to right. In fact, the each of the fixed horizontal grids are 1 day, and I need to have shapes that understand the begin date at the left edge of the shape, and the end date at the right edge of the shape. There is, therefore, a number of elapsed days representing by the width of the shape. However, the underlying grid can either represent all days, or it can be changed to only represent weekdays by omitting the weekends. I struggled to find the best formula to calculate the elapsed days or weekdays between two dates in Visio ShapeSheet formulas, so I turned to Excel to provide an inspiration. The Visio ShapeSheet is modelled on the Excel worksheet, and formulas can be entered into the cells in much the same way. However, the available functions differ since Excel is mainly used for arithmetic and statistics, but Visio is used for graphics and data. In this article, I demonstrate how I used C# and Excel to construct and test formulas for use in a Visio shape.
[Read more…] about Prototyping Visio ShapeSheet Formulas in ExcelThe UK-based independent Visio consultancy with a worldwide reach. We have over 25 years experience of providing data visualization solutions to companies around the globe.