In these days of political uncertainty in the UK, and our position in Europe or the world, there is only one thing that I can say: Sorry about Brexit … in every main language of the EU countries!

In these days of political uncertainty in the UK, and our position in Europe or the world, there is only one thing that I can say: Sorry about Brexit … in every main language of the EU countries!
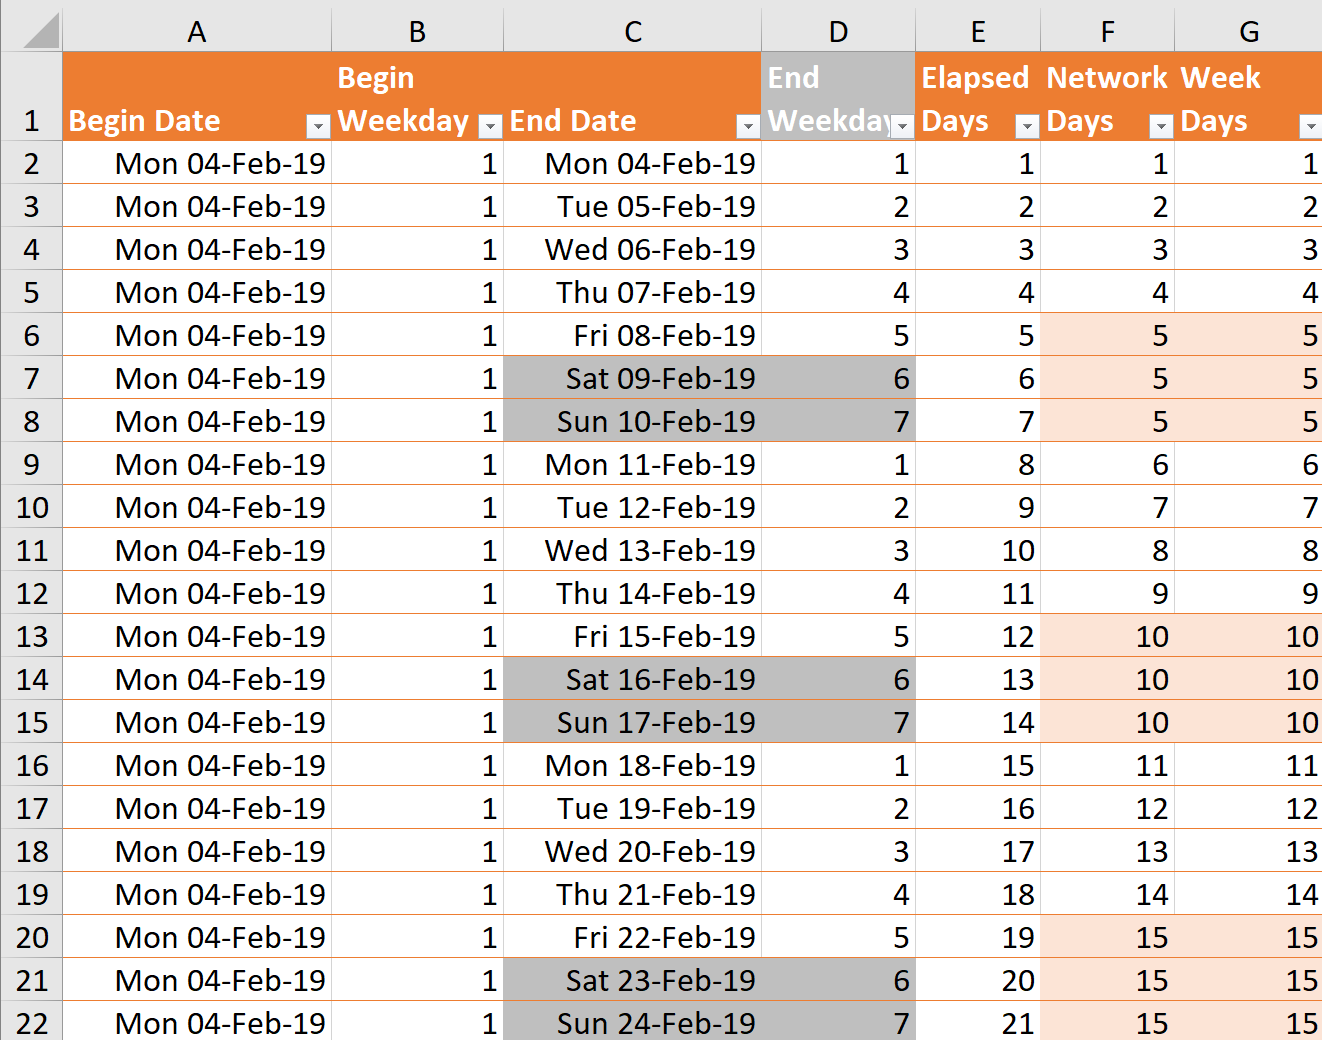
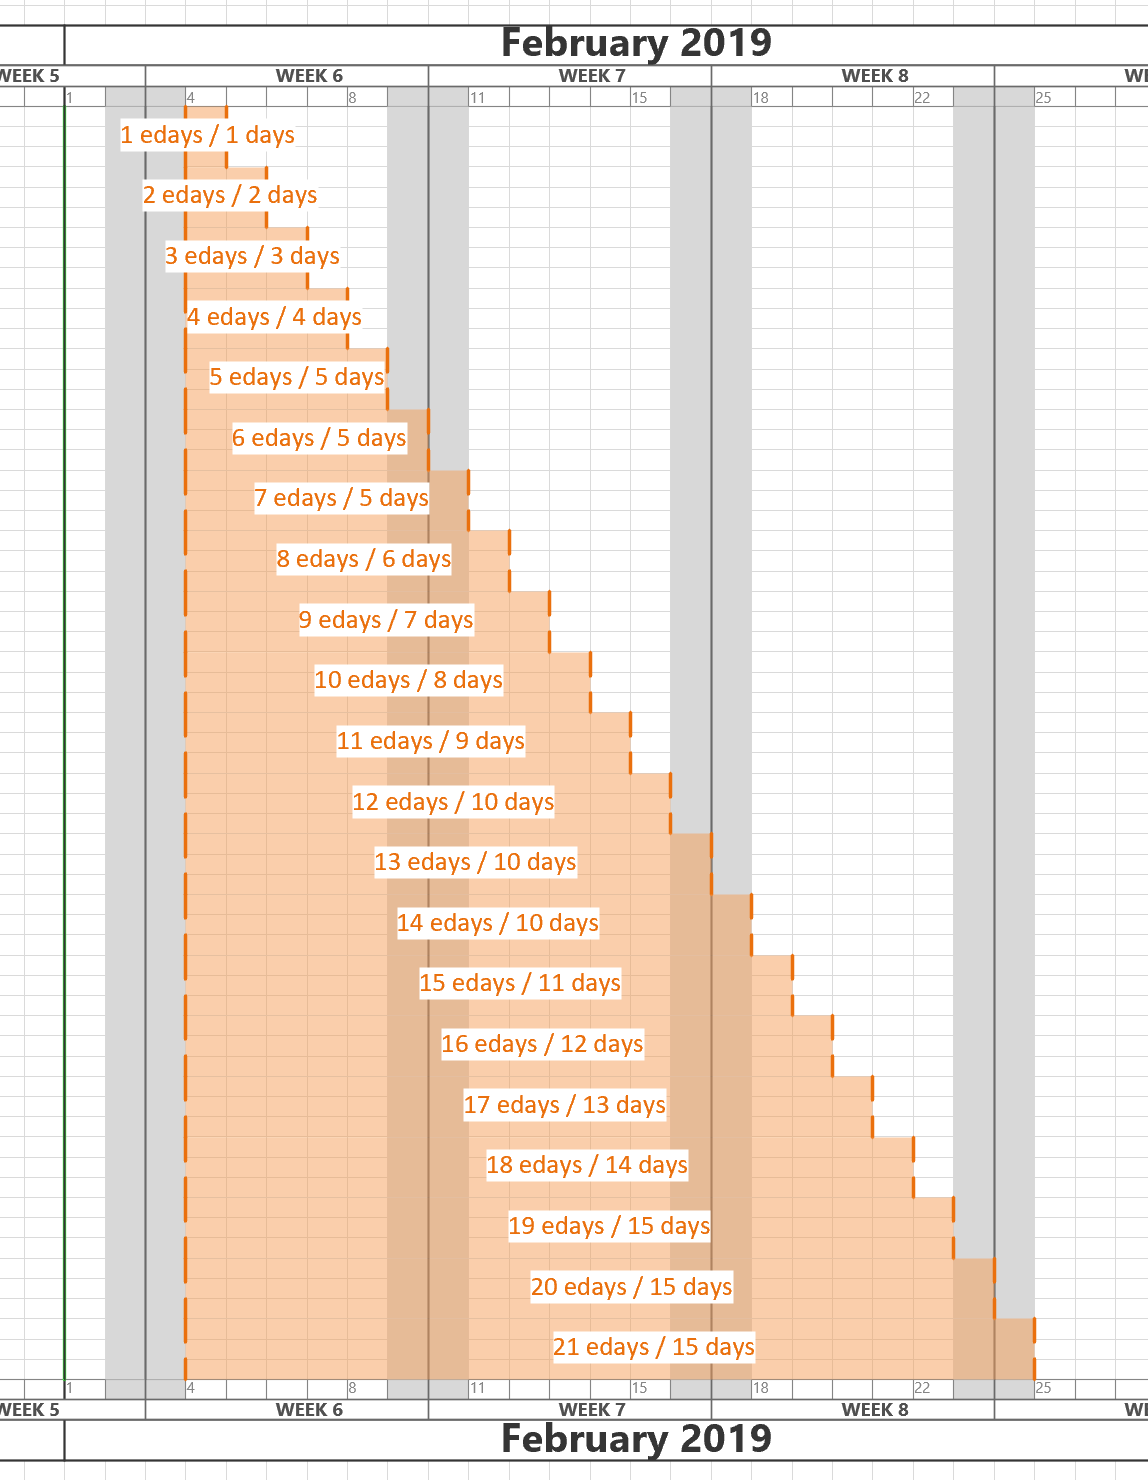
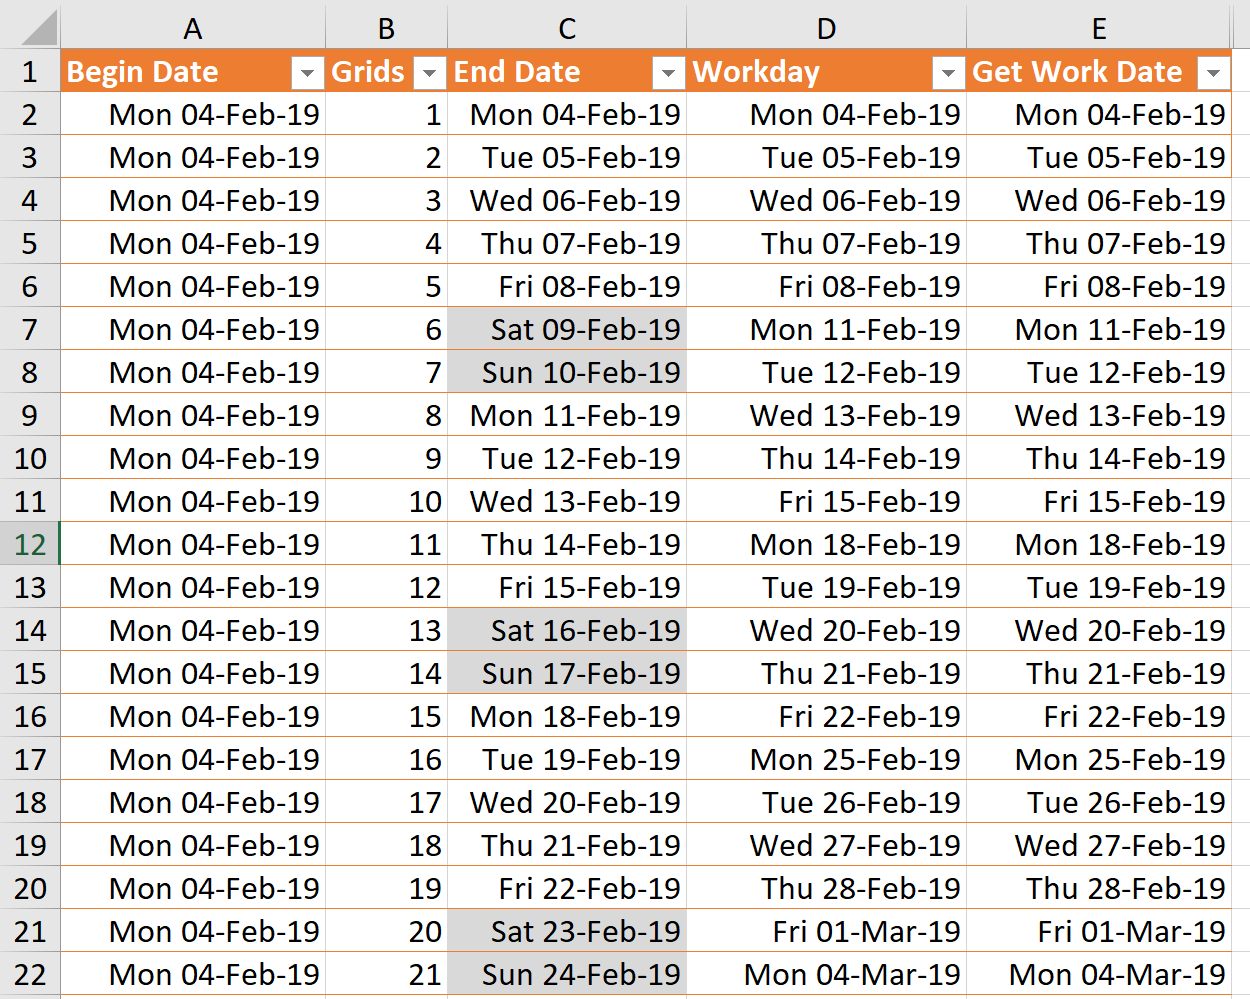
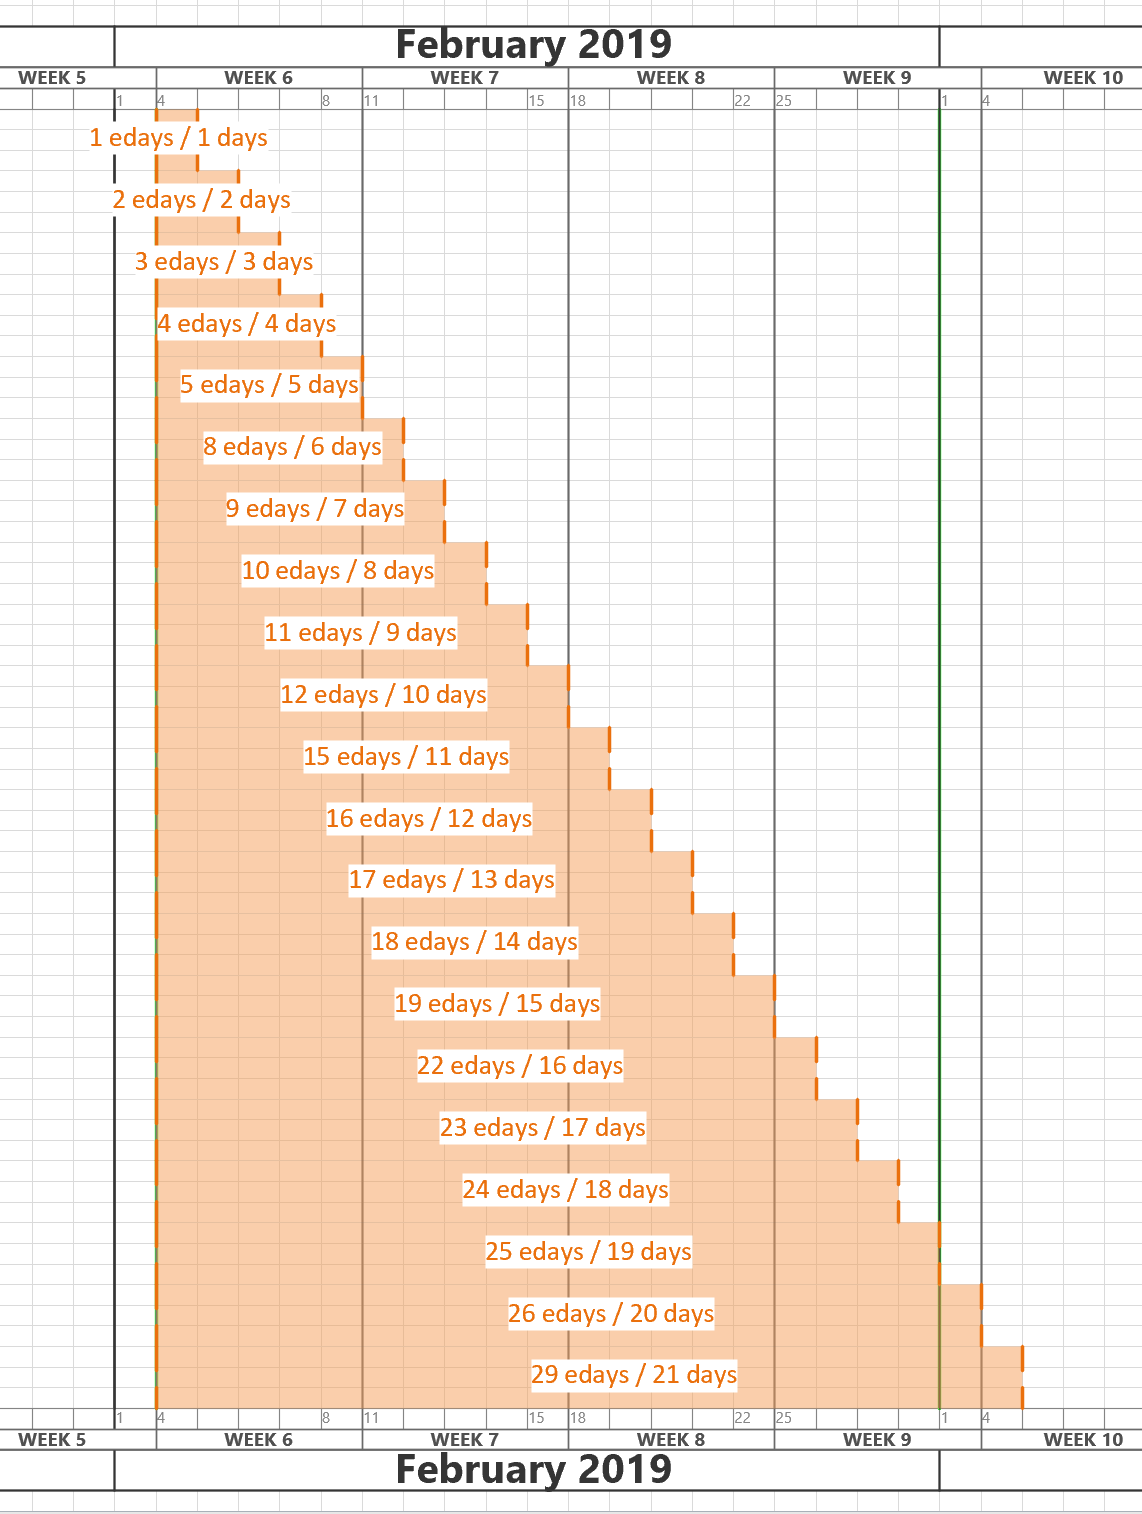
I am working on an application where the horizontal axis of the Visio page represents dates from left to right. In fact, the each of the fixed horizontal grids are 1 day, and I need to have shapes that understand the begin date at the left edge of the shape, and the end date at the right edge of the shape. There is, therefore, a number of elapsed days representing by the width of the shape. However, the underlying grid can either represent all days, or it can be changed to only represent weekdays by omitting the weekends. I struggled to find the best formula to calculate the elapsed days or weekdays between two dates in Visio ShapeSheet formulas, so I turned to Excel to provide an inspiration. The Visio ShapeSheet is modelled on the Excel worksheet, and formulas can be entered into the cells in much the same way. However, the available functions differ since Excel is mainly used for arithmetic and statistics, but Visio is used for graphics and data. In this article, I demonstrate how I used C# and Excel to construct and test formulas for use in a Visio shape.
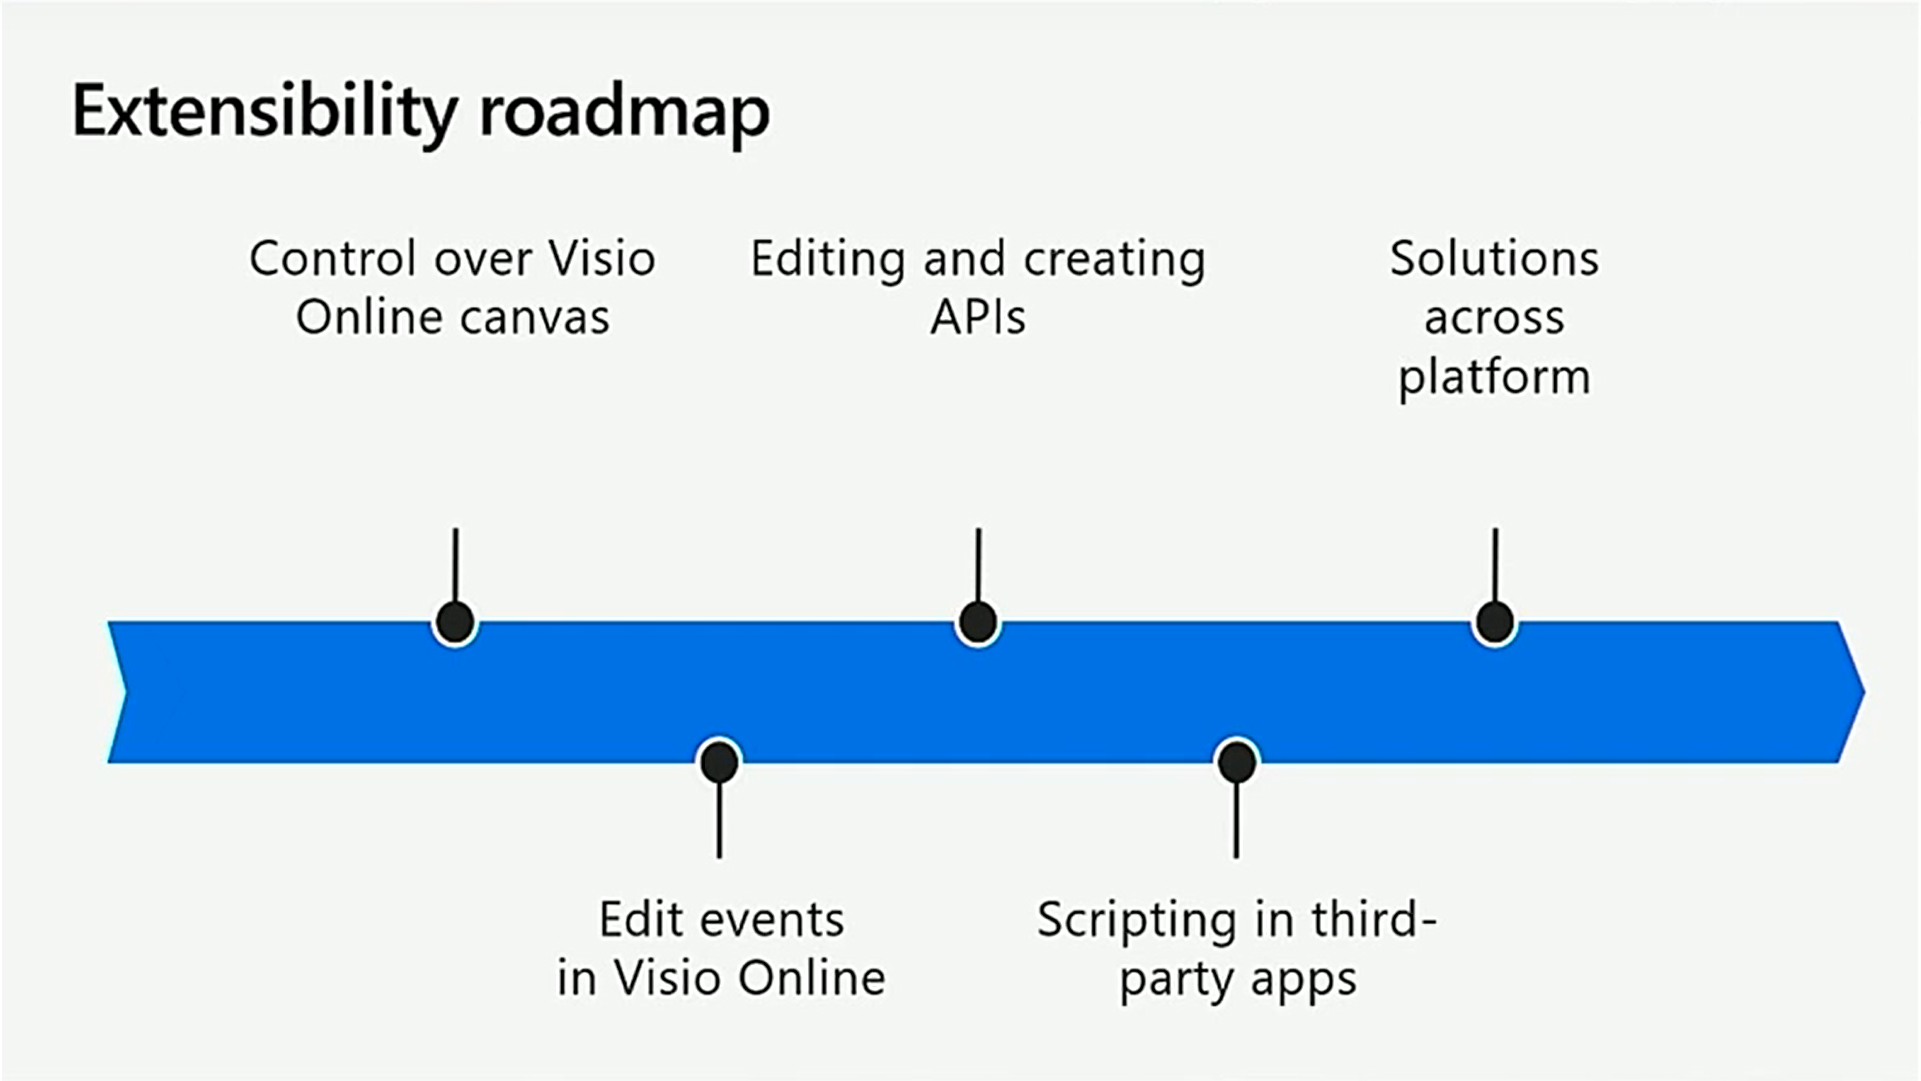
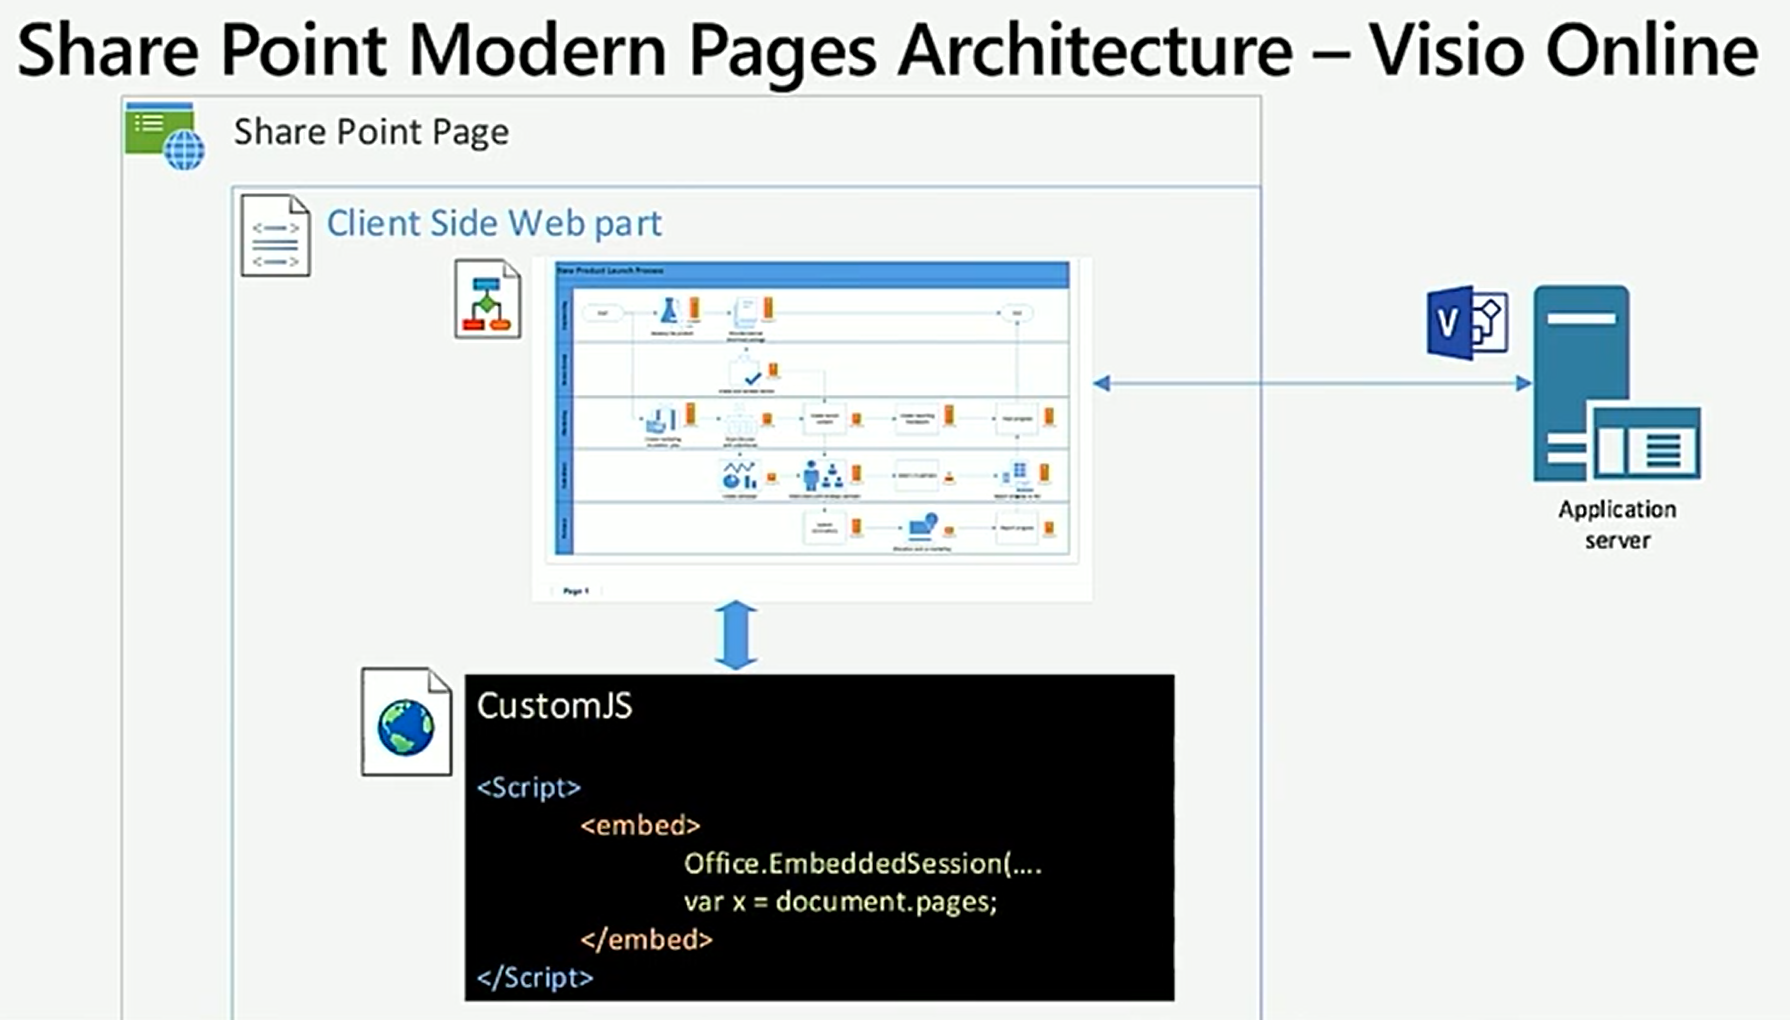
[Read more…] about Prototyping Visio ShapeSheet Formulas in ExcelIt was the last day of the MSIgnite conference today, and the video of the final presentation about Visio was worth staying for, even though some of it was content I knew about, and have mentioned in previous posts this week ( see Dive into the world of data-driven operation intelligence with Microsoft Visio, Excel and Power BI). However, there was some content I was particularly pleased to see, and that was about support for the Visio Online JavaScript API support in Modern SharePoint Framework. I have pulled out some of the key slides below, but check out the full session for more information.
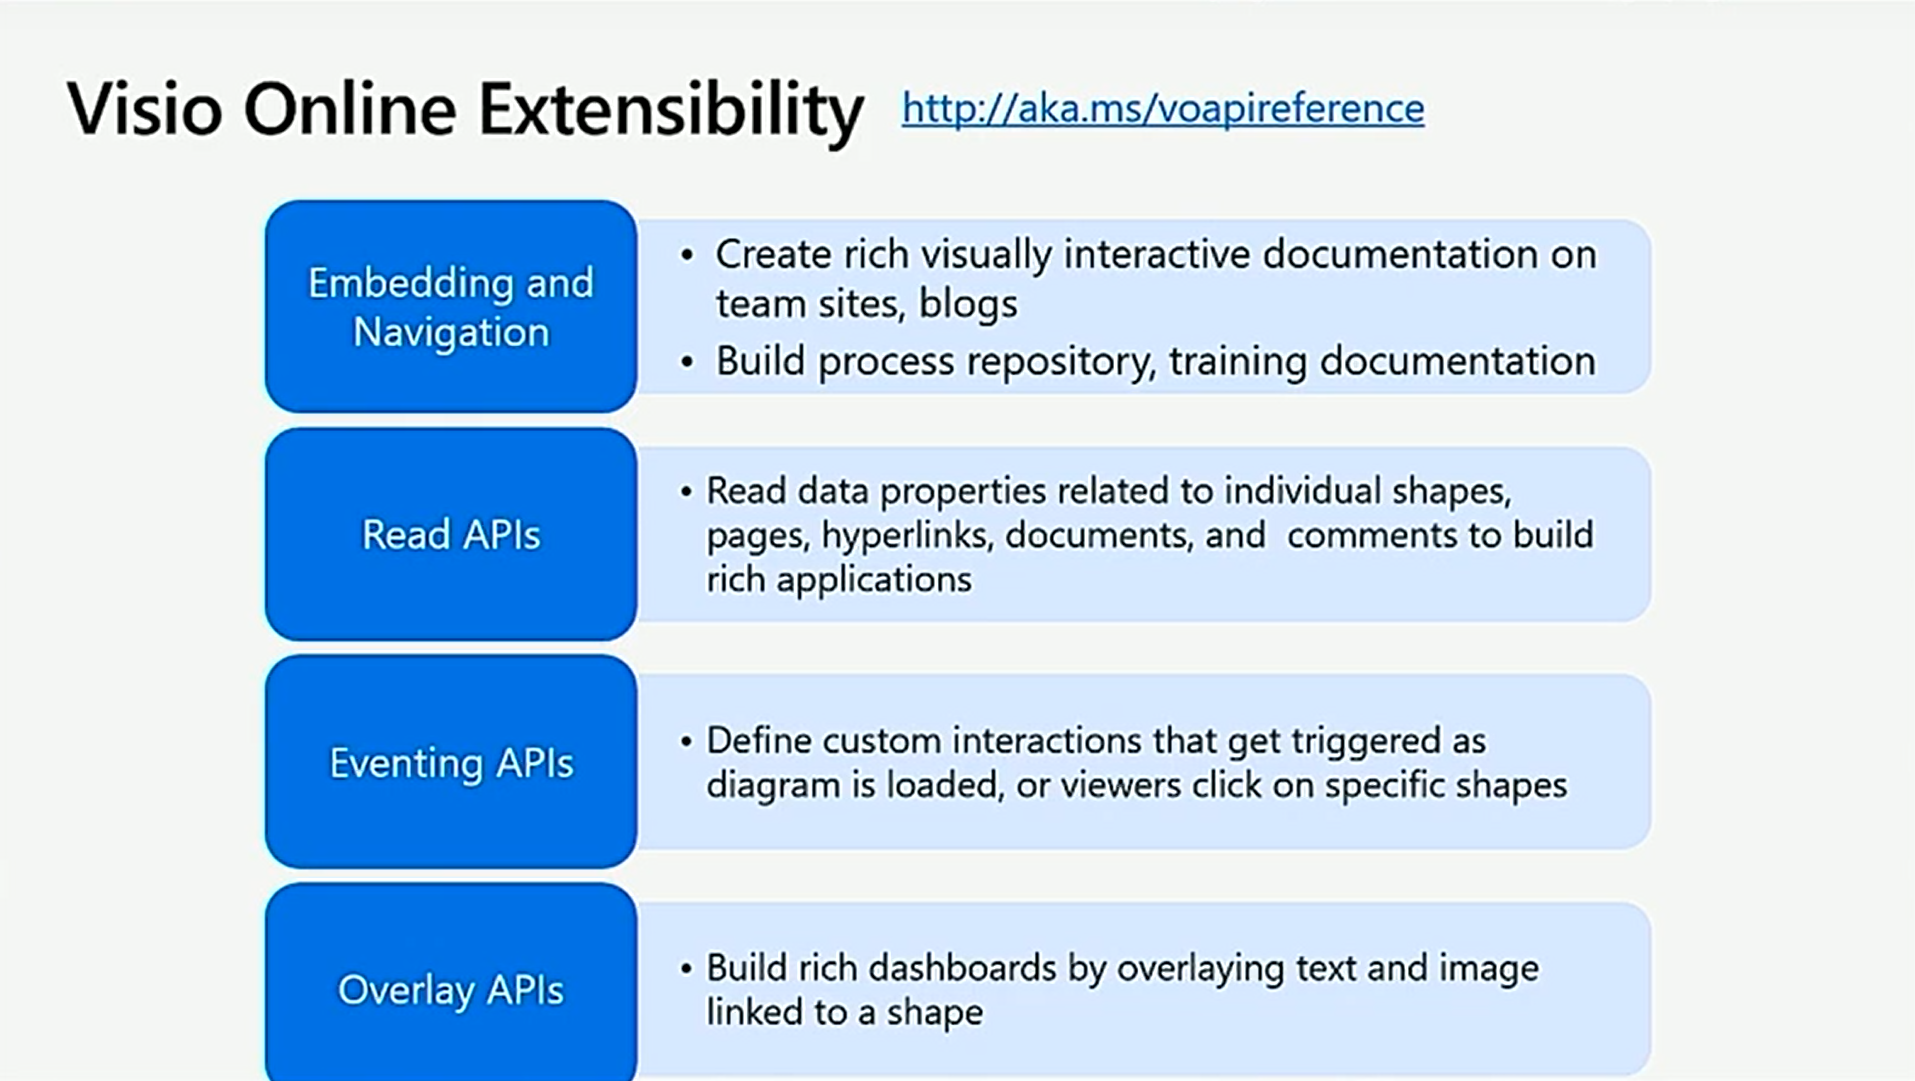
The hardworking Microsoft Visio product development team have worked hard to almost match all of the functionality of the old server-side Visio services control, but they haven’t quite got everything. So I cheered when I hear that support for html overlays are in the roadmap to be supported! All I ask for now (almost) is layer control, and I will be very happy.
They also stated that they will be enabling all this functionality for non-SharePoint web sites in the future!
Go to http://aka.ms/voapireference got more details.
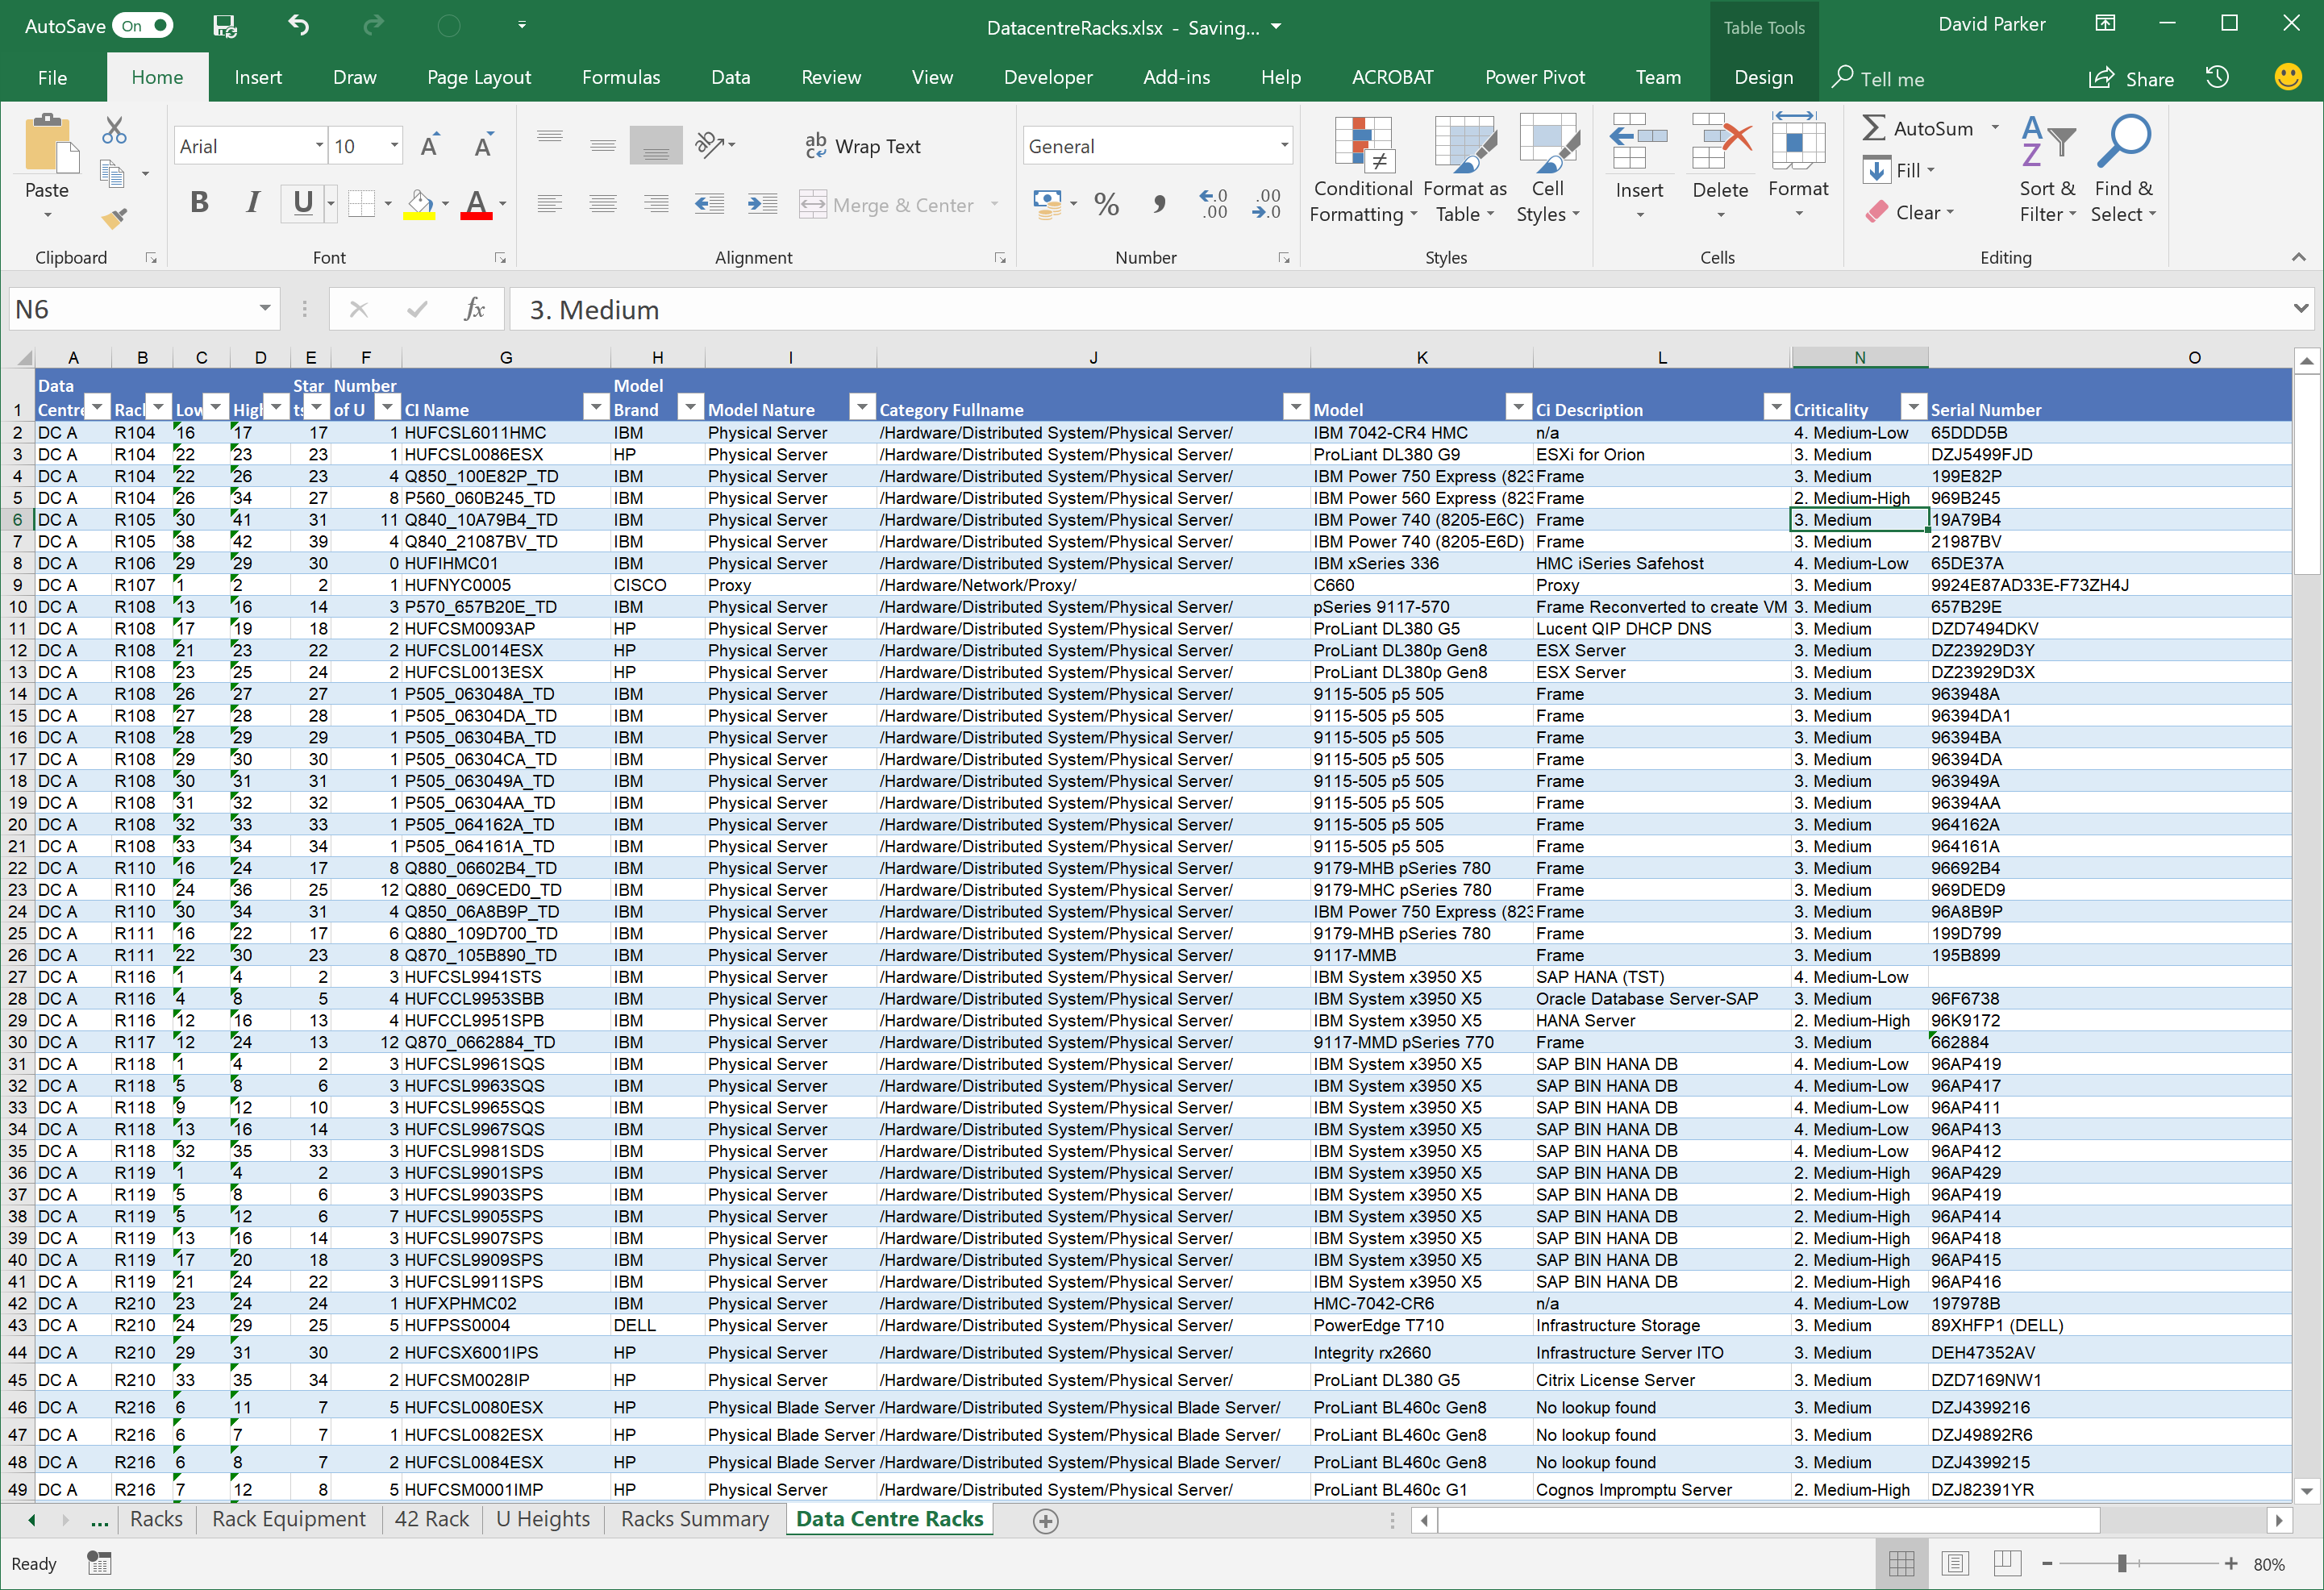
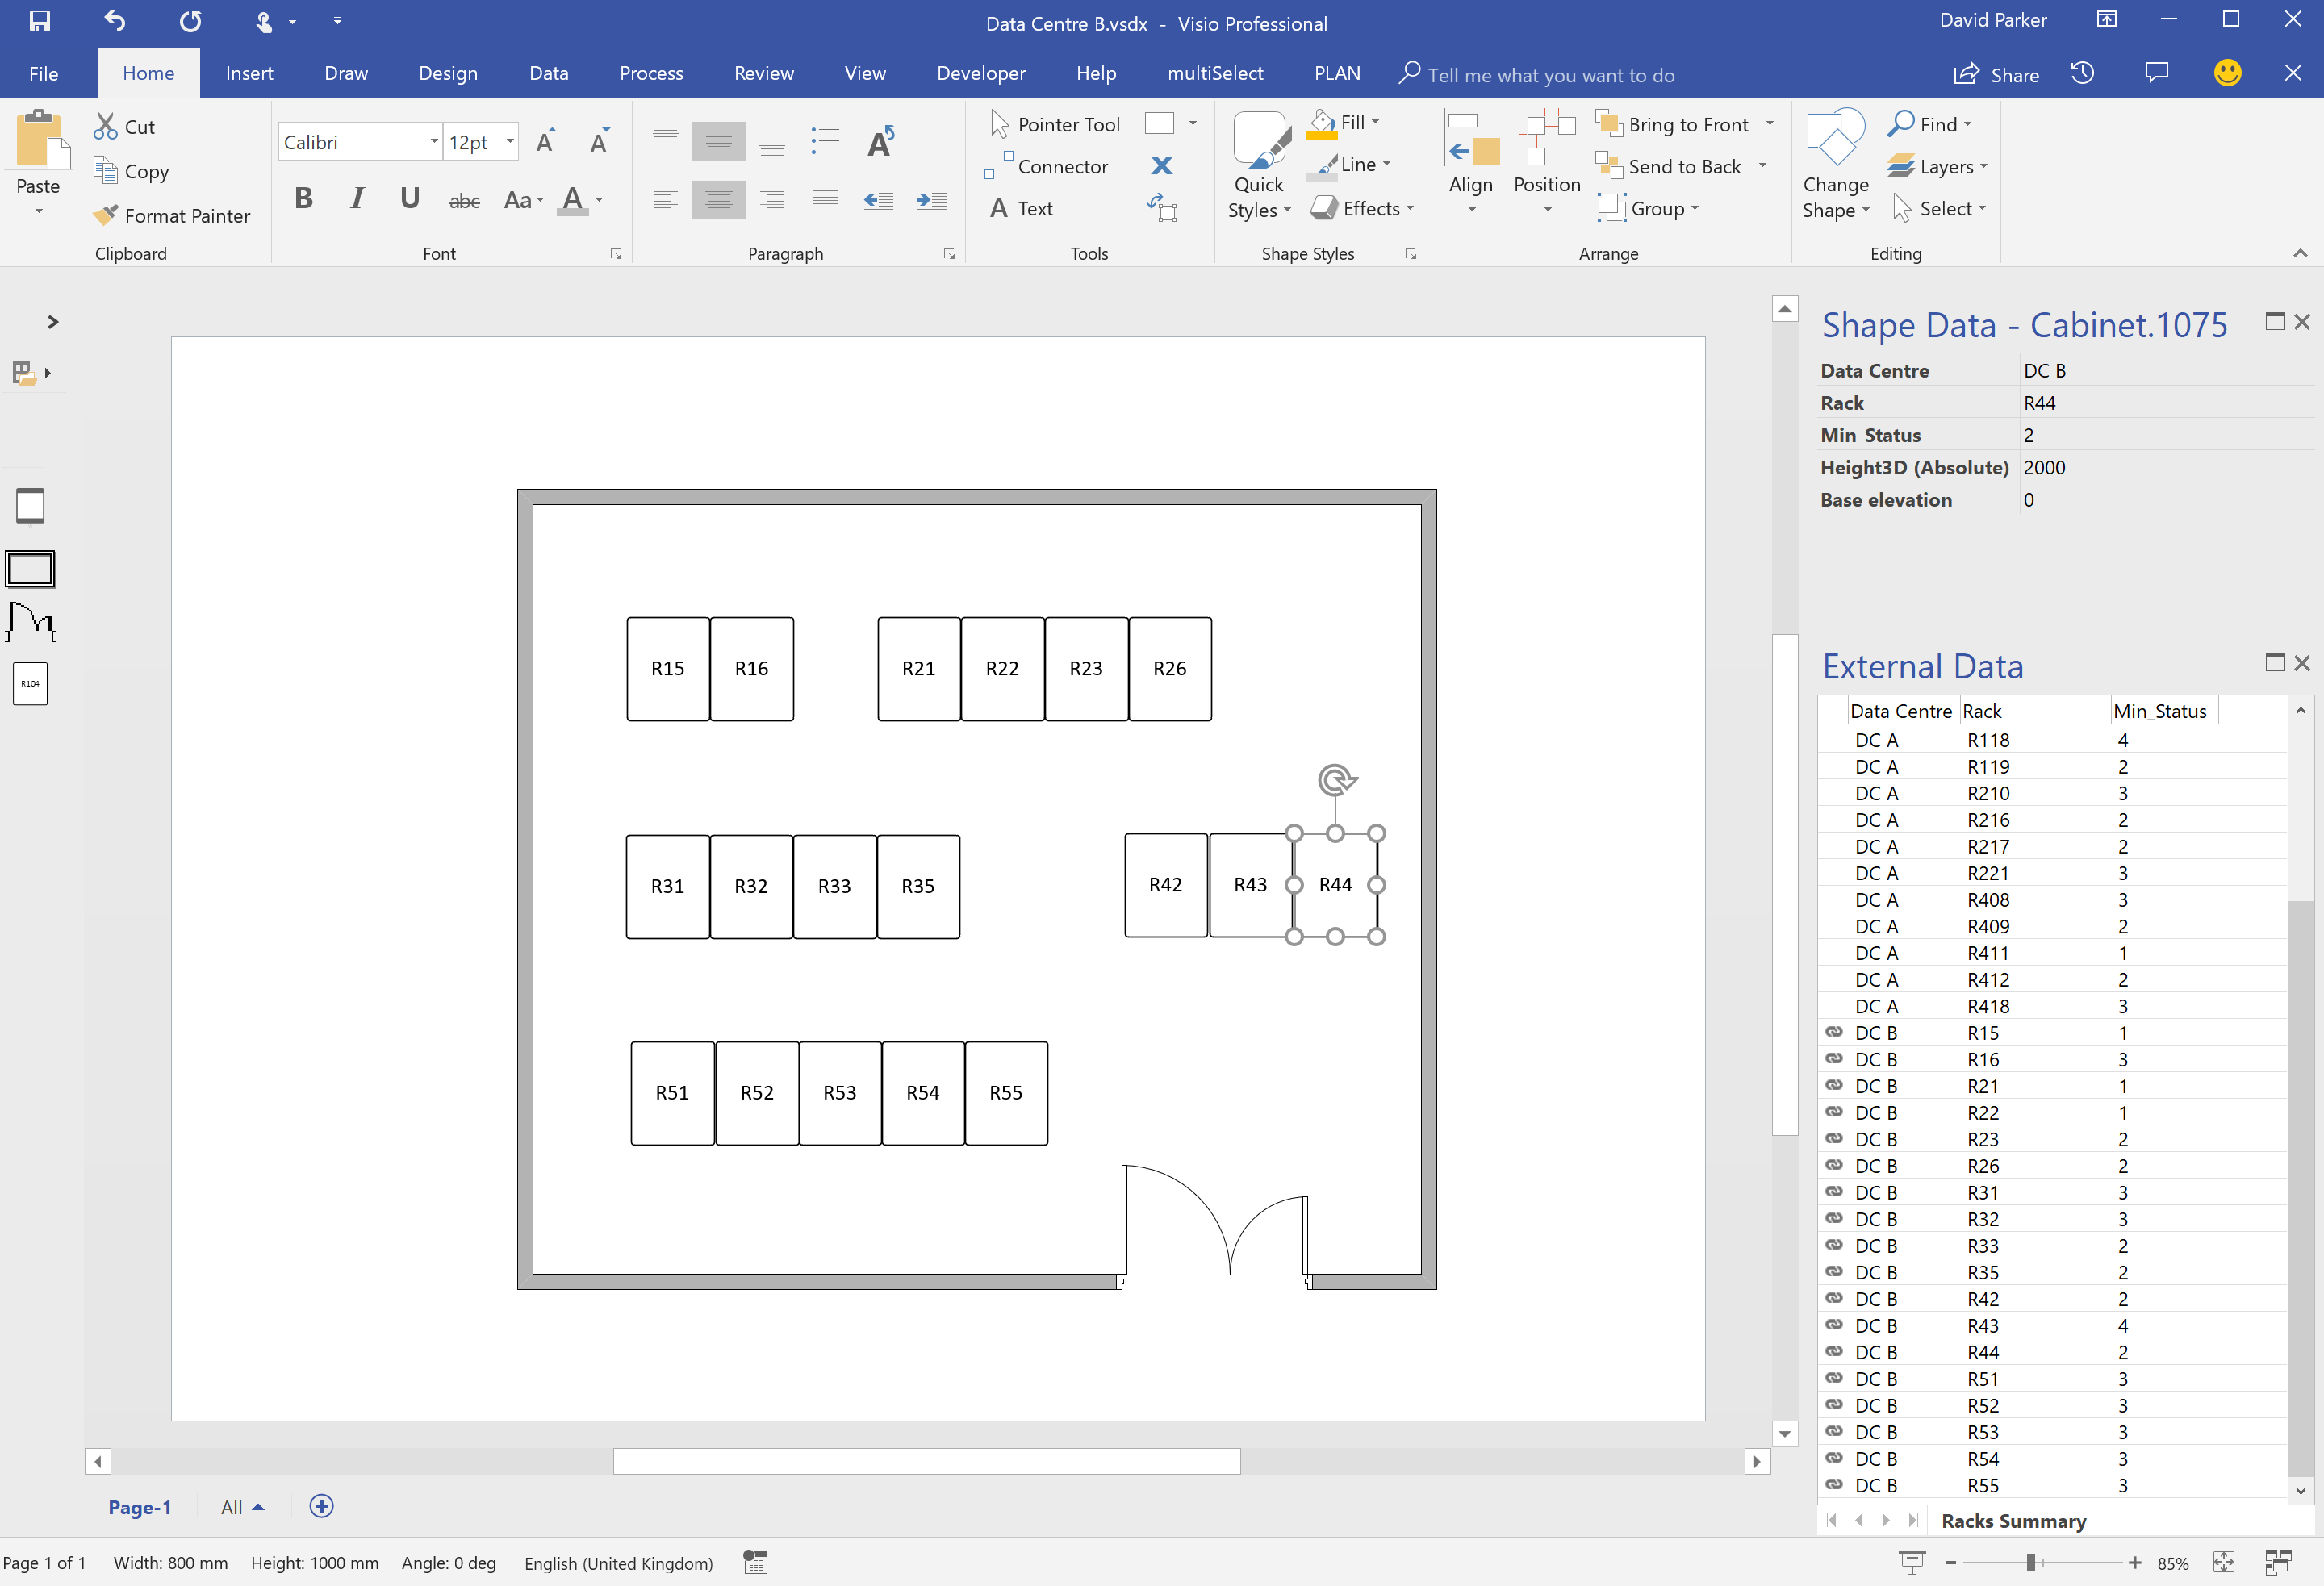
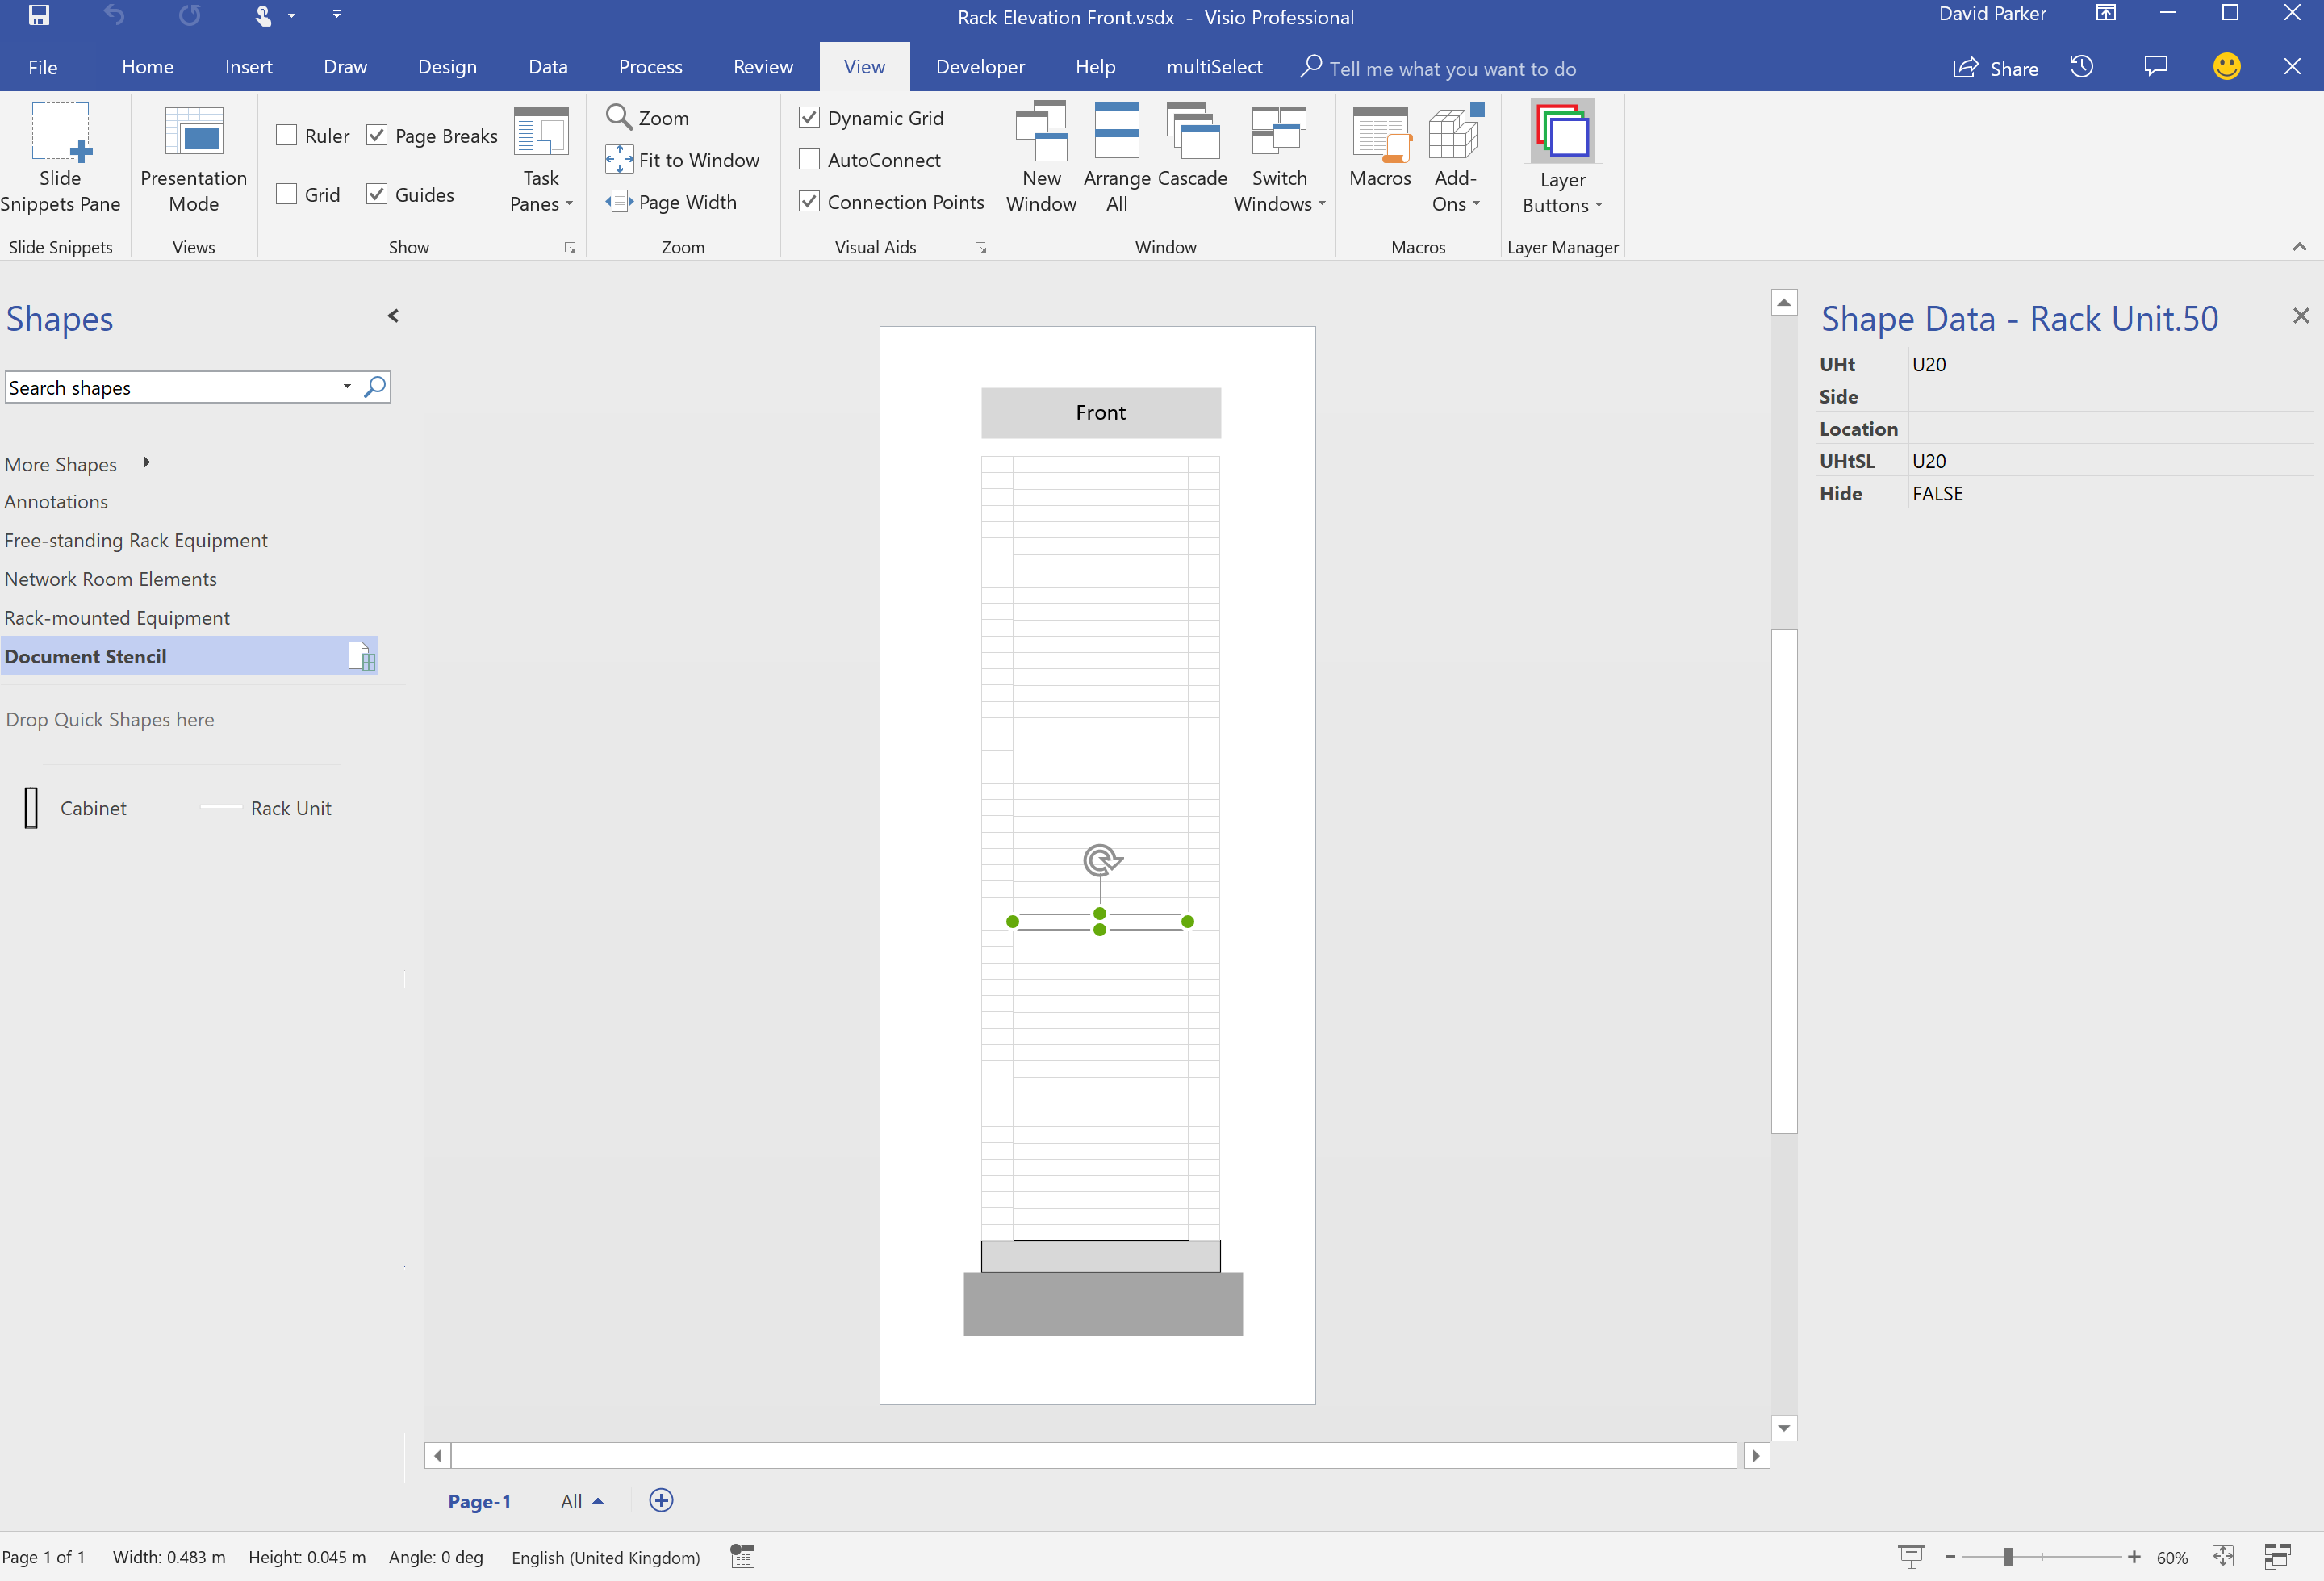
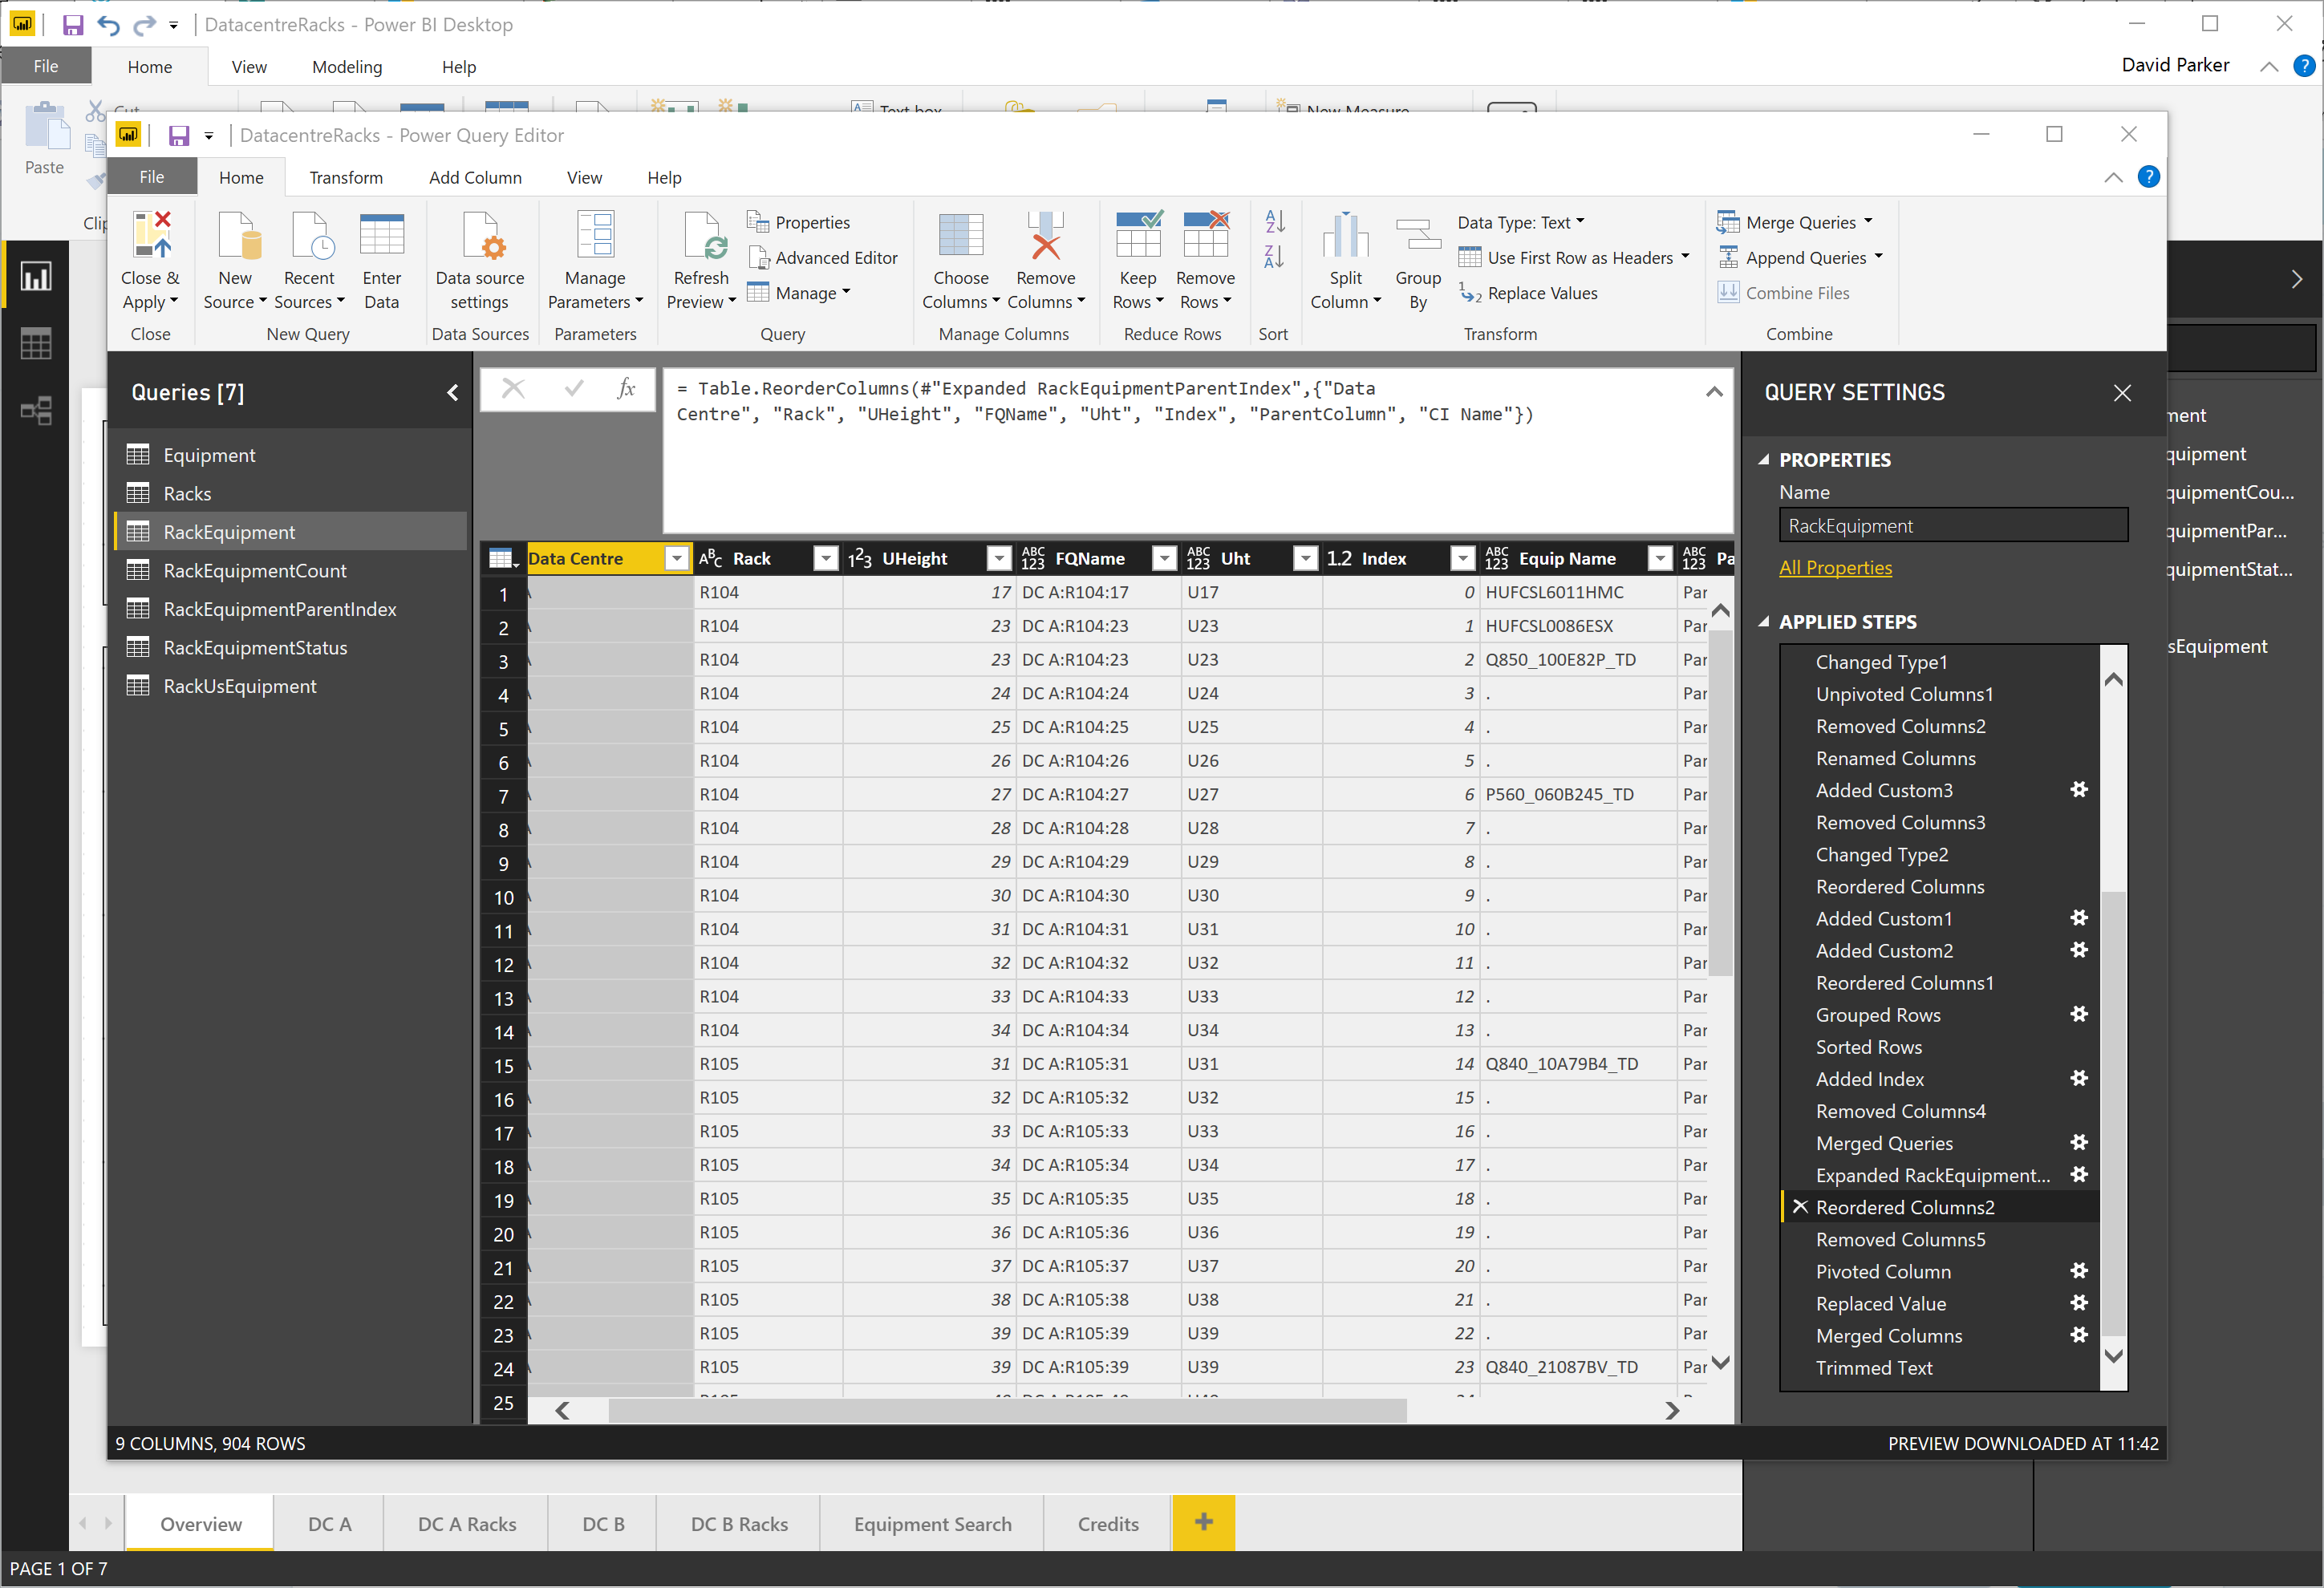
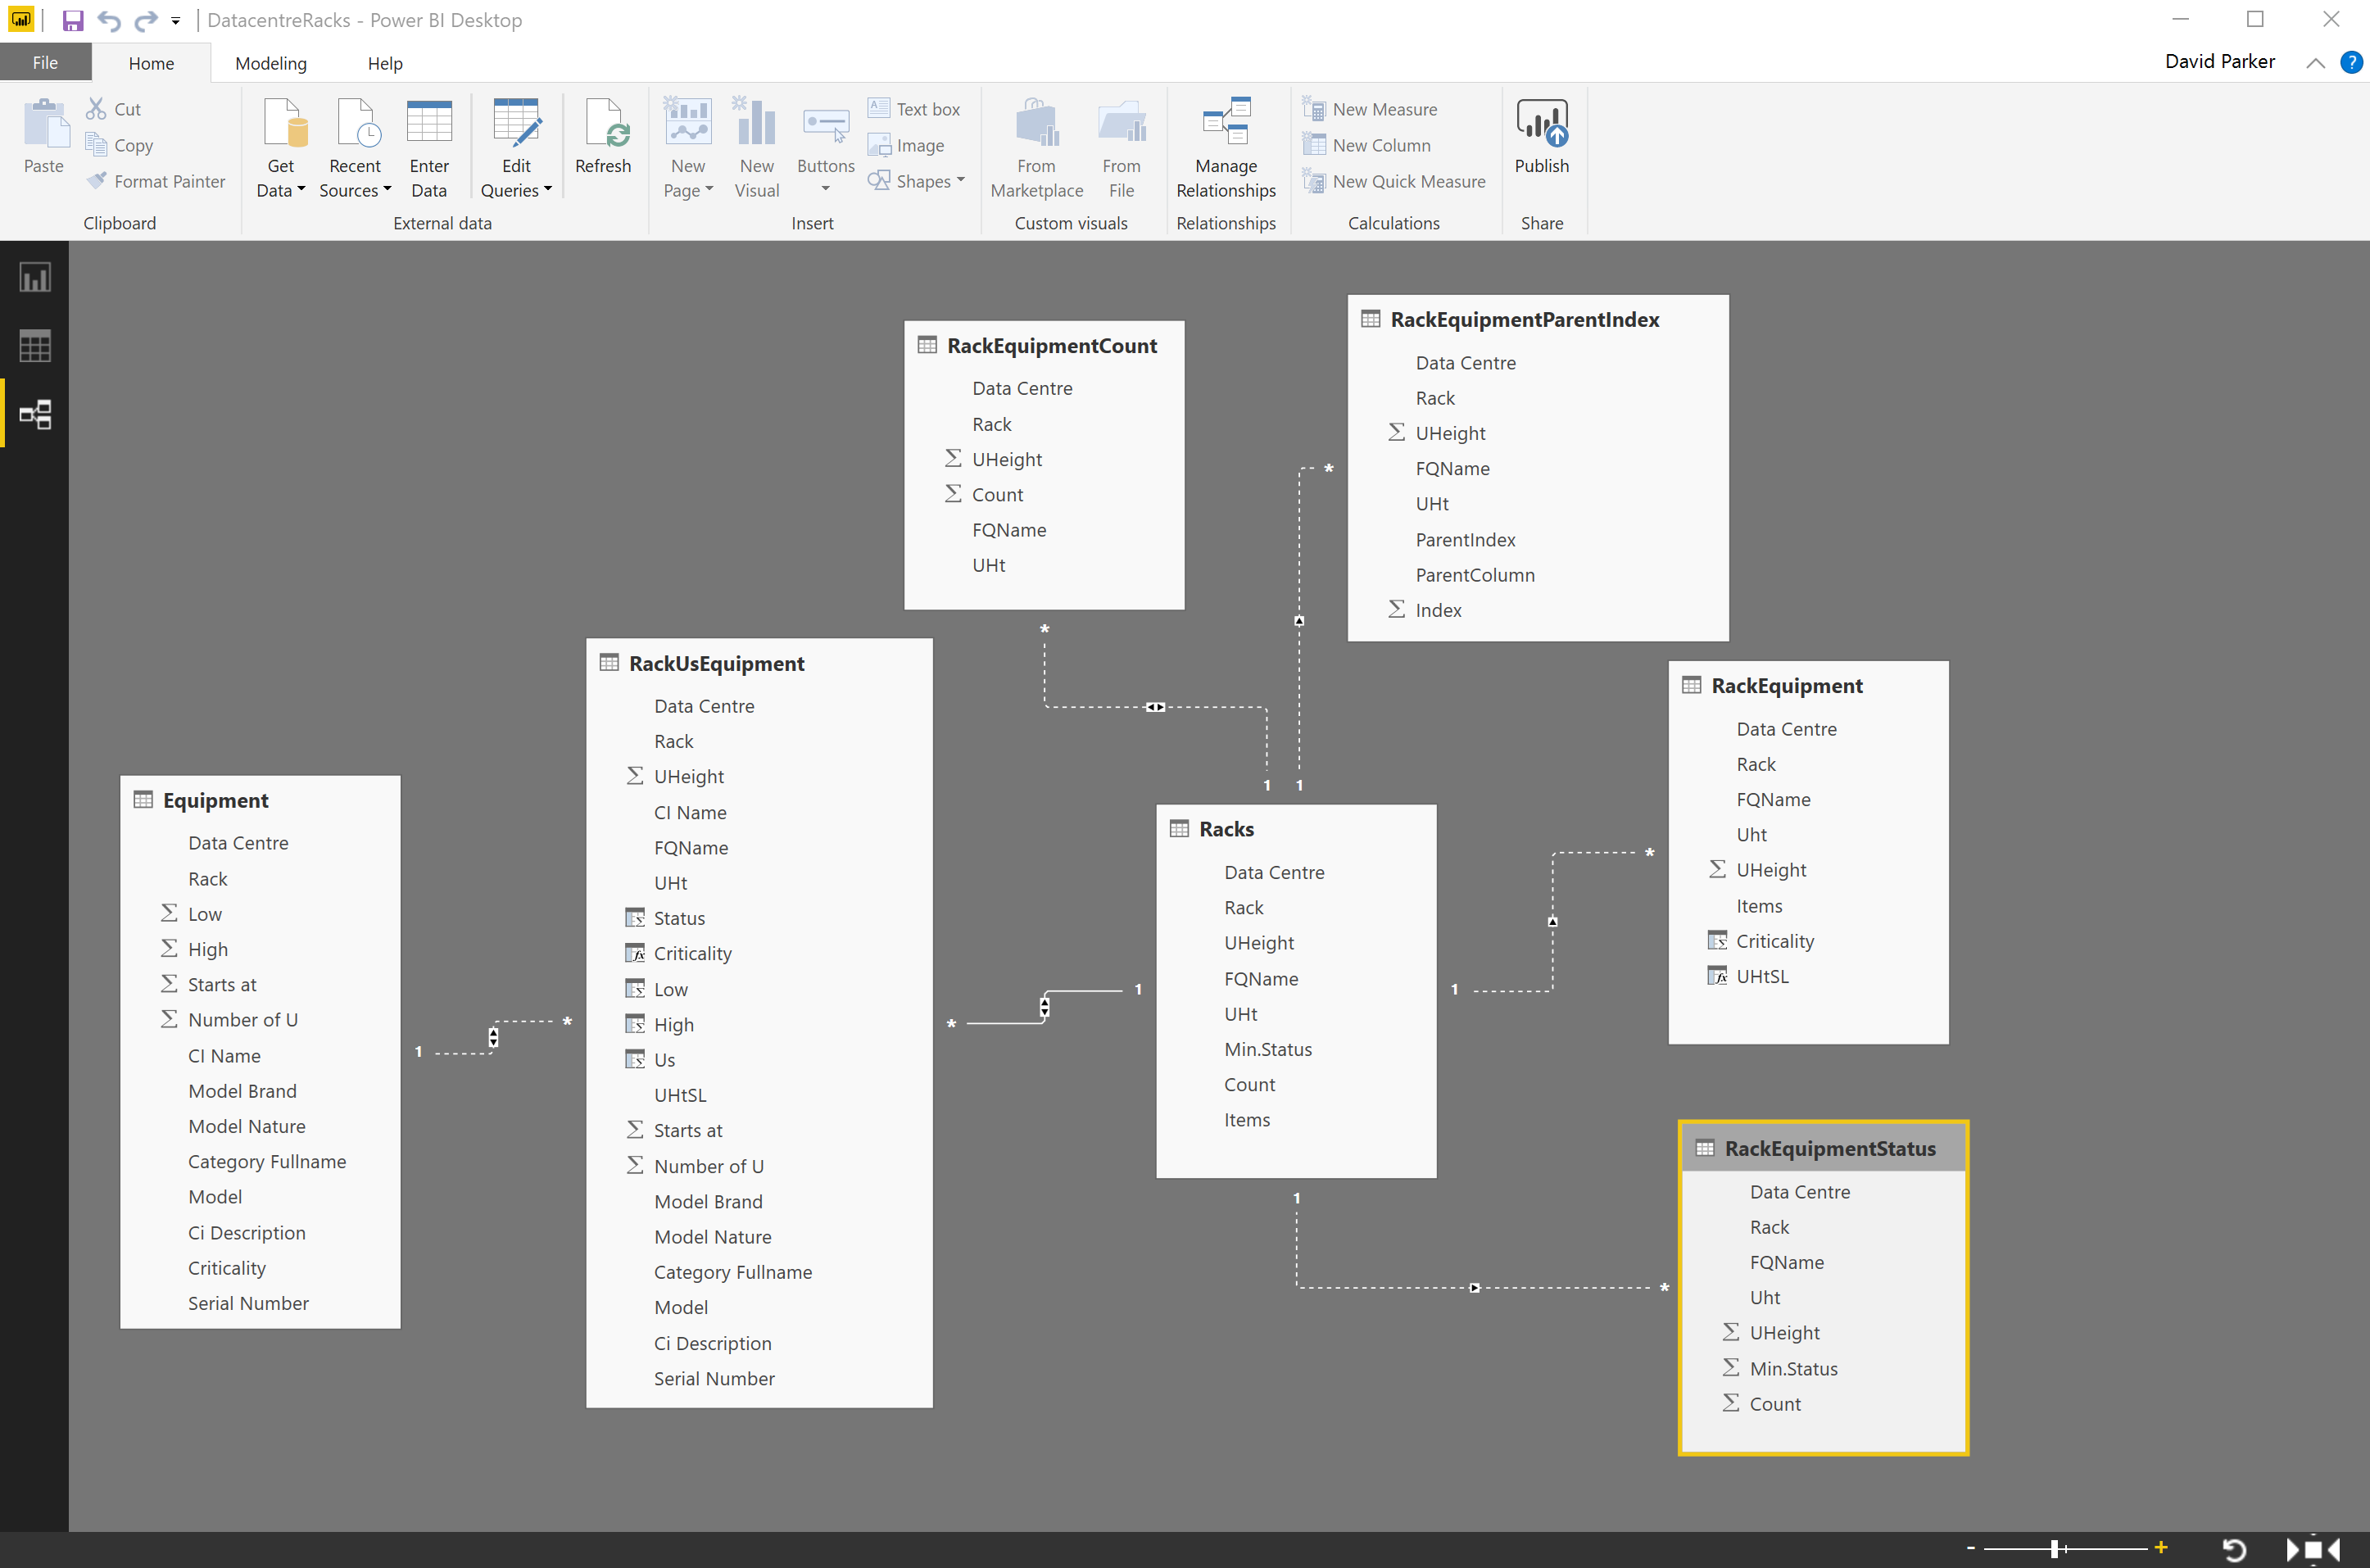
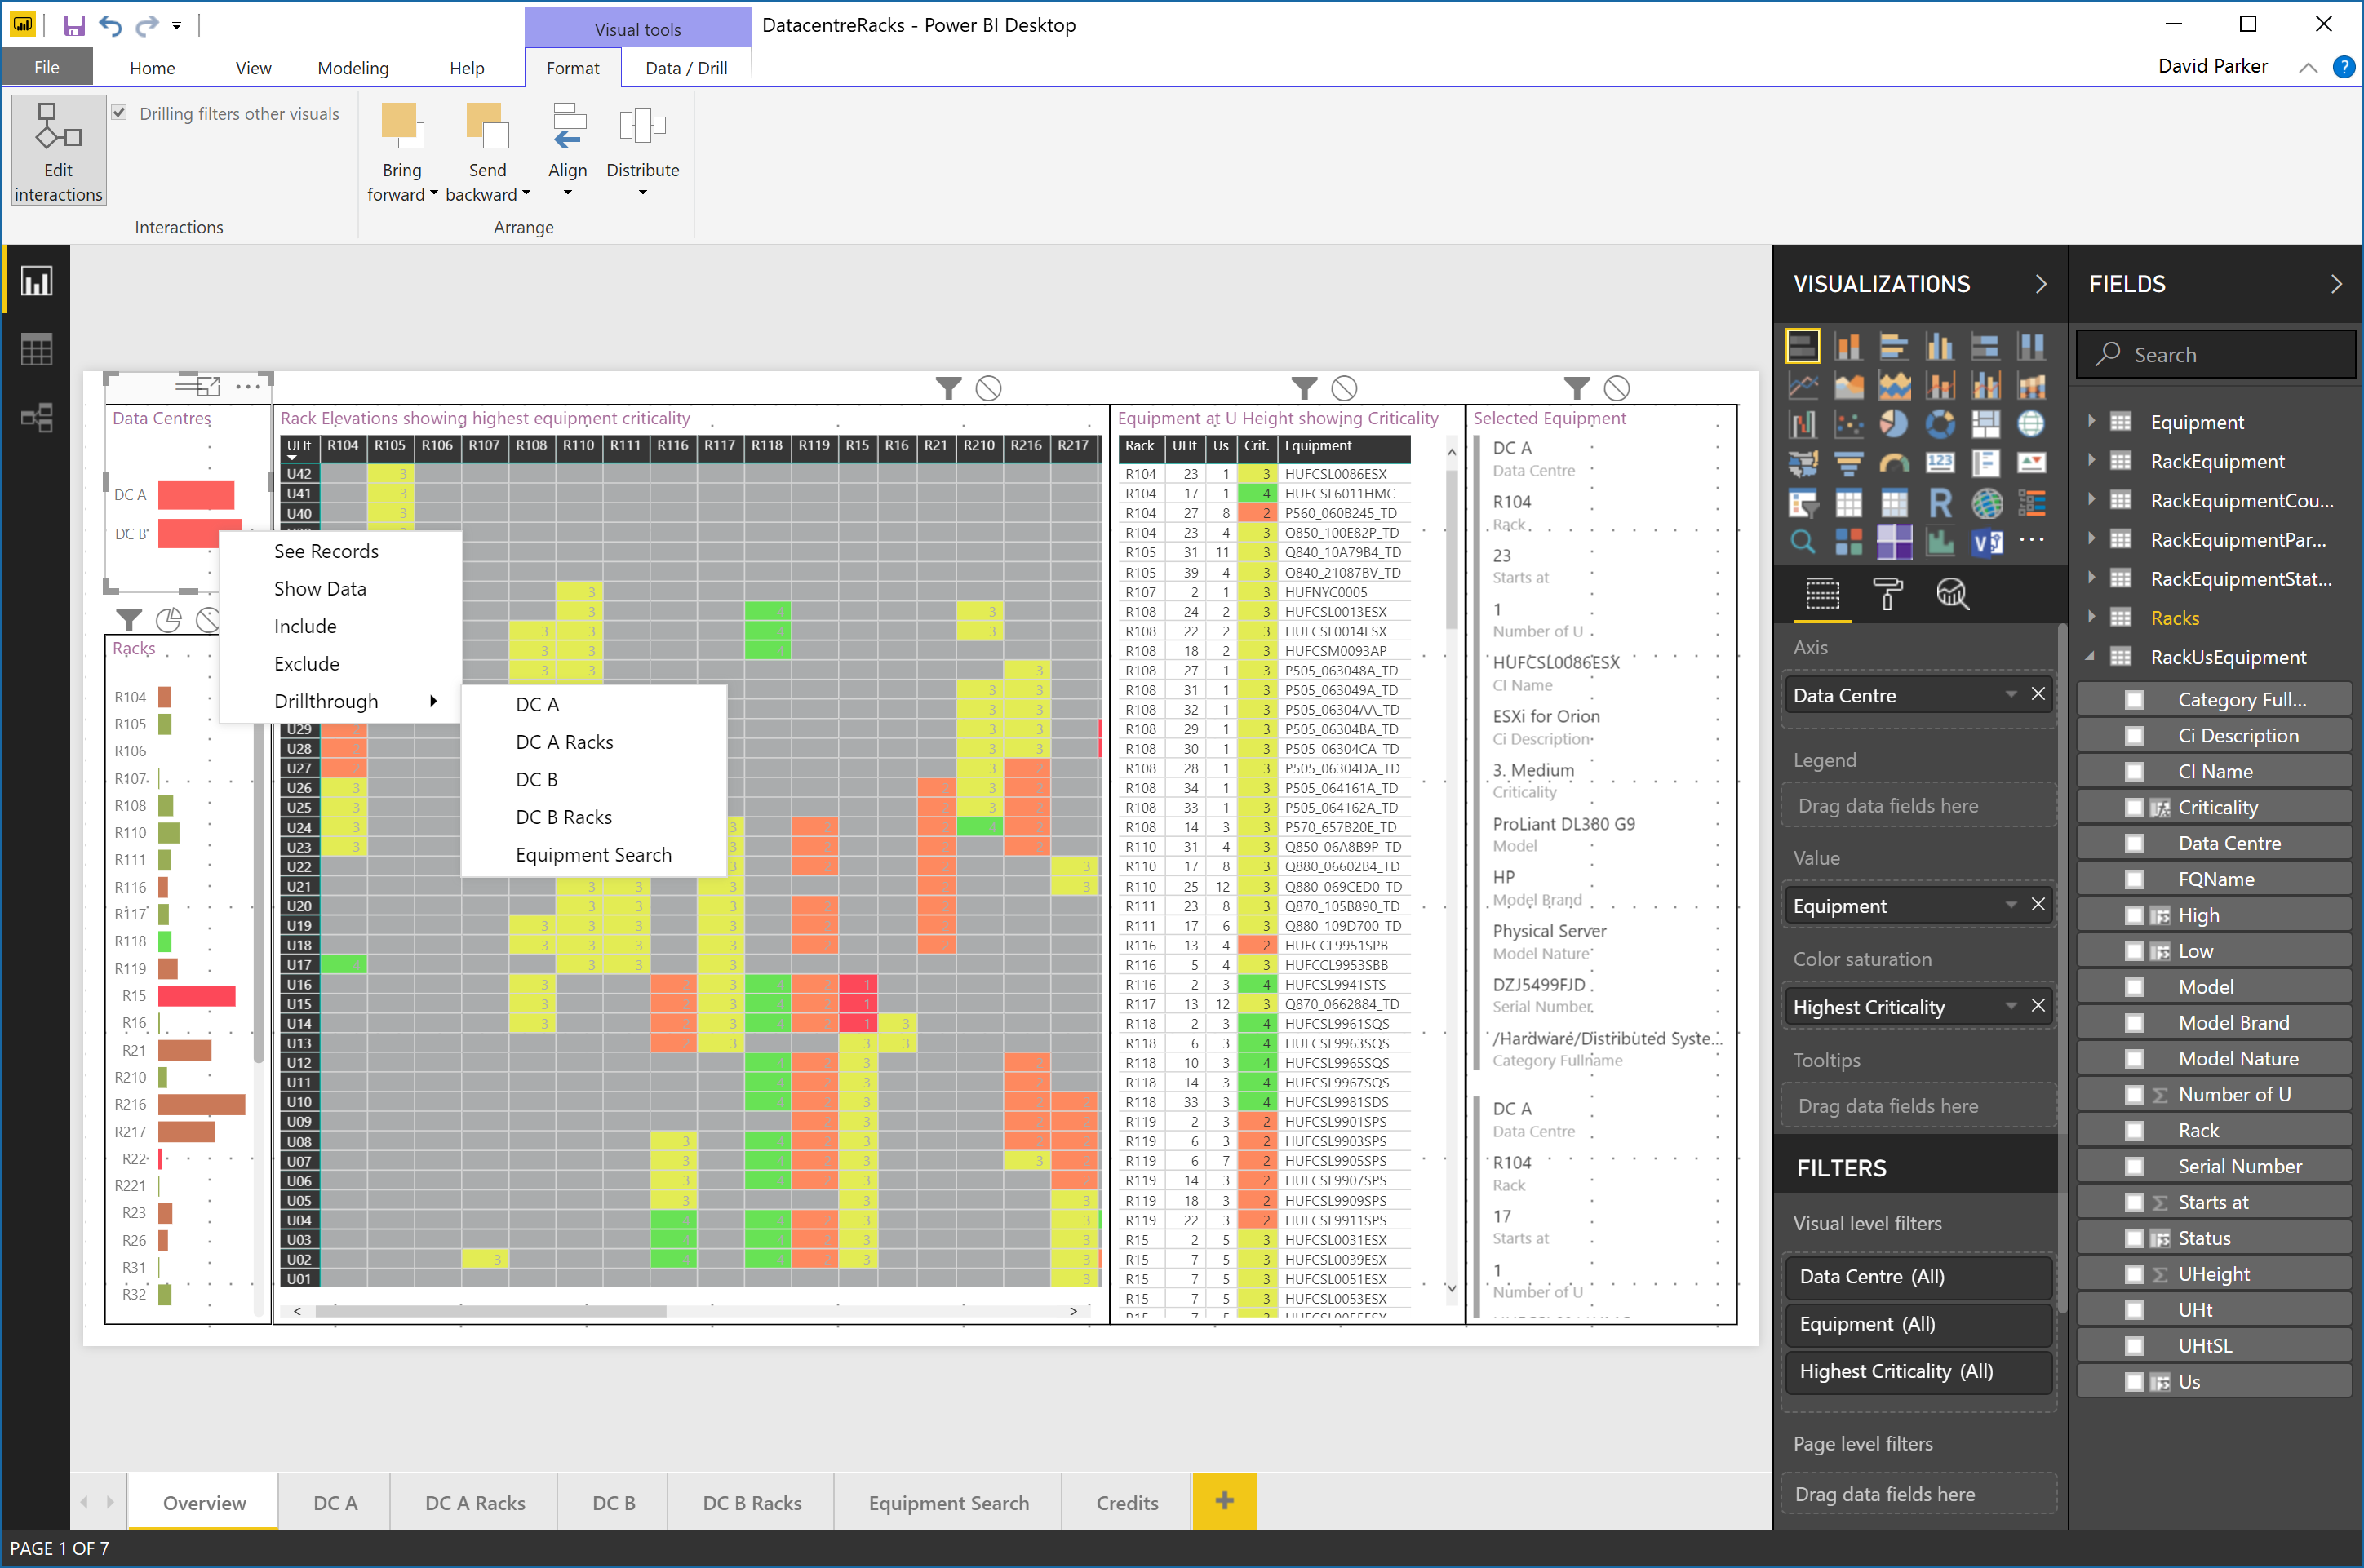
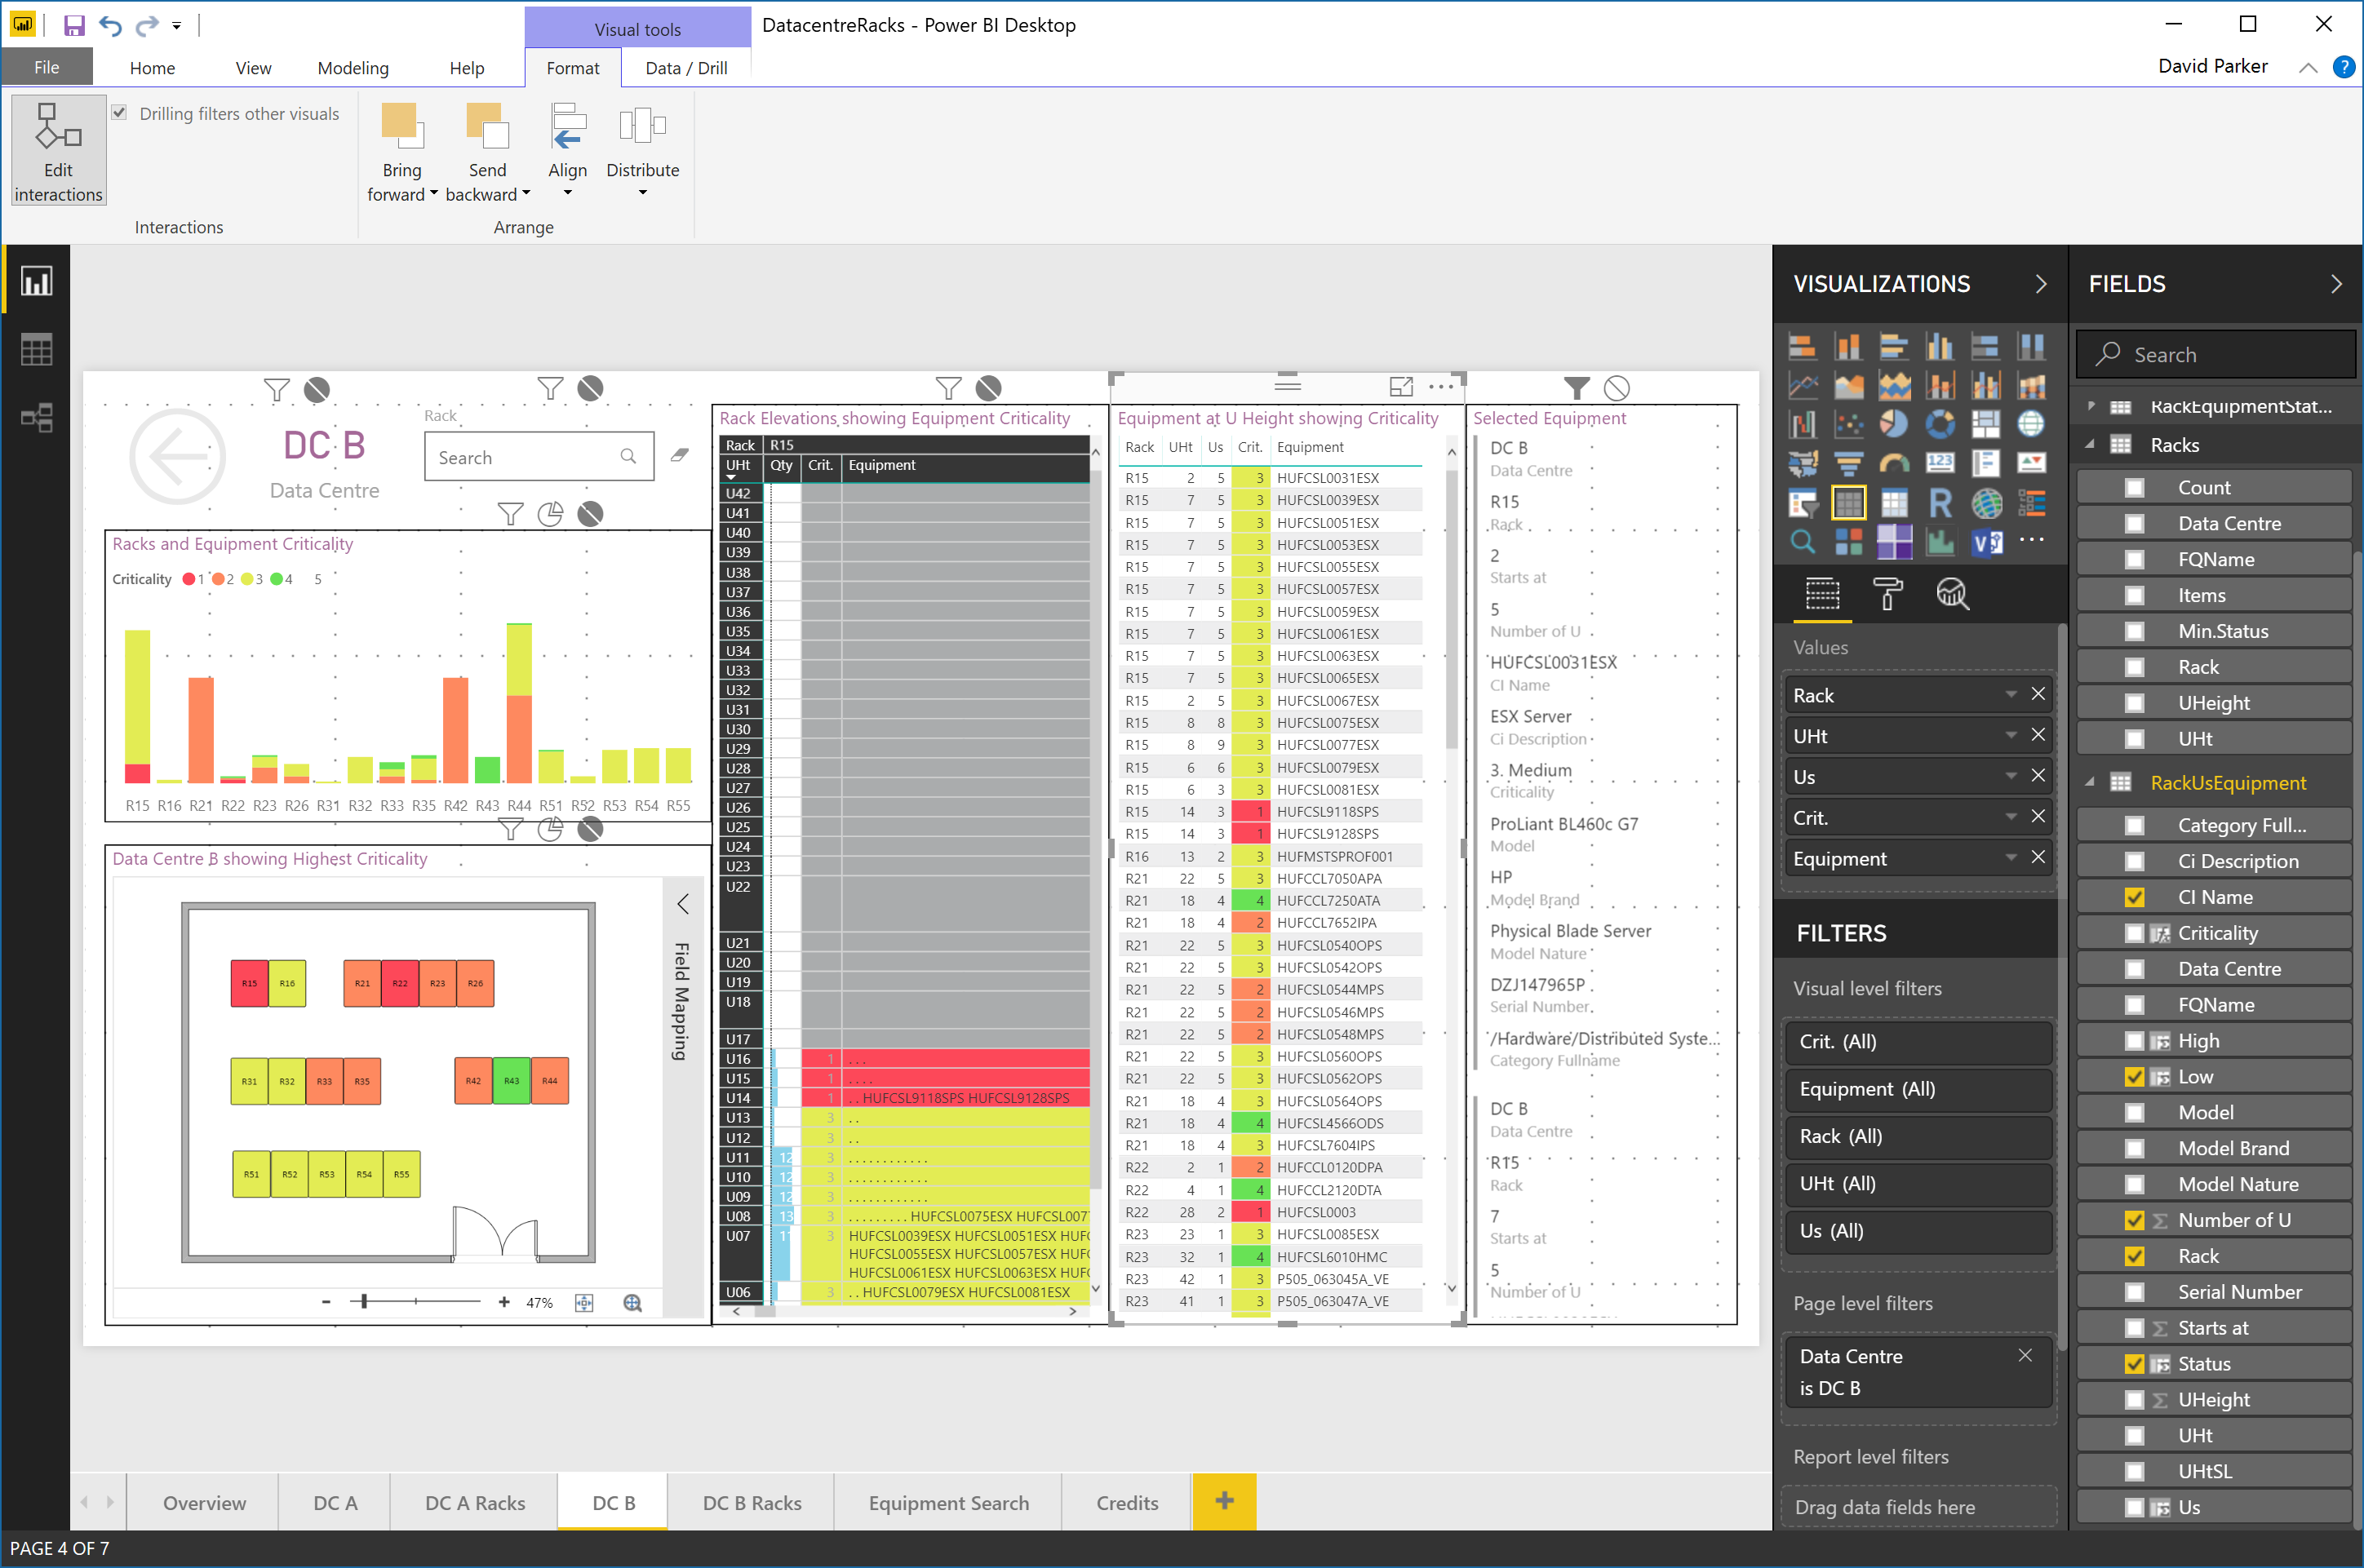
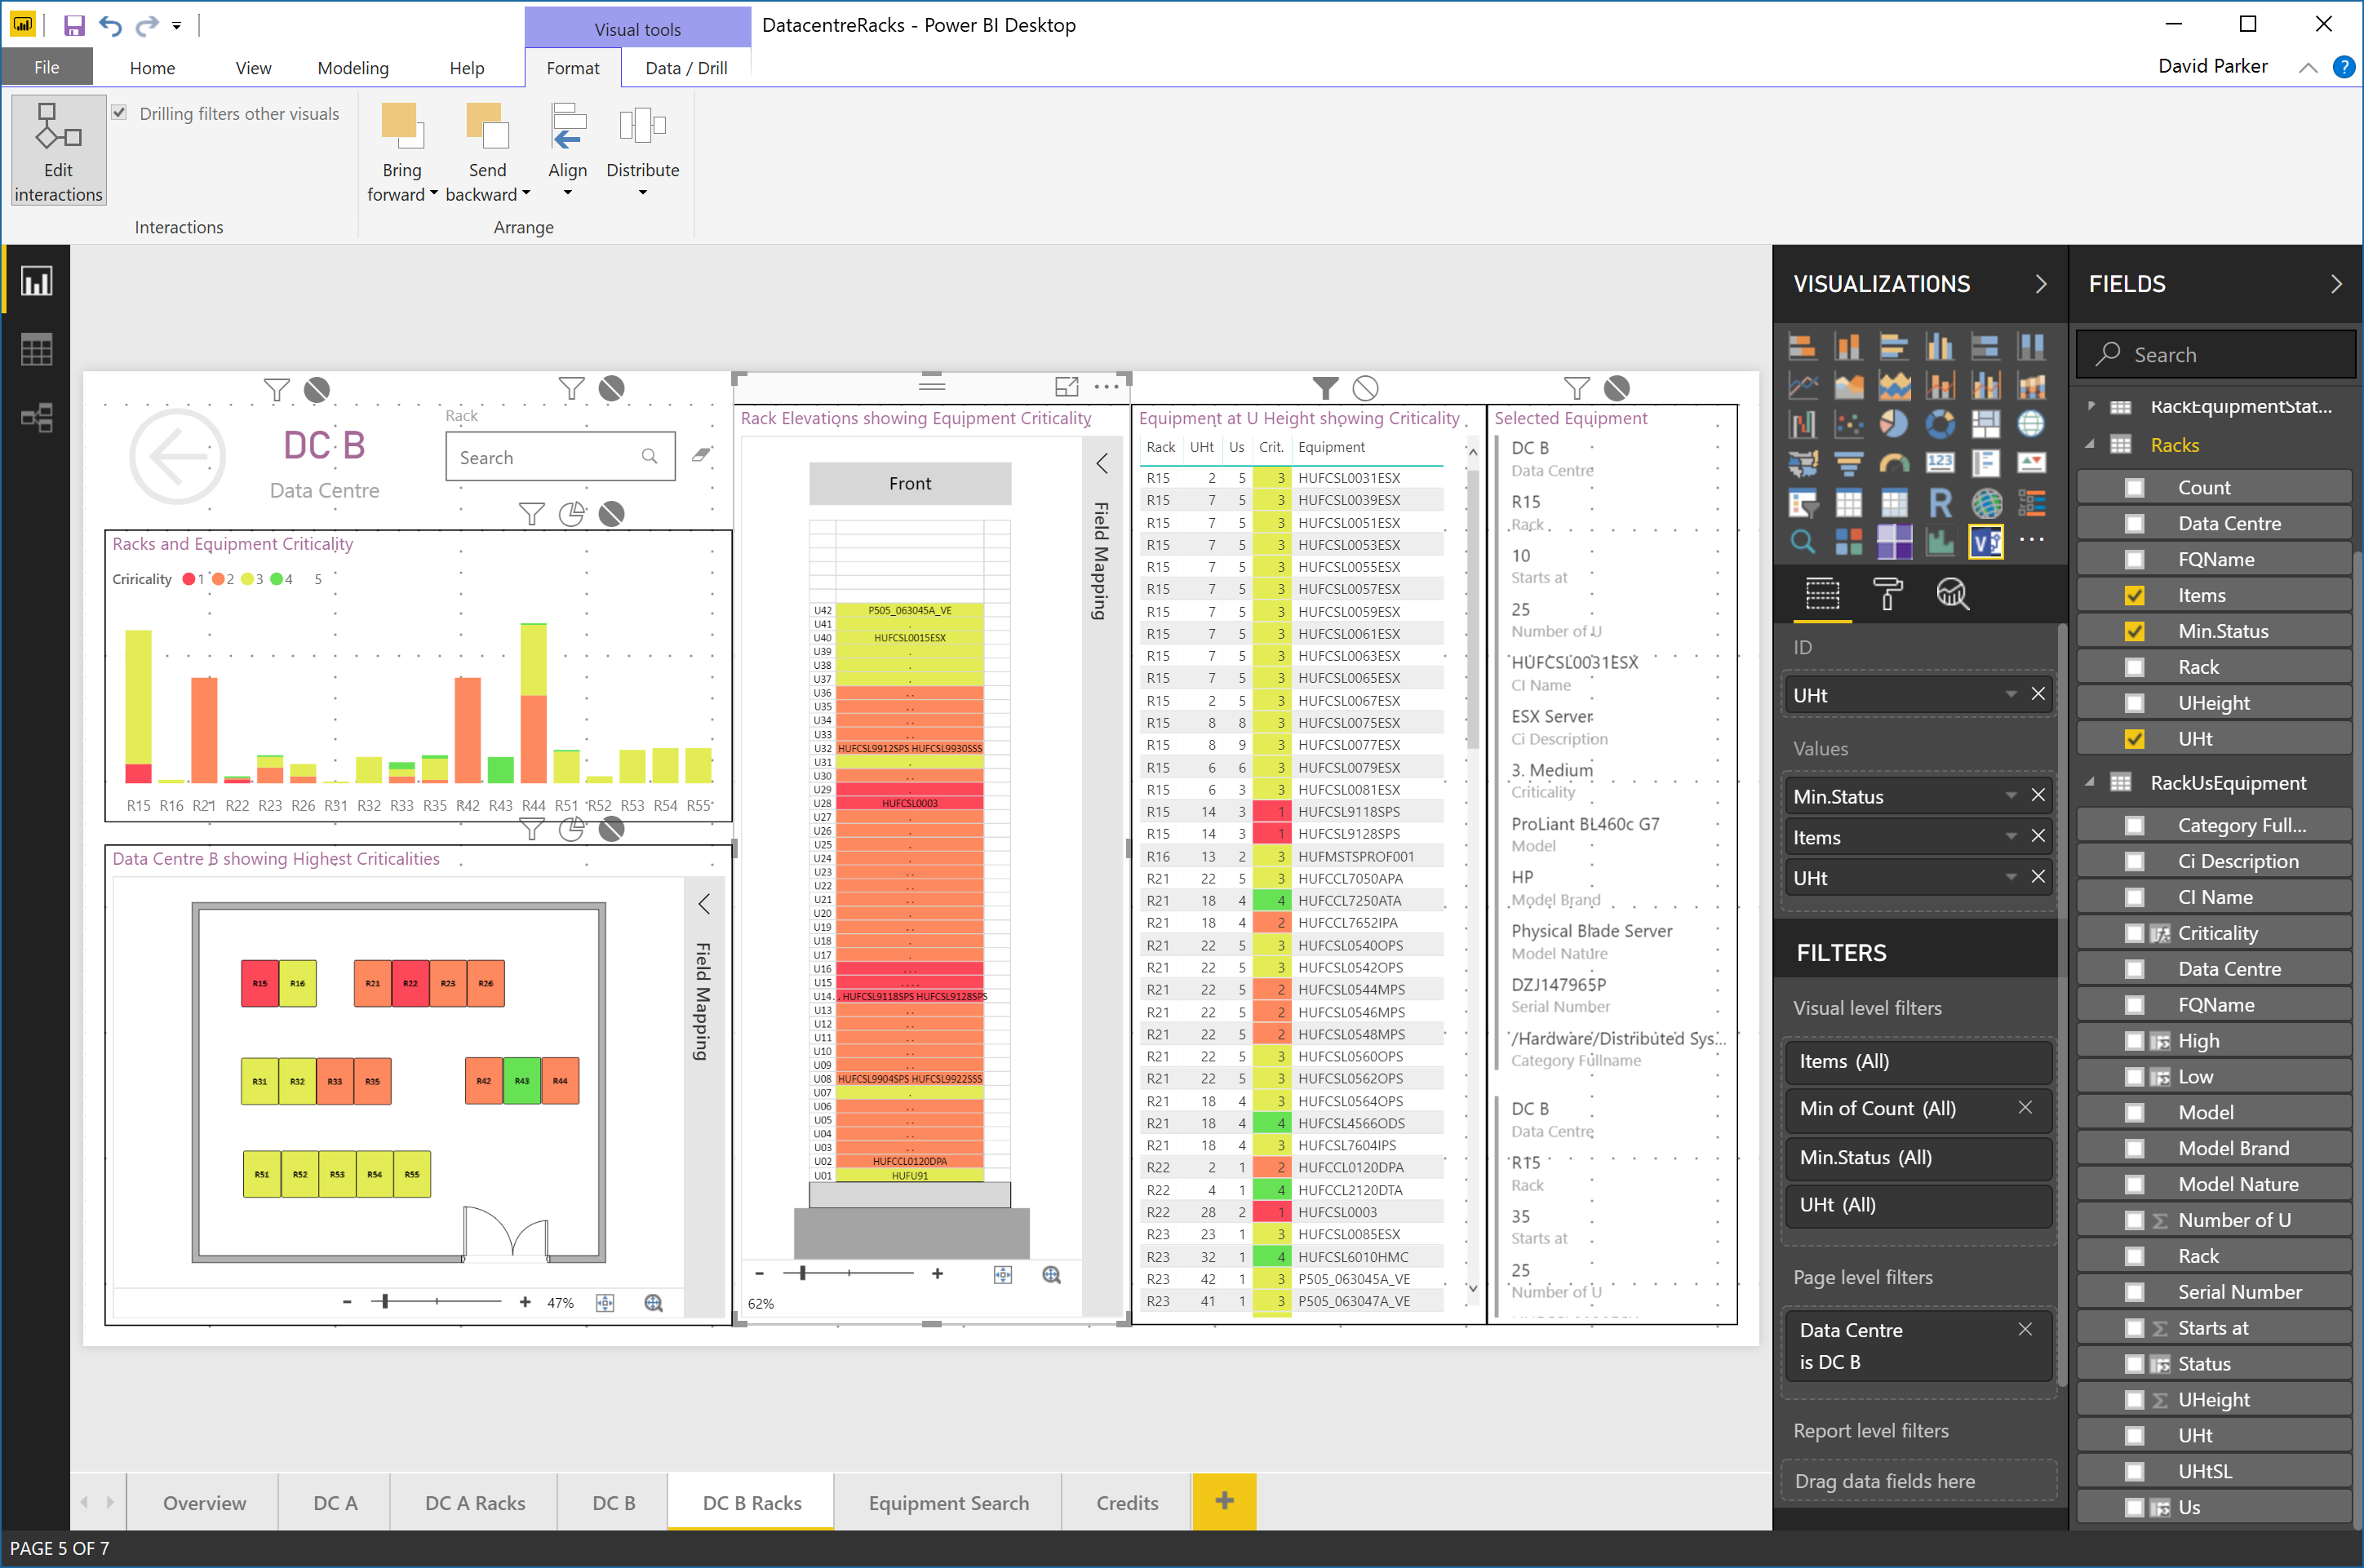
I have often diagrammed rack and cabinet layouts and elevations using Visio linked to a database or Excel tables. There is a Rack Diagram template in Visio which is great for manually creating cabinet elevations manually, but there is nothing currently out of the box to automate this process, so it can be a laborious task unless you have some custom code. It is quite simple to draw a computer room layout of the racks and cabinets and to link each one to a row of data. In this article, I have a table of rack equipment in Excel, and used PowerQuery in PowerBI to summarize these rows for each data center, rack and U height position, since there are sometimes more than one item of equipment per U height. In this example, I have color coded the criticality of each equipment such that the most important display as red, and the least important as green. This means that a PowerBI user can quickly see where the critical racks, U heights and equipment are. Of course, I could have used any metric, such as power consumption, heat output or humidity, for the colour-coding. It all depends on the data available, and the audience for the report.
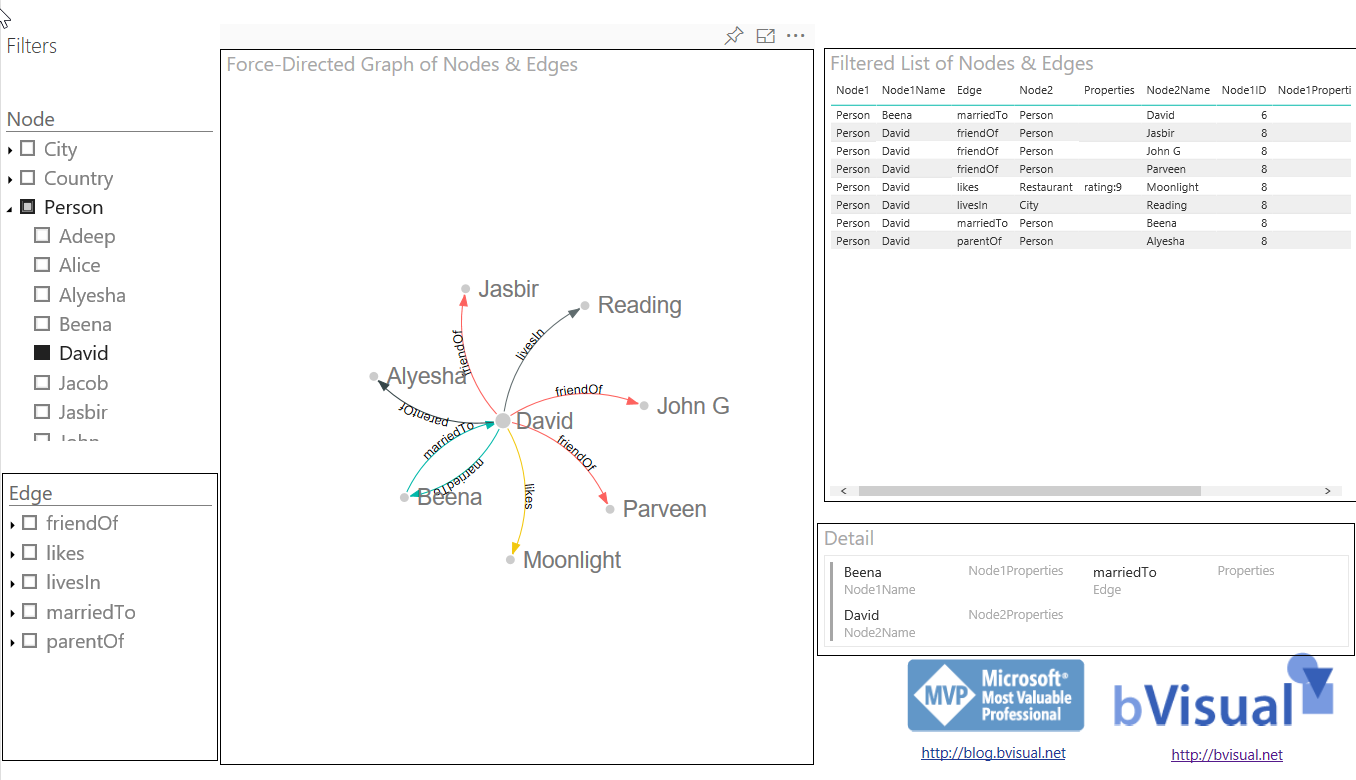
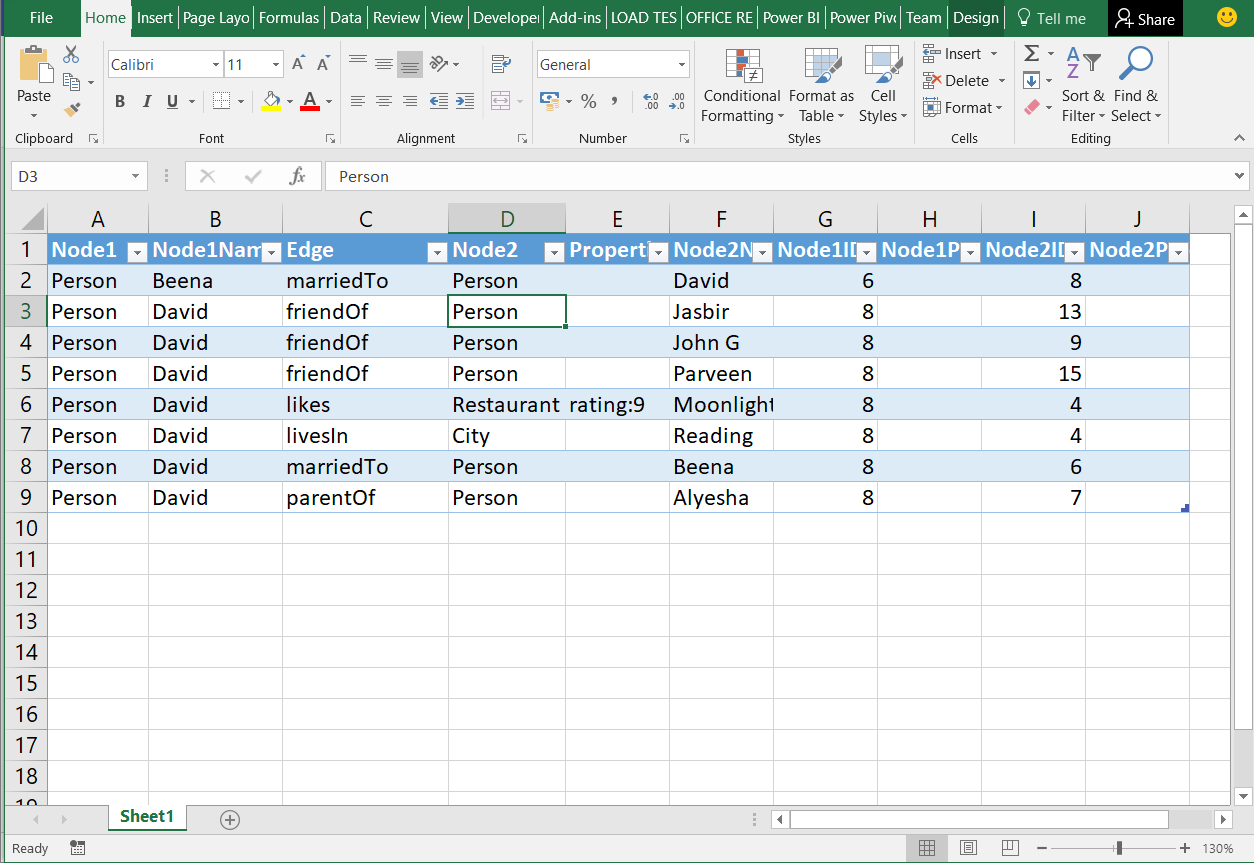
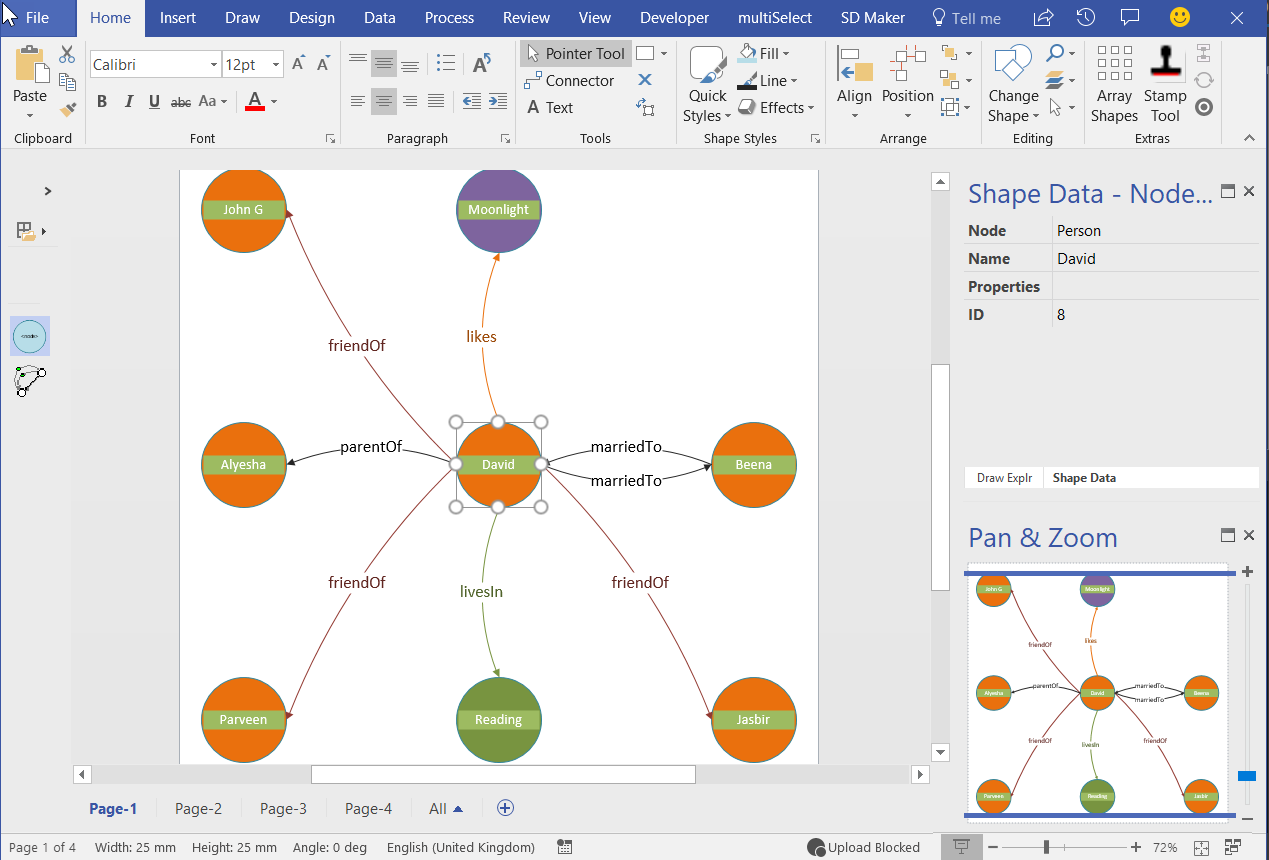
[Read more…] about Data Centre Racks in Visio in PowerBIIn my last article, I described how Visio can be used to input Nodes & Edges into a SQL Server graph tables (see Using #Visio and #PowerBI with #GraphDatabase in #SQLServer). In this article, I show how PowerBI can be used to create an Excel table that can then be used to automatically create a Visio diagram. This diagram can then be enhanced for reports and presentations, or used to check the validity of nodes and relationships. The shapes can then be used to update or delete edges and nodes in the database.
I am very excited to see that the preview for PowerApps in PowerBI has been released ( see Announcing availability of PowerApps custom visual for Power BI (preview) ). I saw this demonstrated months ago, and have been waiting impatiently ever since. Every time I have embedded a Visio diagram into PowerBI, I have wanted to display the selected shape data in a detail view … and now I can!
I cannot yet create a PowerBI report with the embedded PowerApps visual for consumption by the whole internet, but it should still solve many scenarios for organisations. I quickly added the new PowerApps visual to my example synchronised Org Chart and Desk Layout from my previous article ( #Visio in #PowerBI for viewing personnel hierarchies and locations ) , and recorded a simple selection in the following gif:
To do this, I simply created a default new PowerApps app from the queryOrg query in Excel workbook I created previously, and modified the Item value for the DetailForm of the DetailScreen. I removed the BrowseScreen and EditScreen because they were not required. Then, hey presto, the correct record is displayed whenever a shape is selected.