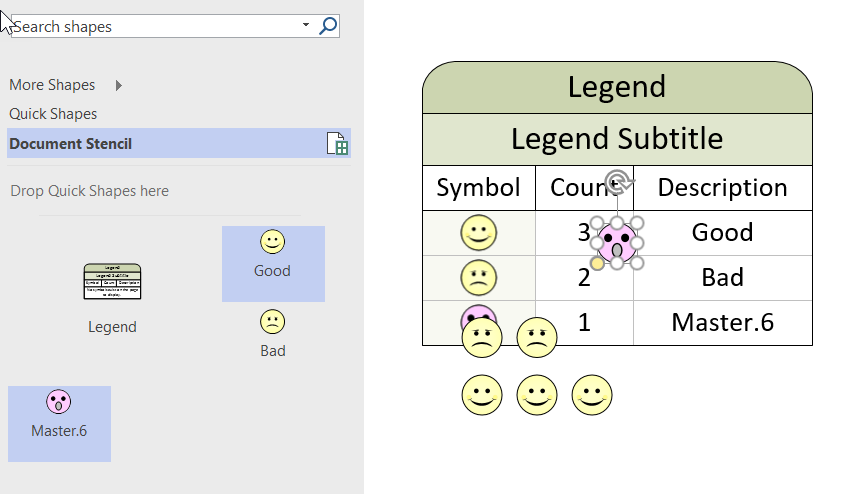
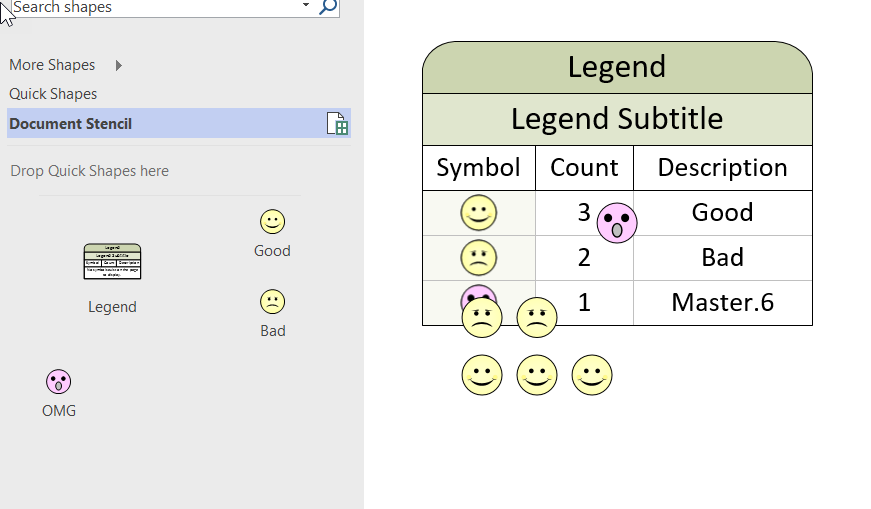
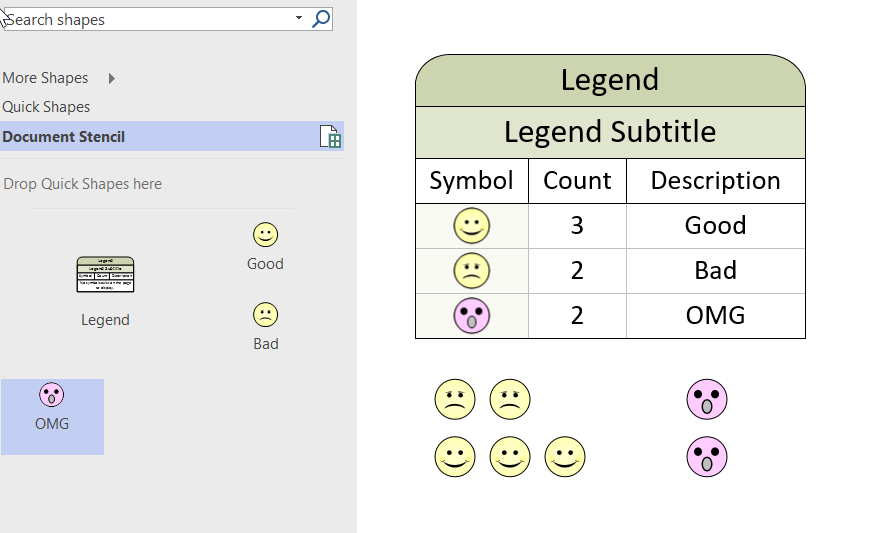
I wrote an article last year for Microsoft, using Visio to explain some bits of messaging and encryption (see Musings on MVP Open Day 2016 at Bletchley Park.pdf ). I finished the article with an unexplained image of a word, well the solution was obviously “BOWIE”, as written on the cover of his final album, Blackstar, released exactly one year ago today.
[Read more…] about A Blackstar alphabet in VisioShapeSheet Formulas
US State Flags for Visio
I am working on a project where I thought the US State flags might be useful, so I quickly created a new master shape from the images in Wikipedia. The shape simply provides a selection of one of the states from the Shape Data window (plus one extra for the reverse of Oregon’s flag!).
The flag shape has a couple of Shape Data rows:
New book available for pre-order : Mastering Data Visualization with Microsoft Visio Professional 2016
I have a new book on Visio coming out in June called Mastering Data Visualization with Microsoft Visio Professional 2016. It covers the ins and outs of data with Visio!
Please visit http://bit.ly/1SeVfwW for more information.
Packt Publishing are currently running a deal on my last book, Microsoft Visio 2013 Business Process Diagramming and Validation , until 12th April 2016:
Follow this link : 1LHNDwI
Displaying the Fill and Line Section Values of a shape
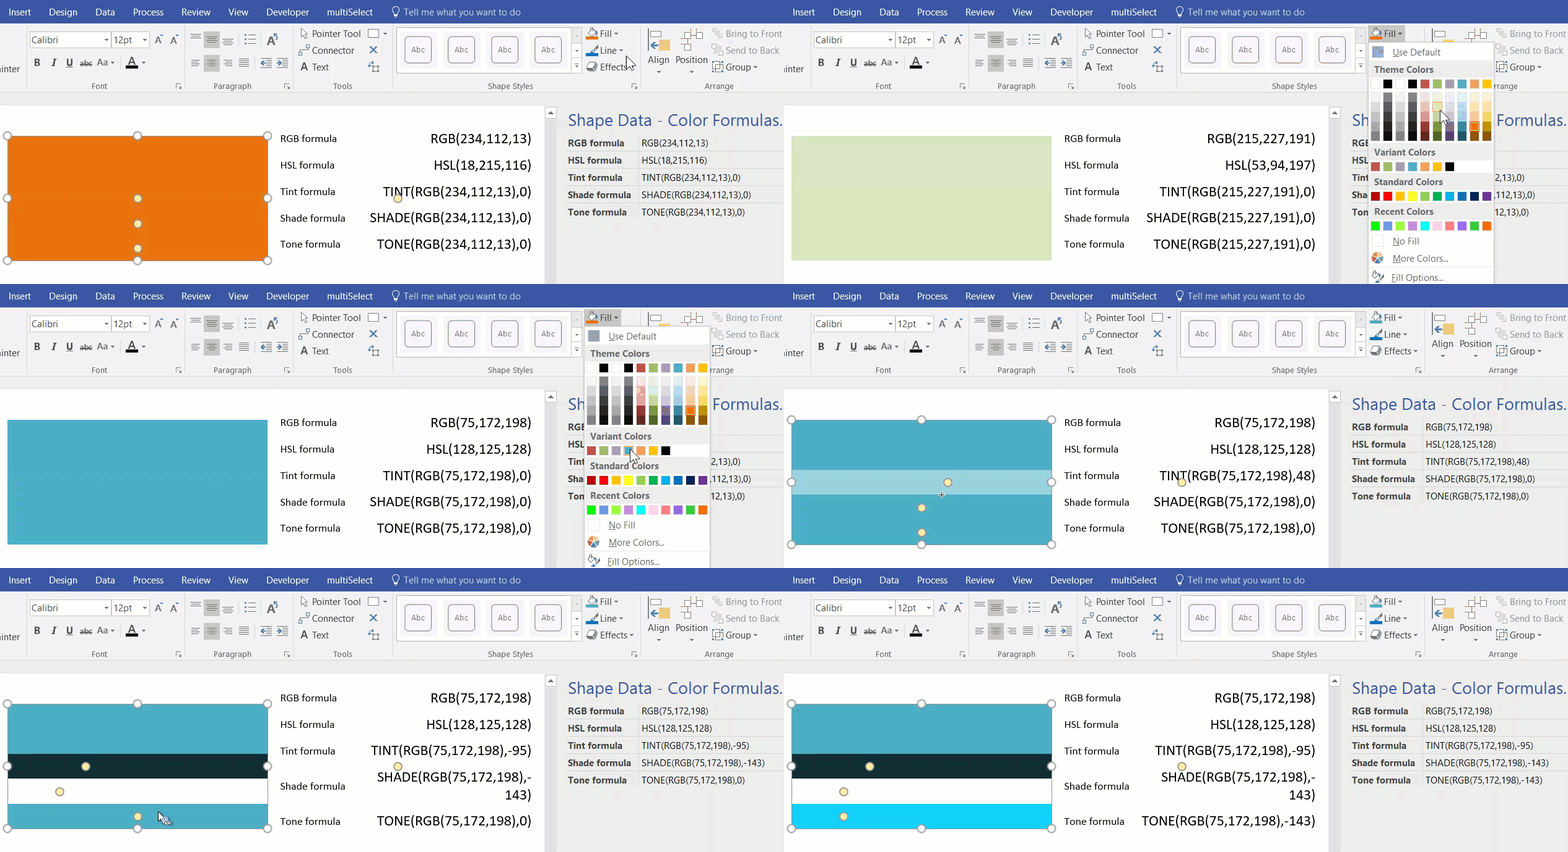
A few years ago, I wrote an article about displaying the RGB value of shapes ( see http://blog.bvisual.net/2010/04/22/displaying-the-rgb-values-of-shapes ). I had forgotten about it, but a reader recently asked if it was possible to force the Foregnd field to display the RGB value for the standard color palette values. For example, red is number 2 in the palette, and has a value of RGB(255,0,0). In revisiting the article, I realised that there is a smarter way to display the values, without the need of any macros.
I simply created a master shape that exposes each of the cells in the Fill and Line sections as Shape Data rows. This allows me to enter values in the Shape Data window and see the effect on the shape immediately. So, it was easy to drop one shape, insert text fields, and then use the Array Shapes tool to layout the shapes. Finally, I just entered the the standard color map numbers 0 to 24 in the FillForegnd Shape Data row.
[Read more…] about Displaying the Fill and Line Section Values of a shapeImproving the legend of multi-data Data Graphic items in Visio
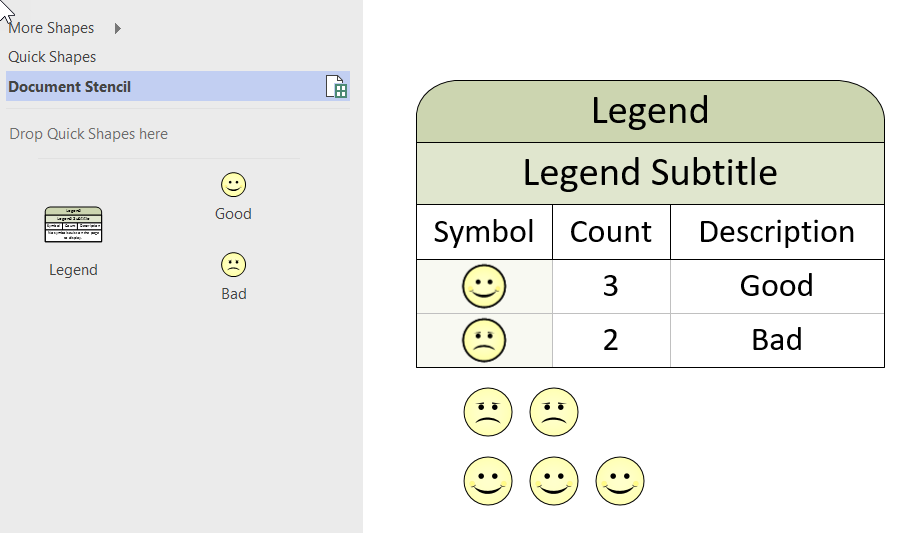
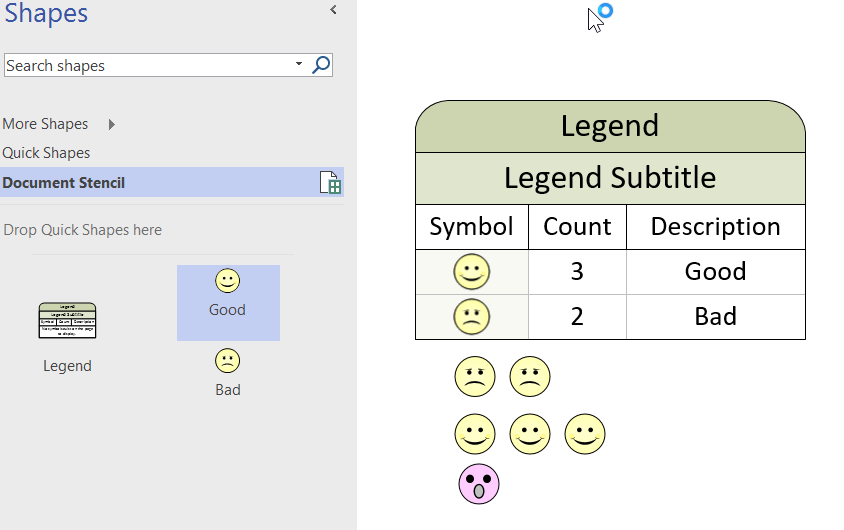
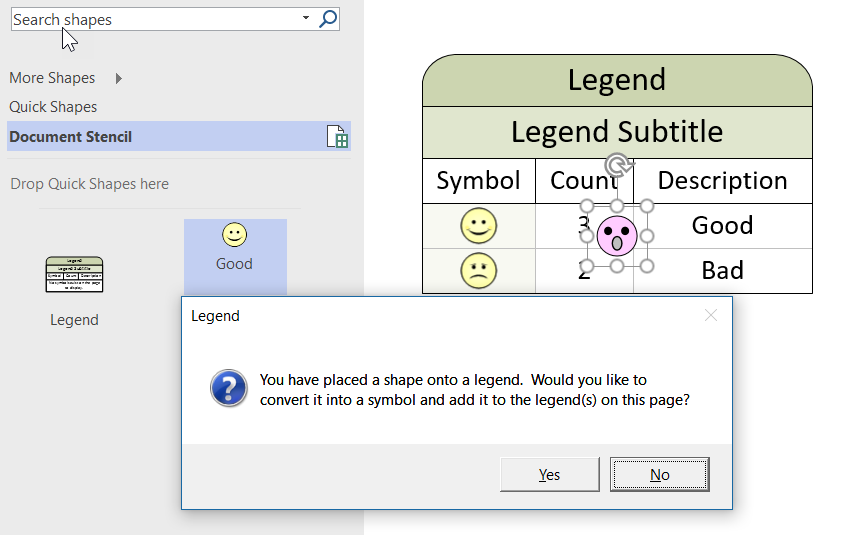
Data Graphics in Visio Professional (and Premium) are a great way of surfacing the information in each shape, but it can be easy to forget what the Color By Value, Icon Sets or Data-bars represent:
[Read more…] about Improving the legend of multi-data Data Graphic items in VisioDistributing Data Points Automatically on Maps in Visio
In my last article, I described how to calibrate a map in Visio ( see http://blog.bvisual.net/2015/05/26/calibrating-a-map-in-visio/ ), and in this article I use a calibrated map to distribute data points from a linked data source automatically.
For this example, I drew a simple shape at the size that I want, but you could add this smartness to any shape. All you need is an external data recordset that contains the Latitude and Longitude values that need to be linked to each data point.
[Read more…] about Distributing Data Points Automatically on Maps in Visio