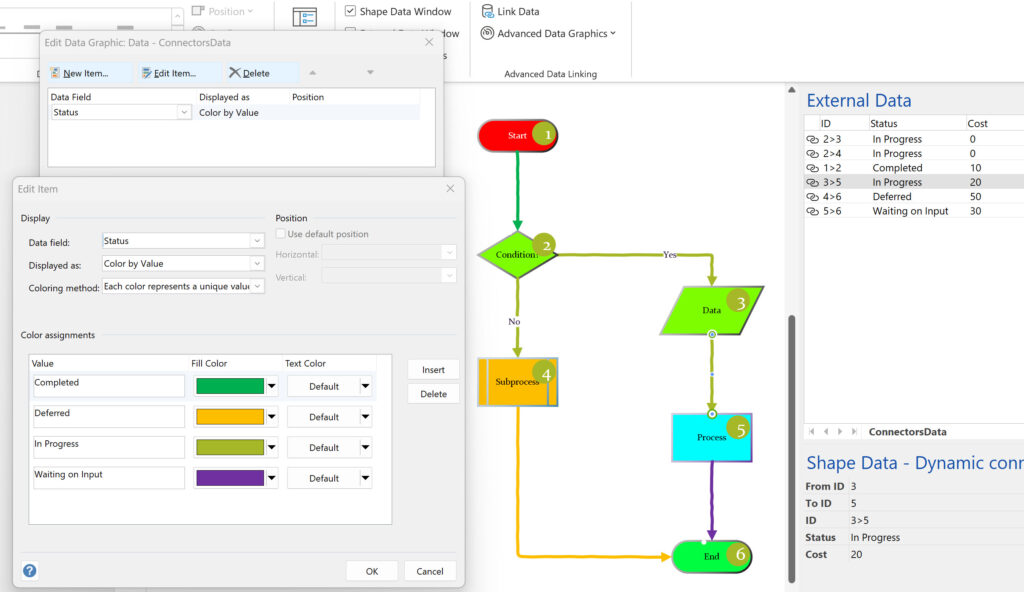
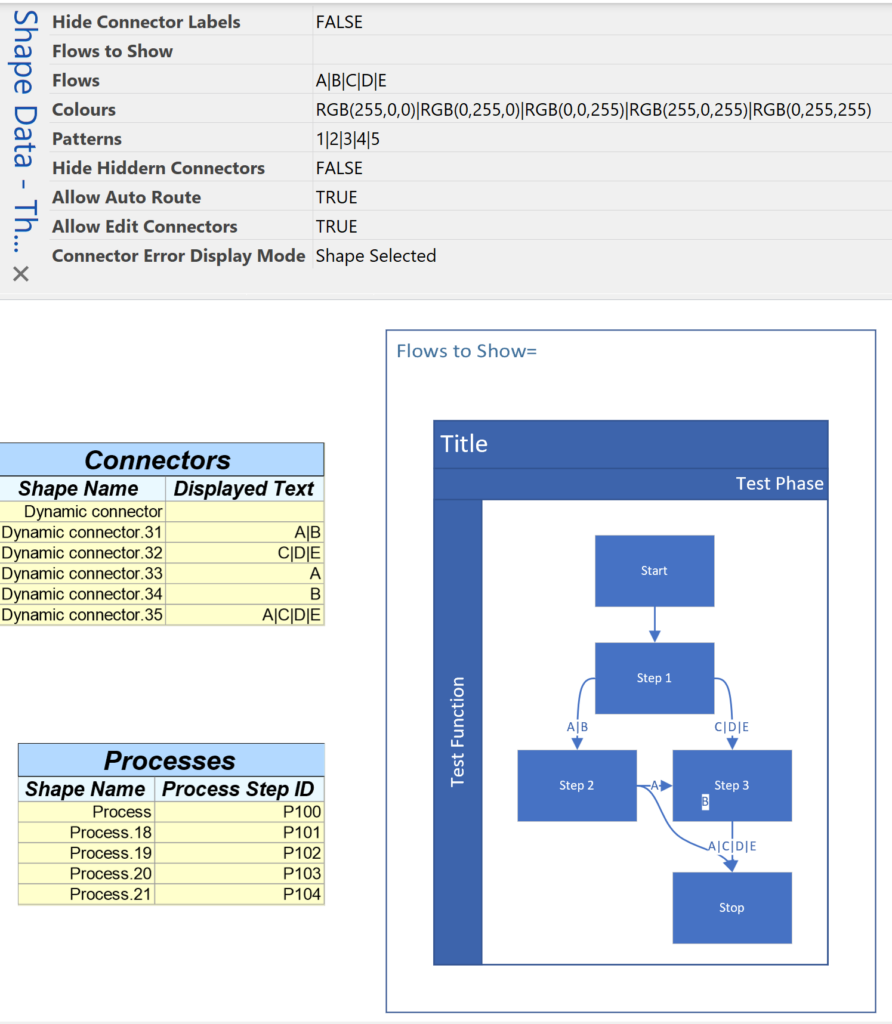
I was recently contacted by a reader, Stanley M. Max (Towson University lecturer), who had started creating a Visio map of the 27 countries in the European Union in 2020, along with the demographics culled from Wikipedia. He wanted to know if the map and stats could be combined to make a more appealing presentation. Well, that prompted me to not only combine the data and country shapes, but to explore ways in which a presentation of the map can be made more interesting in Visio. So, I added data and hyperlinks to the shapes, and set up a page property for the selected country which automatically highlights the country shape, statistics, and header, to which I added flags. So, the user can either set the page country using the Shape Data window for the page, or context menu of each country, or simply by double-clicking.
[Read more…] about Interactive Demographics of the European Union in VisioShape Data
Pushing Data Visualizer in Visio beyond its limits
My last post was about some of the lessons learnt when trying to push Data Visualizer to its limits, but this one has some ways of overcoming these limitations. The main lesson learnt is that DV binds the shapes within the DV container shape, CFF Data Visualizer, and controls some of the ShapeSheet cells that are normally available for customization. The label of the connector is bound to the respective column in the Excel table, and that, combined with the ability to modify the Dynamic connector master shape provides a way of overcoming some of the limitations discovered.
So, given that we want to use DV, and we need to have multiple flows between the same shapes, then they cannot be separate connectors. We need to combine multiple flows onto the same connector, and then find a way to selectively display different flows somehow by controlling the visibility of the connectors. However, we cannot make them invisible because they will be deleted by DV, so we need to control their transparency instead. We can do this by interpreting the label somehow, and we are going to modify the Dynamic connector to react to the text of the label, and we can also change the colour and line pattern too.
The following screenshots show the Excel table with the multiple flows between the same shapes concatenated with pipe characters, and the diagram created by Data Visualizer when this table is imported into a custom template using Data \ Create from Data \ Create:
[Read more…] about Pushing Data Visualizer in Visio beyond its limitsPushing Data Visualizer in Visio to the limits!
Regular readers of my blog will know that I like to use the Data Visualizer (DV) in Visio Plan 2, but I recently tried to help a user who really decided to push it to the limits. In this scenario, there were multiple connections, but with different labels, being created between the same flowchart shapes, and the plea was how to make it work! Well, I experimented with this, and found that DV does not really work well in this way, and then proposed an alternative approach, which I will explain in this article.
First, I will show how it fails by setting up an Excel table that does contains multiple connections, but fails to update the labels consistently.

Linking Data to Visio Shapes in Code
One of the most useful capabilities of Visio Professional and Visio Plan 2 is to link external data to shapes and have them refreshed by changes in the data source. So, many of my solutions involve writing code to make these links, and they are covered with some VBA examples in my book, Mastering Data Visualization with Microsoft Visio Professional 2016, but I mostly write C# code in VSTO add-ins, so I thought it would be useful to demonstrate how easy it is to create data links by dropping a shape, and by adding links to an existing shape. The book, by the way, is still relevant for the current Visio Professional and Visio Plan 2 editions!

Visio Shape Report Converter Excel add-in available
I am delighted to announce that I have just had my first Excel add-in accepted in the Office Add-ins Store! It is called Shape Report Converter because all it does is convert a Shape Report converted from Visio for Desktop to a modern Excel table with one click!

It isn’t a complicated add-in, and it doesn’t do anything that you can’t do manually, but it does save time, and ensures consistency … and it is free!
[Read more…] about Visio Shape Report Converter Excel add-in availableA Multi-Time Zone Clock for Visio
I wrote a post about making a clock face in Visio fifteen years ago, but a reader recently asked about displaying multiple time zones. Well, I have previously written about time zones in Visio, so I accepted the challenge to improve upon my earlier work.
