• Skip to main content
  • Skip to primary sidebar
  • Skip to footer

bVisual

  • Home
  • Services
    • How Visio smartness can help your business
    • Visio visual in Power BI
    • Visio Consulting Services
    • Visio Bureau Services
    • Visio Training and Support Services
  • Products
    • Visio Shape Report Converter
    • SS Plus
    • LayerManager
    • visViewer
    • Metro Icons
    • Rules Tools for Visio
    • The Visio 2010 Sessions App
    • Multi-Language Text for Visio
    • Document Imager for Visio
    • multiSelect for Visio
    • pdSelect for Visio
  • Case Studies
    • Case studies overview
    • Using Visio in Education for GIS
    • Visualizing Construction Project Schedules
    • Visio Online Business Process Mapping
    • Nexans Visio Template
    • CNEE Projects, WorldCom
    • Chase Manhattan Bank
  • News
    • Recent news
    • News archive
  • Resources
    • Articles➡
      • ShapeSheet Functions A-Z
      • Comparing Visio for the Web and Desktop
      • Customising Visio Shapes for the Web App
      • Key differences between the Visio desktop and web apps
      • Using the Visio Data Visualizer in Excel
      • Using Visio in Teams
      • Creating Visio Tabs and Apps for Teams with SharePoint Framework (SPFx)
      • Designing Power Automate Flows with Microsoft Visio
      • Innovative uses of Visio Lists
    • Webcasts ➡
      • Visio in Organizations
      • My session and other Visio sessions at MSIgnite 2019
      • Power up your Visio diagrams
      • Vision up your Visio diagrams
      • The Visio 2010 MVP Sessions
    • Visio Web Learning Resources
    • Books➡
      • Visualize Complex Processes with Microsoft Visio
      • Mastering Data Visualization with Microsoft Visio
      • Microsoft Visio Business Process Diagramming and Validation
      • Visualizing Information with Microsoft Visio
  • Blog
    • Browse blog articles
    • Visio Power BI articles
    • Visio for Web articles
    • A history of messaging and encryption
  • About us
    • About bVisual
    • Testimonials
    • Bio of David Parker
    • Contact Us
    • Website Privacy Policy
    • Website terms and conditions
    • Ariba Network

Shape Design

Published on August 12, 2015 by David Parker

Visualising SharePoint and SQL Data with Visio Professional

I will be venturing to the dark side of the moon on Saturday 12th September 2015 at SQL Saturday in Cambridge, UK ( see http://www.sqlsaturday.com/411/EventHome.aspx ).

[Read more…] about Visualising SharePoint and SQL Data with Visio Professional

Filed Under: External Data, Shape Data, SQL Server, Validation, Visio 2013, Visio Services Tagged With: SharePoint 2013, SQL

Published on July 24, 2015 by David Parker

Formatting Shape Data in Visio

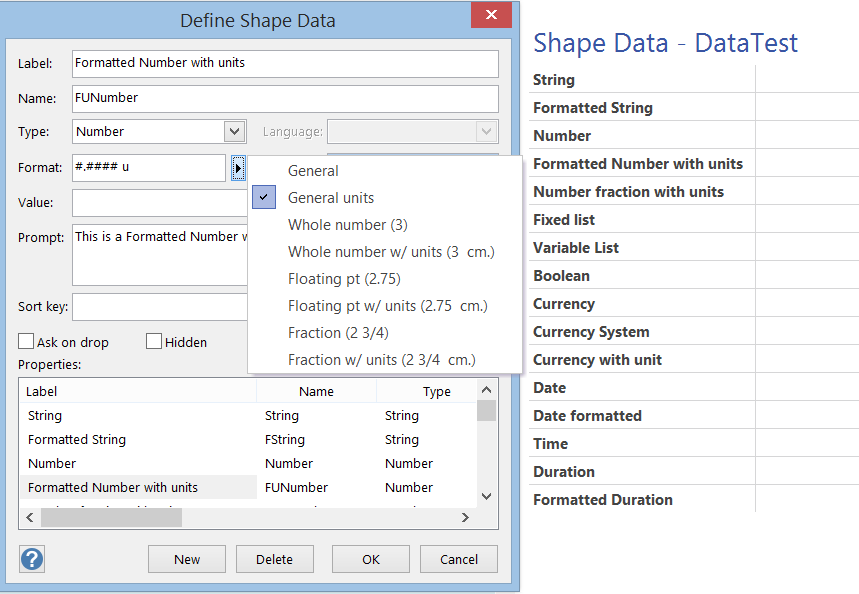
One of the best aspects of Visio is the ability of shapes to hold data, and the easiest way to do this is to define rows of Shape Data. Each row can be defined as holding one of eight different types, and most of these can have their values formatted for display. In this article I discuss the formatting of these values, using either ShapeSheet functions or automation methods. The driver for this is my on-going frustration with the Microsoft provided standard Shape Data window because of its shortcomings … for example, its lack of multi-line support even though it can hold 64k characters in each row, and its lack of a time control, even though it can store dates and time.
image
[Read more…] about Formatting Shape Data in Visio

Filed Under: Shape Data, VBA, Visio Tagged With: Shape Data, ShapeSheet Functions

Published on June 18, 2015 by David Parker

Microsoft Visio 2013 Themes

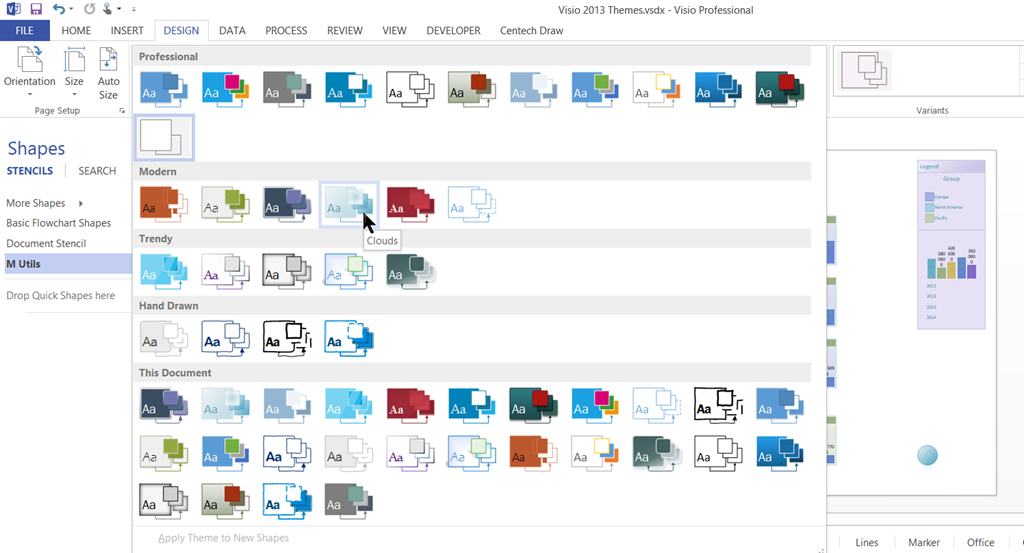
Visio supports Microsoft Office themes with their variants, and I have been experimenting with their affect on data graphics, so I thought I would create a document with examples of each theme applied to some data graphics. I would hesitate before using some of these, but it is interesting to see the appearance of each.
image


[Read more…] about Microsoft Visio 2013 Themes

Filed Under: Themes, Visio 2013 Tagged With: Link Data to Shapes, SQL, Themes

Published on May 27, 2015 by David Parker

Distributing Data Points Automatically on Maps in Visio

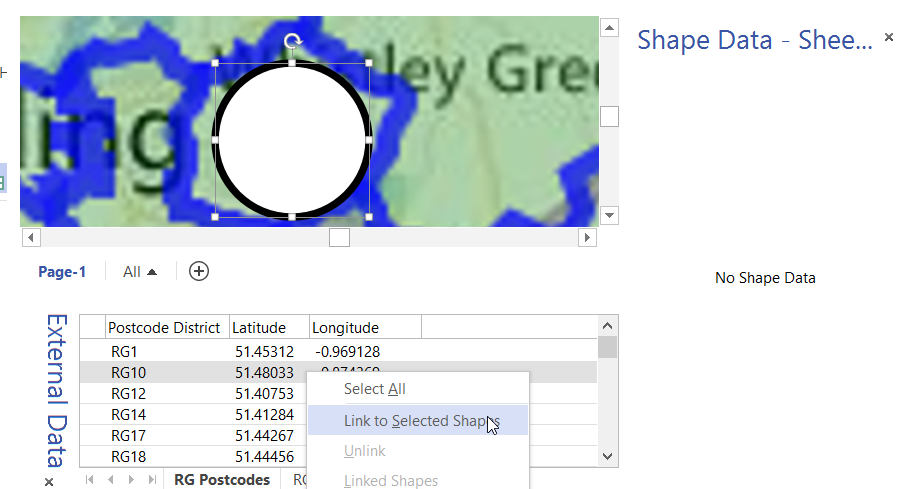
In my last article, I described how to calibrate a map in Visio ( see http://blog.bvisual.net/2015/05/26/calibrating-a-map-in-visio/ ), and in this article I use a calibrated map to distribute data points from a linked data source automatically.

For this example, I drew a simple shape at the size that I want, but you could add this smartness to any shape. All you need is an external data recordset that contains the Latitude and Longitude values that need to be linked to each data point.
image
[Read more…] about Distributing Data Points Automatically on Maps in Visio

Filed Under: Bing Maps, External Data, Geographic, Shape Data, ShapeSheet Formulas, Visio 2013 Tagged With: Link Data to Shapes, Shape Data, ShapeSheet Functions

Published on April 17, 2015 by David Parker

Visio Org Charts with Multiple Languages

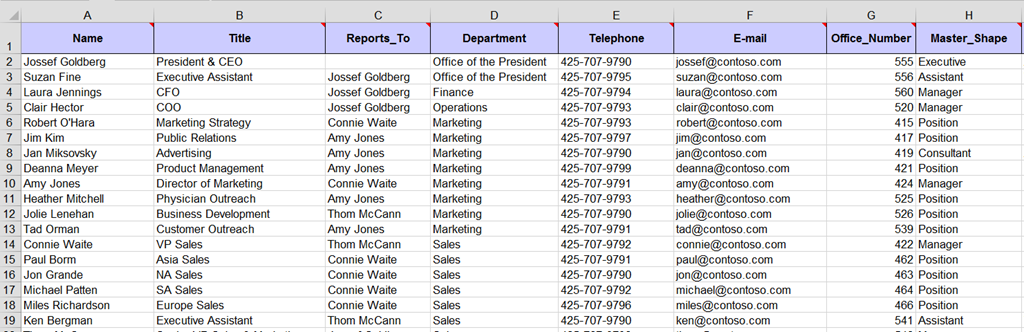
I had an enquiry recently about displaying Organisation Charts with text in different languages. This set me thinking, and, if you have Visio Professional, then you can use Link Data to Shapes to add this capability to existing diagrams, but Visio Standard users can just the Org Chart Wizard.

I will use the OrgData.xls file that is provided in the <Program Files>\Microsoft Office\Office 15\Visio Content\<LCID>\ folder to demonstrate this. I have English US (1033) and Norwegian Bokmal (1044) available to me, as shown below:

In Englsih
image
[Read more…] about Visio Org Charts with Multiple Languages

Filed Under: Data Graphics, External Data, Org Charts, Shape Data, Visio 2013 Tagged With: Link Data to Shapes, Org Chart

Published on March 18, 2015 by David Parker

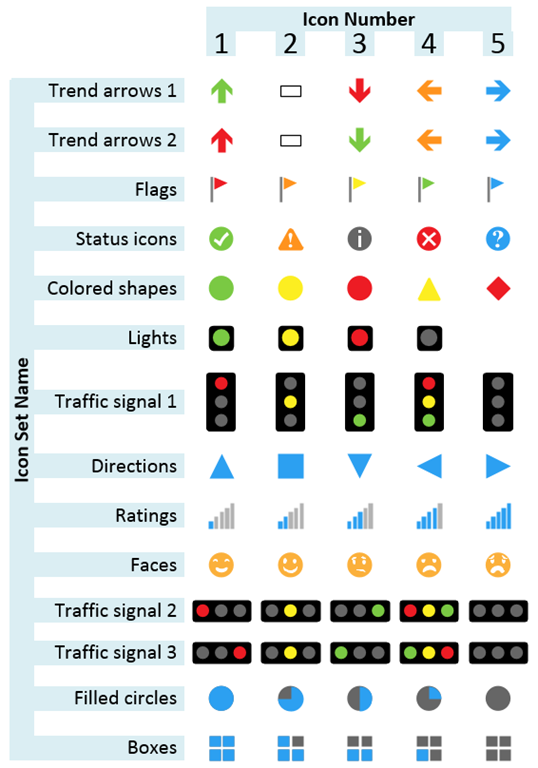
A Table of Visio Data Graphic Icon Sets

I have previously written blog articles about using, and extending, the Microsoft supplied Data Graphic Icons Sets, but I never explicitly listed their variations in a useful visual table. So, here is one:
image
[Read more…] about A Table of Visio Data Graphic Icon Sets

Filed Under: Data Graphics, Visio Tagged With: Data Graphics, Icon Sets, Visio 2013

  • « Go to Previous Page
  • Page 1
  • Interim pages omitted …
  • Page 22
  • Page 23
  • Page 24
  • Page 25
  • Page 26
  • Interim pages omitted …
  • Page 36
  • Go to Next Page »

Primary Sidebar

  • LinkedIn
  • Twitter

Recent Posts

  • Introducing a free Visio Report Runner application
  • Protecting the integrity of custom Visio masters
  • Docked Stencils in Visio for the Web
  • My Visio Books and Old pre-C# Work
  • Migrating from Lucidchart to Visio?

Categories

Tags

Accessibility Add-Ins AdvancedInstaller Connectors Containers Data Export Data Graphics Data Import Data Visualizer Educational Excel GraphDatabase Hyperlinks Icon Sets JavaScript LayerManager Layers Legend Link Data to Shapes MSIgnite Office365 Org Chart PowerApps PowerBI PowerQuery Processes Setup and Deployment Shape Data Shape Design ShapeSheet ShapeSheet Functions SharePoint 2013 SQL Teams Validation VBA Video Visio Visio 2007 Visio for the desktop Visio for the Web Visio Online Visio Services Visio Viewer Webinar

Footer

bVisual Profile

The UK-based independent Visio consultancy with a worldwide reach. We have over 25 years experience of providing data visualization solutions to companies around the globe.

Learn more about bVisual

  • Amazon
  • E-mail
  • Facebook
  • LinkedIn
  • Twitter
  • YouTube

Search this website

Recent posts

  • Introducing a free Visio Report Runner application
  • Protecting the integrity of custom Visio masters
  • Docked Stencils in Visio for the Web
  • My Visio Books and Old pre-C# Work
  • Migrating from Lucidchart to Visio?

Copyright © 2026 · Executive Pro on Genesis Framework · WordPress · Log in