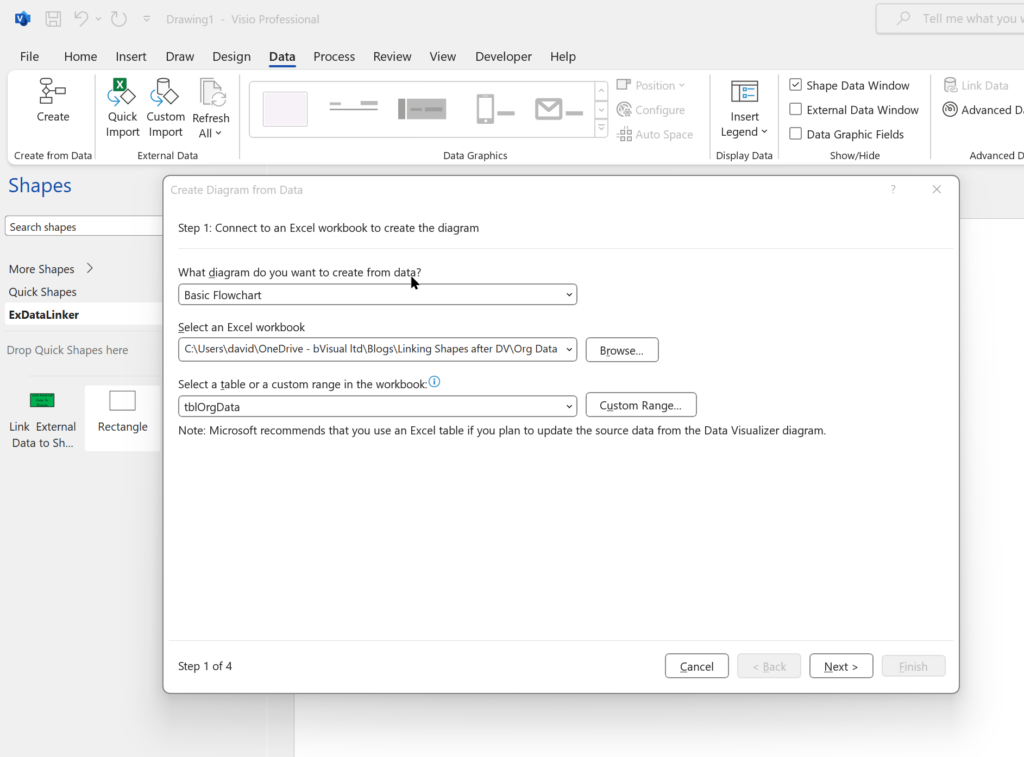
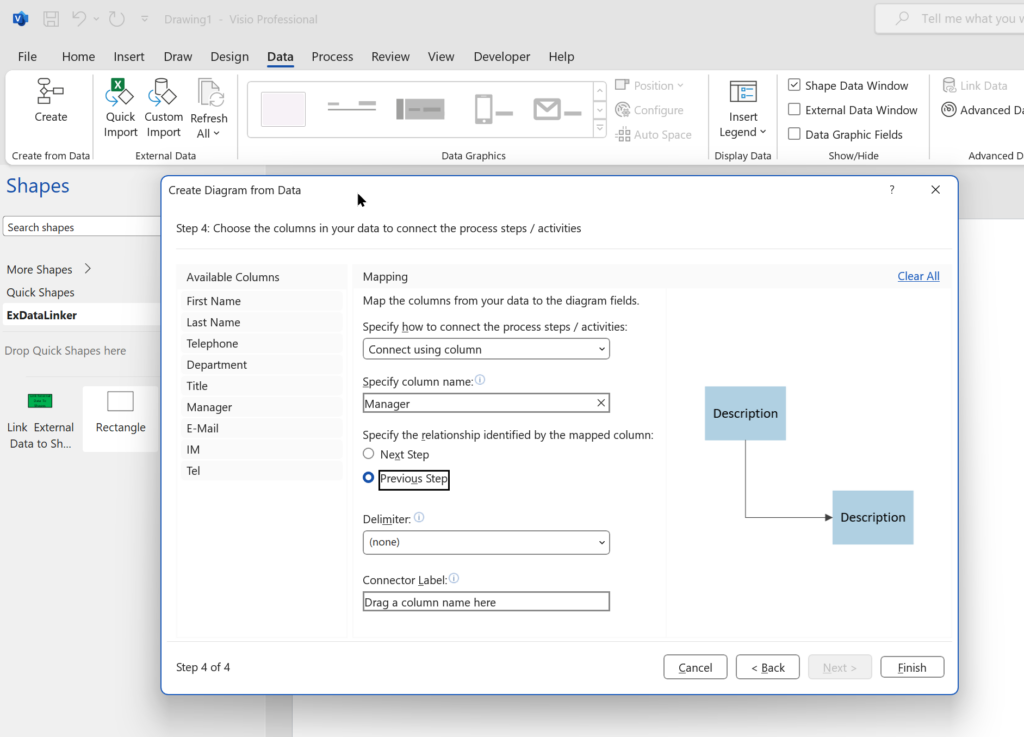
Data Visualizer (DV) in Visio Plan 2 (Data | Create from Data | Create ) is great because it provides a way of automatically creating a diagram from data, but it also prevents some of the other data-linking features in Visio from being used. This is because DV wants to take control of the data in the shapes to provide refreshes from the data source or send updates to the data source. This can be very annoying if you use DV to create the initial layout, then you enhance this, so it looks just perfect, and then you just want to update some of the data without affecting the layout. DV may re-layout your carefully crafted diagram, even if there are no updates to the data that should do that. Also, you may want to integrate data from other sources that were not available or accessible to the table or query used for by Data Visualizer. This is when you may want to use Data | External Data | Custom Import which also provides a much greater number of data source types. In this article, you will learn how you can do this manually, or automate it with the help of a little VBA code (or similar).
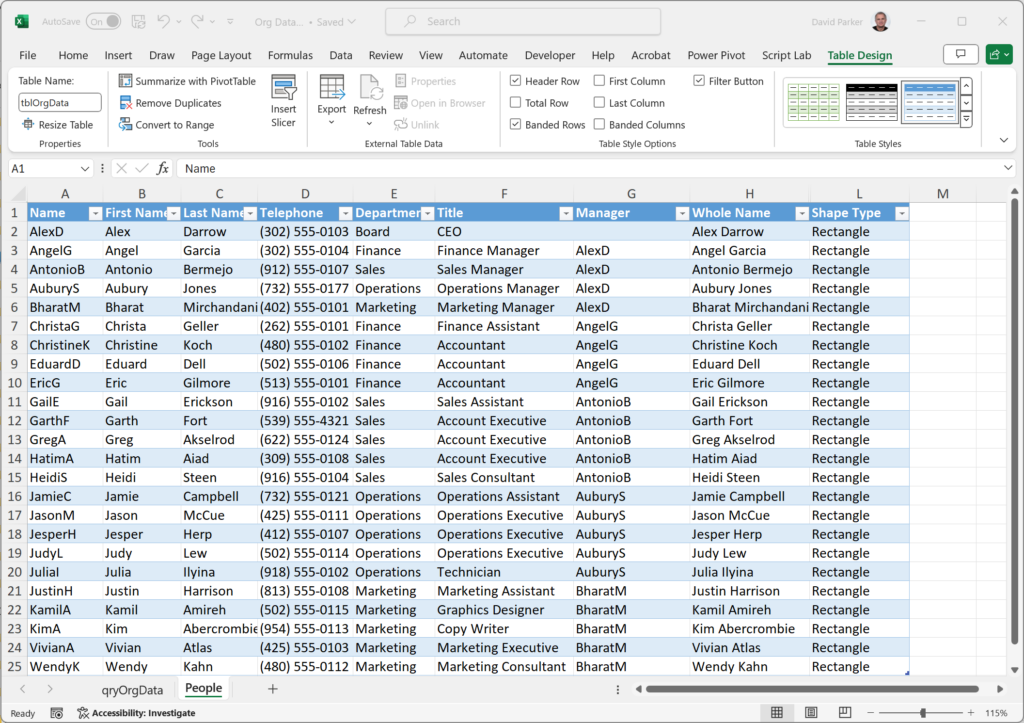
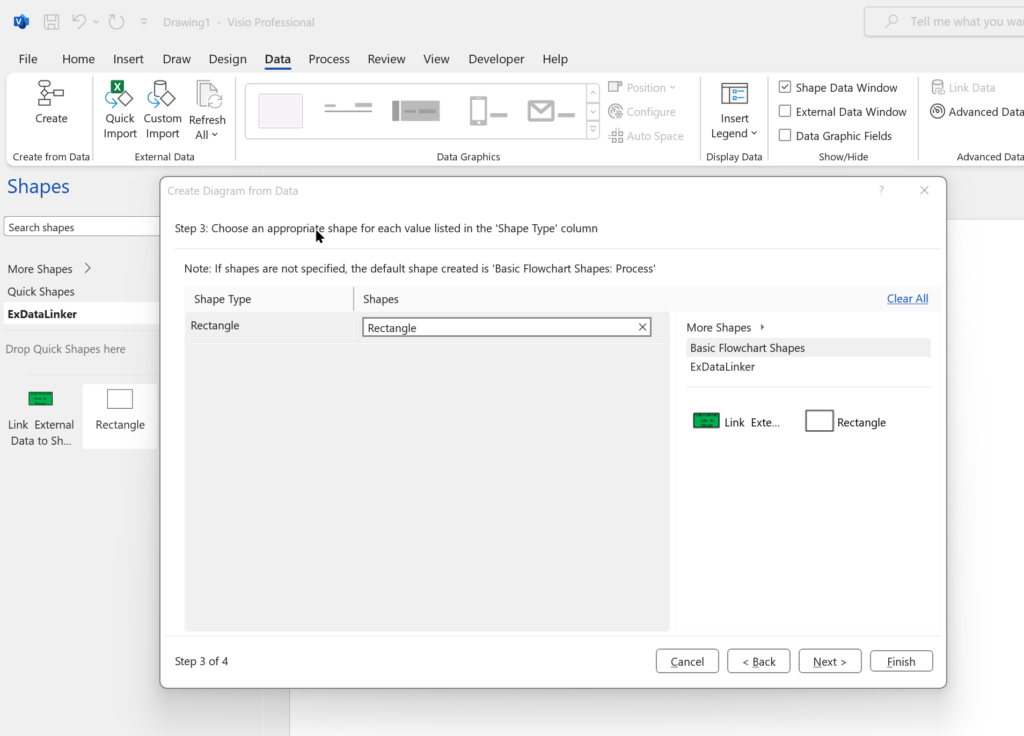
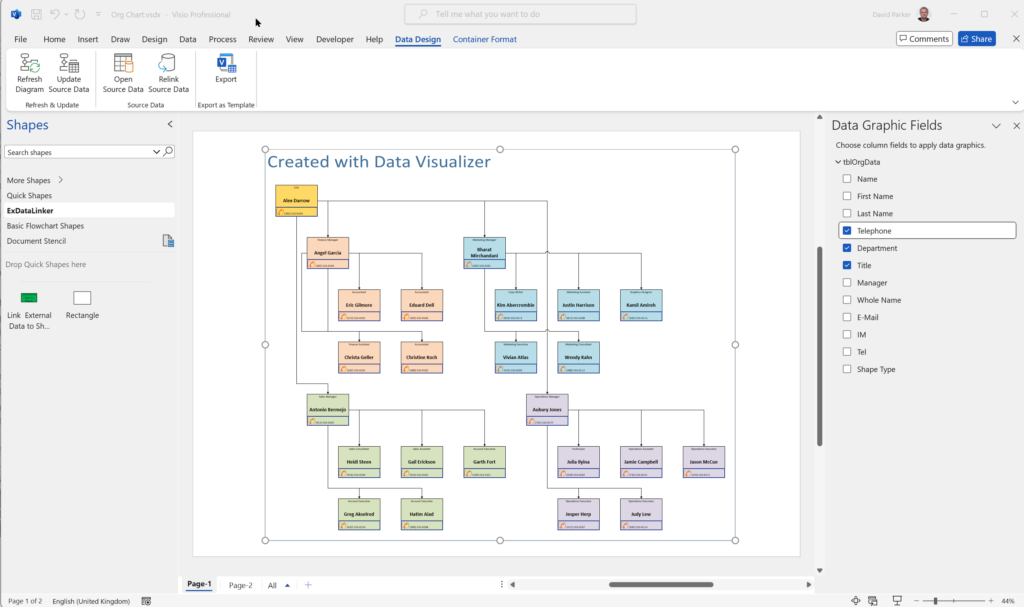
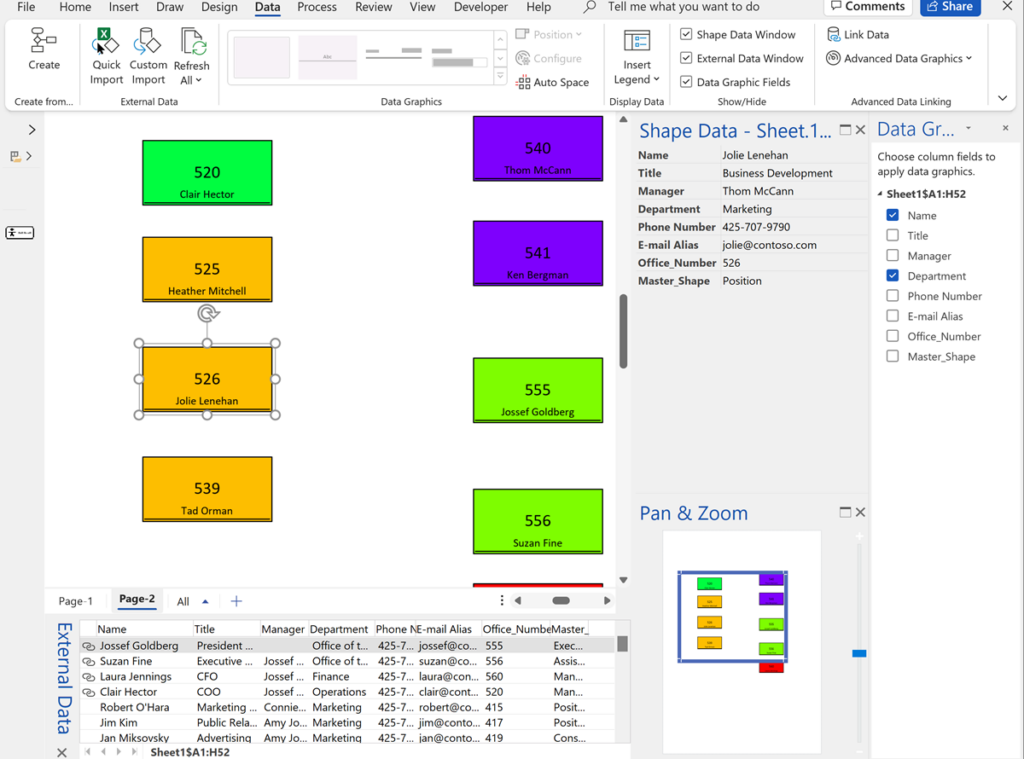
In this example, I have used table of personnel that I have used before, but added an extra column, Shape Type, that simply has the value Rectangle, which is simply the name of a simple Master shape that I have added to my macro-enabled stencil, ExDataLinker.vssm.