I suppose I should explain what I mean by dirty text first 🙂
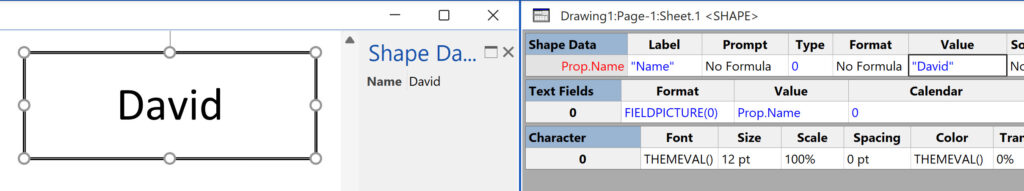
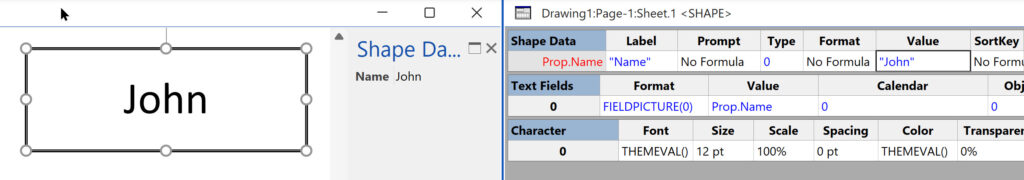
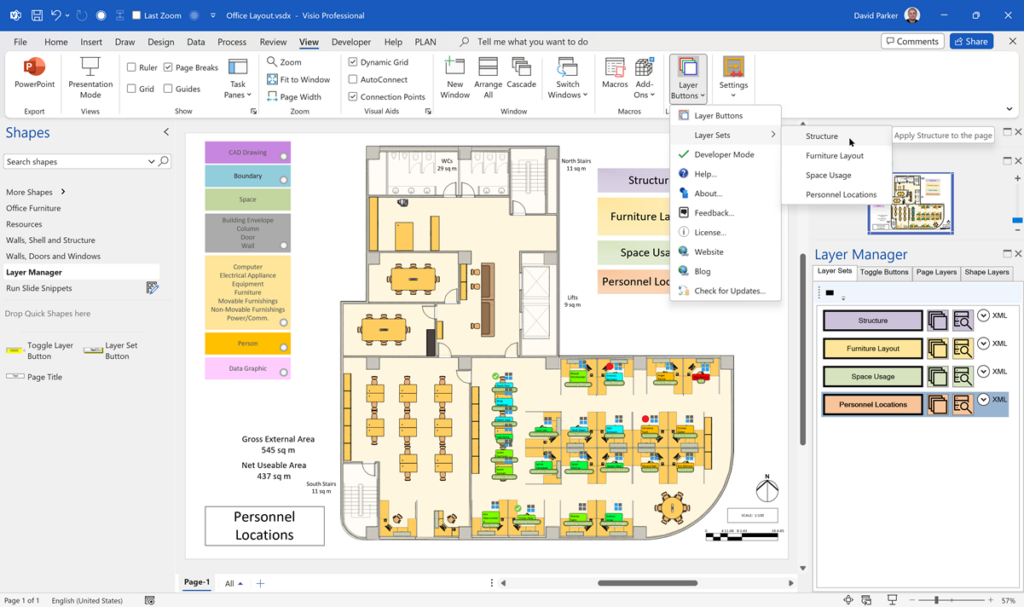
I often display the value of a Shape Data row in Visio text, but sometimes the solution requires that the value is also editable. This is ok if the client accepts that all editing is done with the Shape Data window or dialog, but not if the user more naturally wants to edit the text in the shape. In my current solution, I want to pass the manually edited text to another process for checking, and then only update the Shape Data row when validated or accepted, before re-setting the text with the inserted field. My first task was to spot with text had been manually overtyped, so I decided that checking the value of a new User-defined Cell, called IsDirty, was best, and then this value can be used to change the color of the text (or it could be the LineColor or FillForegnd) to make this value visible.
When Insert / Field is used in Visio, it creates a Text Fields section which can hold the reference to the inserted field.
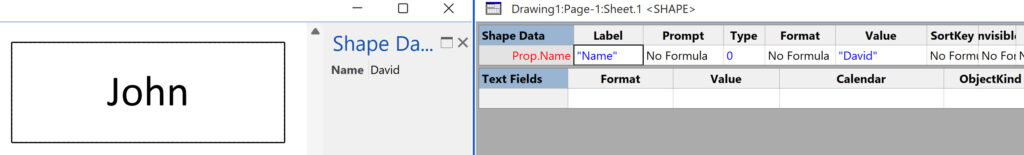
If the text is manually overtyped, then the rows in the Text Fields section get deleted.