I was recently asked how to change the default font size and line weight in Visio, and then saw then many others are asking the same sort of question. I found one reasonable answer suggesting that you should create a new document from your required template, then edit the Styles to suit, and then save as a new personal template. Well, I am not sure I like that answer because it means you must create a duplicate template for each one you use. So, I decided to see if I could find a better way…
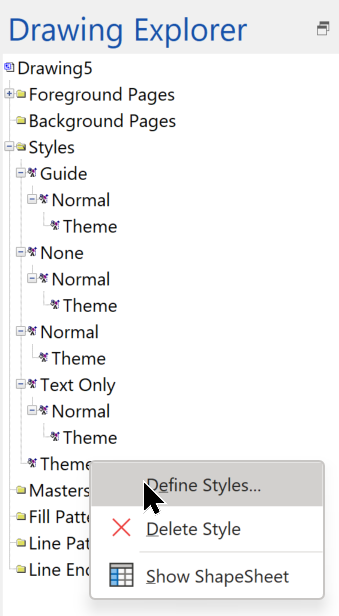
Firstly, it is important to know that these default settings are not editable for the whole Visio application, because they are stored in each document, under the Styles collection. You can view the Styles in a document using the Drawing Explorer window that can be opened from the Developer tab.