• Skip to main content
  • Skip to primary sidebar
  • Skip to footer

bVisual

  • Home
  • Services
    • How Visio smartness can help your business
    • Visio visual in Power BI
    • Visio Consulting Services
    • Visio Bureau Services
    • Visio Training and Support Services
  • Products
    • Visio Shape Report Converter
    • SS Plus
    • LayerManager
    • visViewer
    • Metro Icons
    • Rules Tools for Visio
    • The Visio 2010 Sessions App
    • Multi-Language Text for Visio
    • Document Imager for Visio
    • multiSelect for Visio
    • pdSelect for Visio
  • Case Studies
    • Case studies overview
    • Visualizing Construction Project Schedules
    • Visio Online Business Process Mapping
    • Nexans Visio Template
    • CNEE Projects, WorldCom
    • Chase Manhattan Bank
  • News
    • Recent news
    • News archive
  • Resources
    • Articles➡
      • ShapeSheet Functions A-Z
      • Comparing Visio for the Web and Desktop
      • Customising Visio Shapes for the Web App
      • Key differences between the Visio desktop and web apps
      • Using the Visio Data Visualizer in Excel
      • Using Visio in Teams
      • Creating Visio Tabs and Apps for Teams with SharePoint Framework (SPFx)
      • Designing Power Automate Flows with Microsoft Visio
      • Innovative uses of Visio Lists
    • Webcasts ➡
      • Visio in Organizations
      • My session and other Visio sessions at MSIgnite 2019
      • Power up your Visio diagrams
      • Vision up your Visio diagrams
      • The Visio 2010 MVP Sessions
    • Visio Web Learning Resources
    • Books➡
      • Mastering Data Visualization with Microsoft Visio
      • Microsoft Visio Business Process Diagramming and Validation
      • Visualizing Information with Microsoft Visio
  • Blog
    • Browse blog articles
    • Visio Power BI articles
    • Visio for Web articles
    • A history of messaging and encryption
  • About us
    • About bVisual
    • Testimonials
    • Bio of David Parker
    • Contact Us
    • Website Privacy Policy
    • Website terms and conditions
    • Ariba Network
You are here: Home / Solutions / TimeTable / TimeTable at RMConnect 2022

Published on May 17, 2022 by David Parker

TimeTable at RMConnect 2022

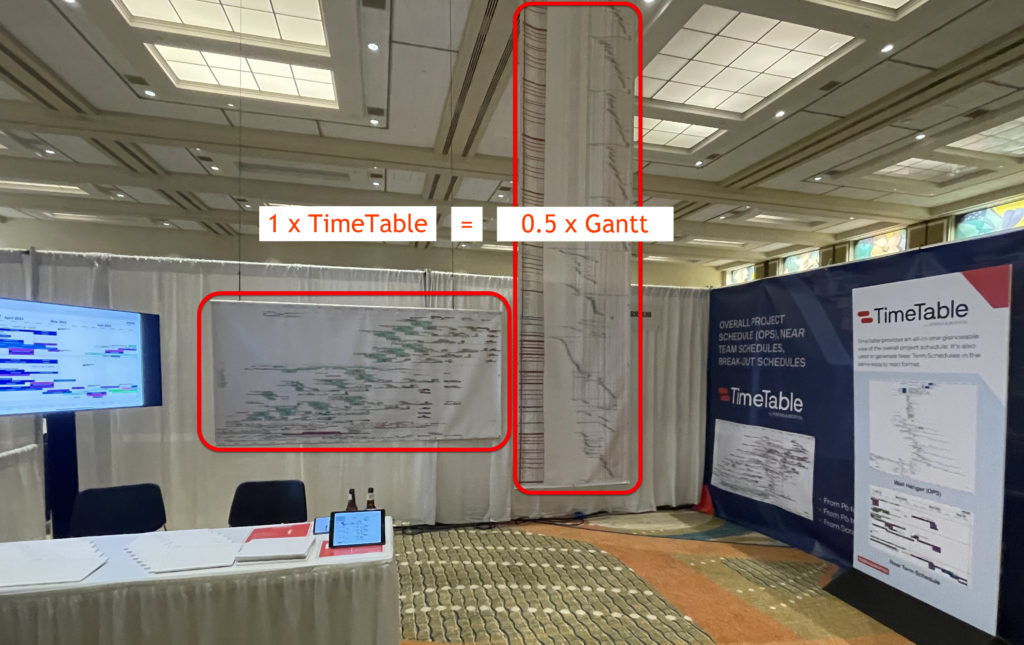
I was privileged to be invited to the biennial Robins & Morton conference in Orlando recently, where I assisted in presenting TimeTable to the hundreds of attendees there. A single wall-hanger (OPS) TimeTable Visio diagram automatically drawn from #OraclePrimaveraCloud data, is a condensed version of the same data printed as a Gantt chart some six times taller, as shown in the image below (there wasn’t enough ceiling height to print all the Gantt):

A TimeTable diagram has other advantages too …

  • Activities can be colour-coded in a variety of different ways
  • Activities can be re-labelled with alternative, user-friendly, terse activity names
  • Activity label colours automatically switch to be more contrasting and accessible
  • It can be annotated and manually manipulated without losing integrity
  • It can be viewed and searched on a laptop, tablet or phone
  • It can be grouped and split over multiple printed pages

As the stand poster proclaimed:

TimeTable provides an all-in-one glanceable view of the overall project schedule. It’s also used to generate Near Term Schedules in the same easy to read format.

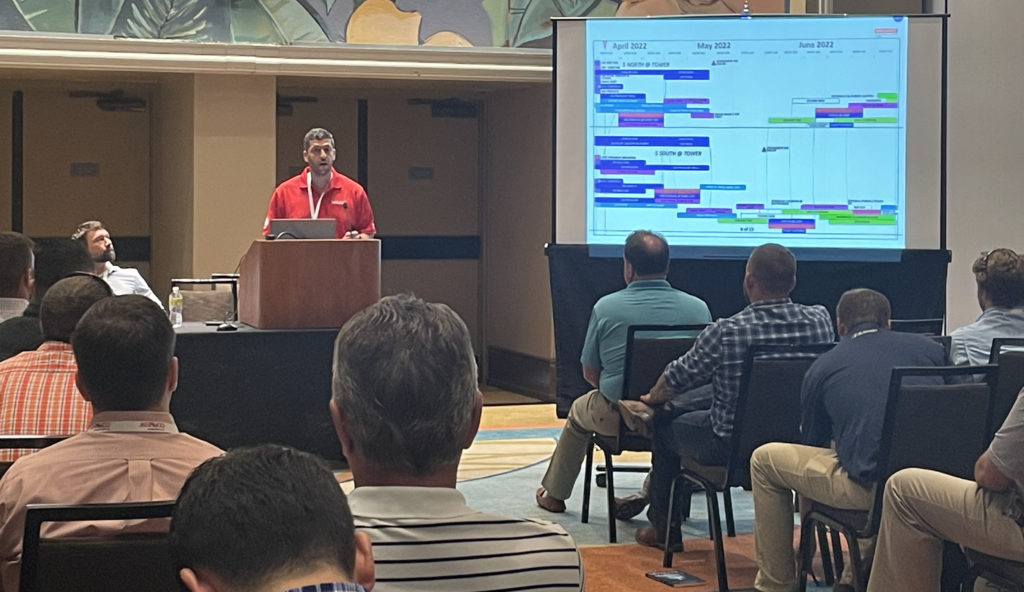
The lecture room was overfull to listen to the presentation of TimeTable because it presents construction schedules in a clear and intelligible manner.

Another notable presentation was the robotic dog that Robins & Morton use on site to monitor sites daily or to access dangerous and difficult terrain.

Robins & Morton believe in creating a family atmosphere and have a do what ever it takes attitude. I am lucky to have them as a client, and hope that they successfully schedule many fine buildings with TimeTable for years to come.

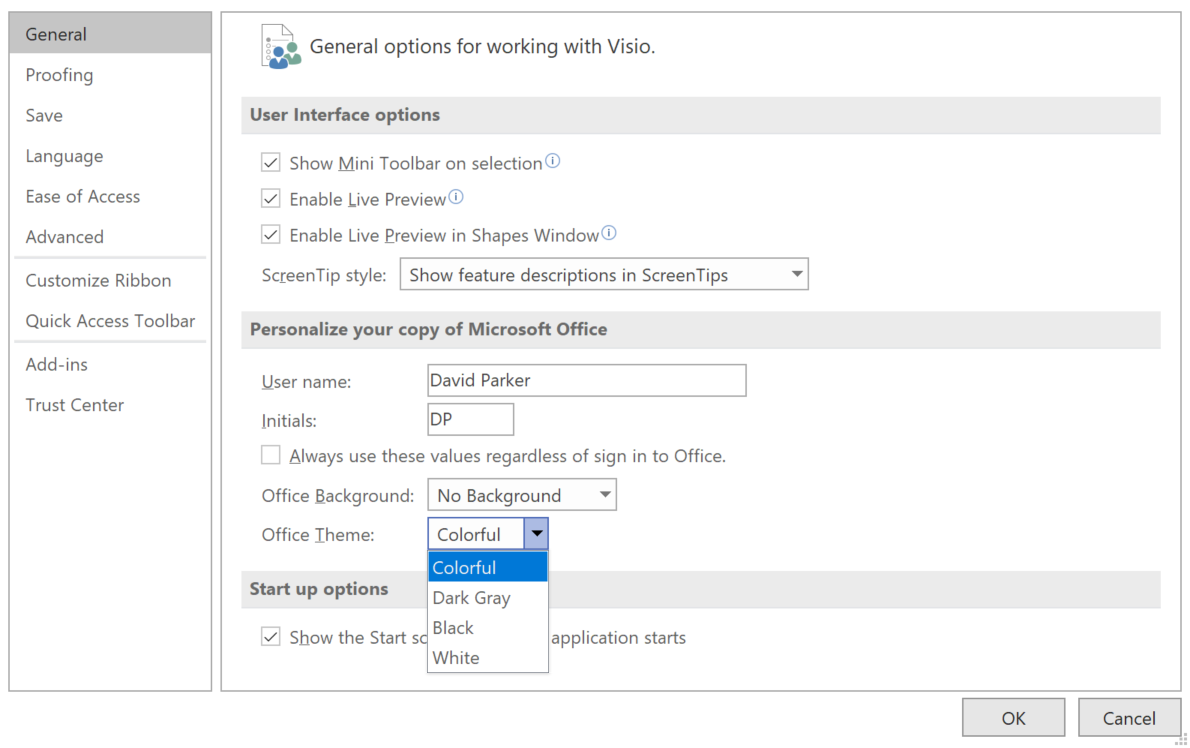
Getting the Microsoft Office Theme Value

I am working on a Visio VSTO project where I need to synchronise a UI element with the current session Microsoft Office Theme. At first, I thought that there would be some way of getting a value from the Visio object model, but I was wrong… The Office Theme can be selected from either the…

Week Nums in Timelines

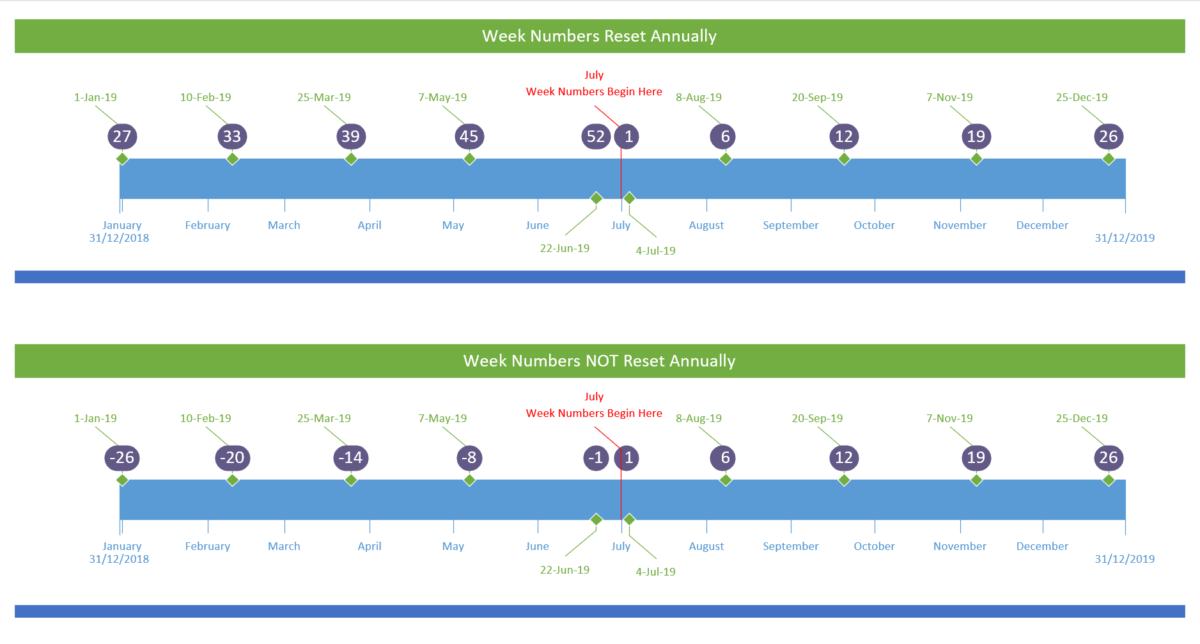
Writing a WeekNum(…) function for Visio

Learn how to write a WeekNum() function for Visio ShapeSheet, just like Excel’s!
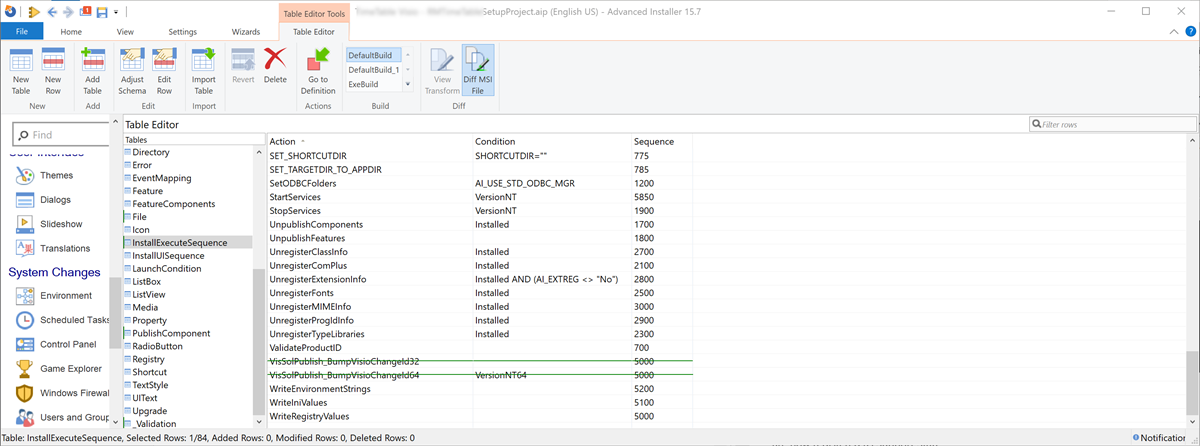
Using Advanced Installer with Viso VSTO Add-Ins

Read how I used Advanced Installer with my Visio VSTO add-in

The Ruler & Grid dialog

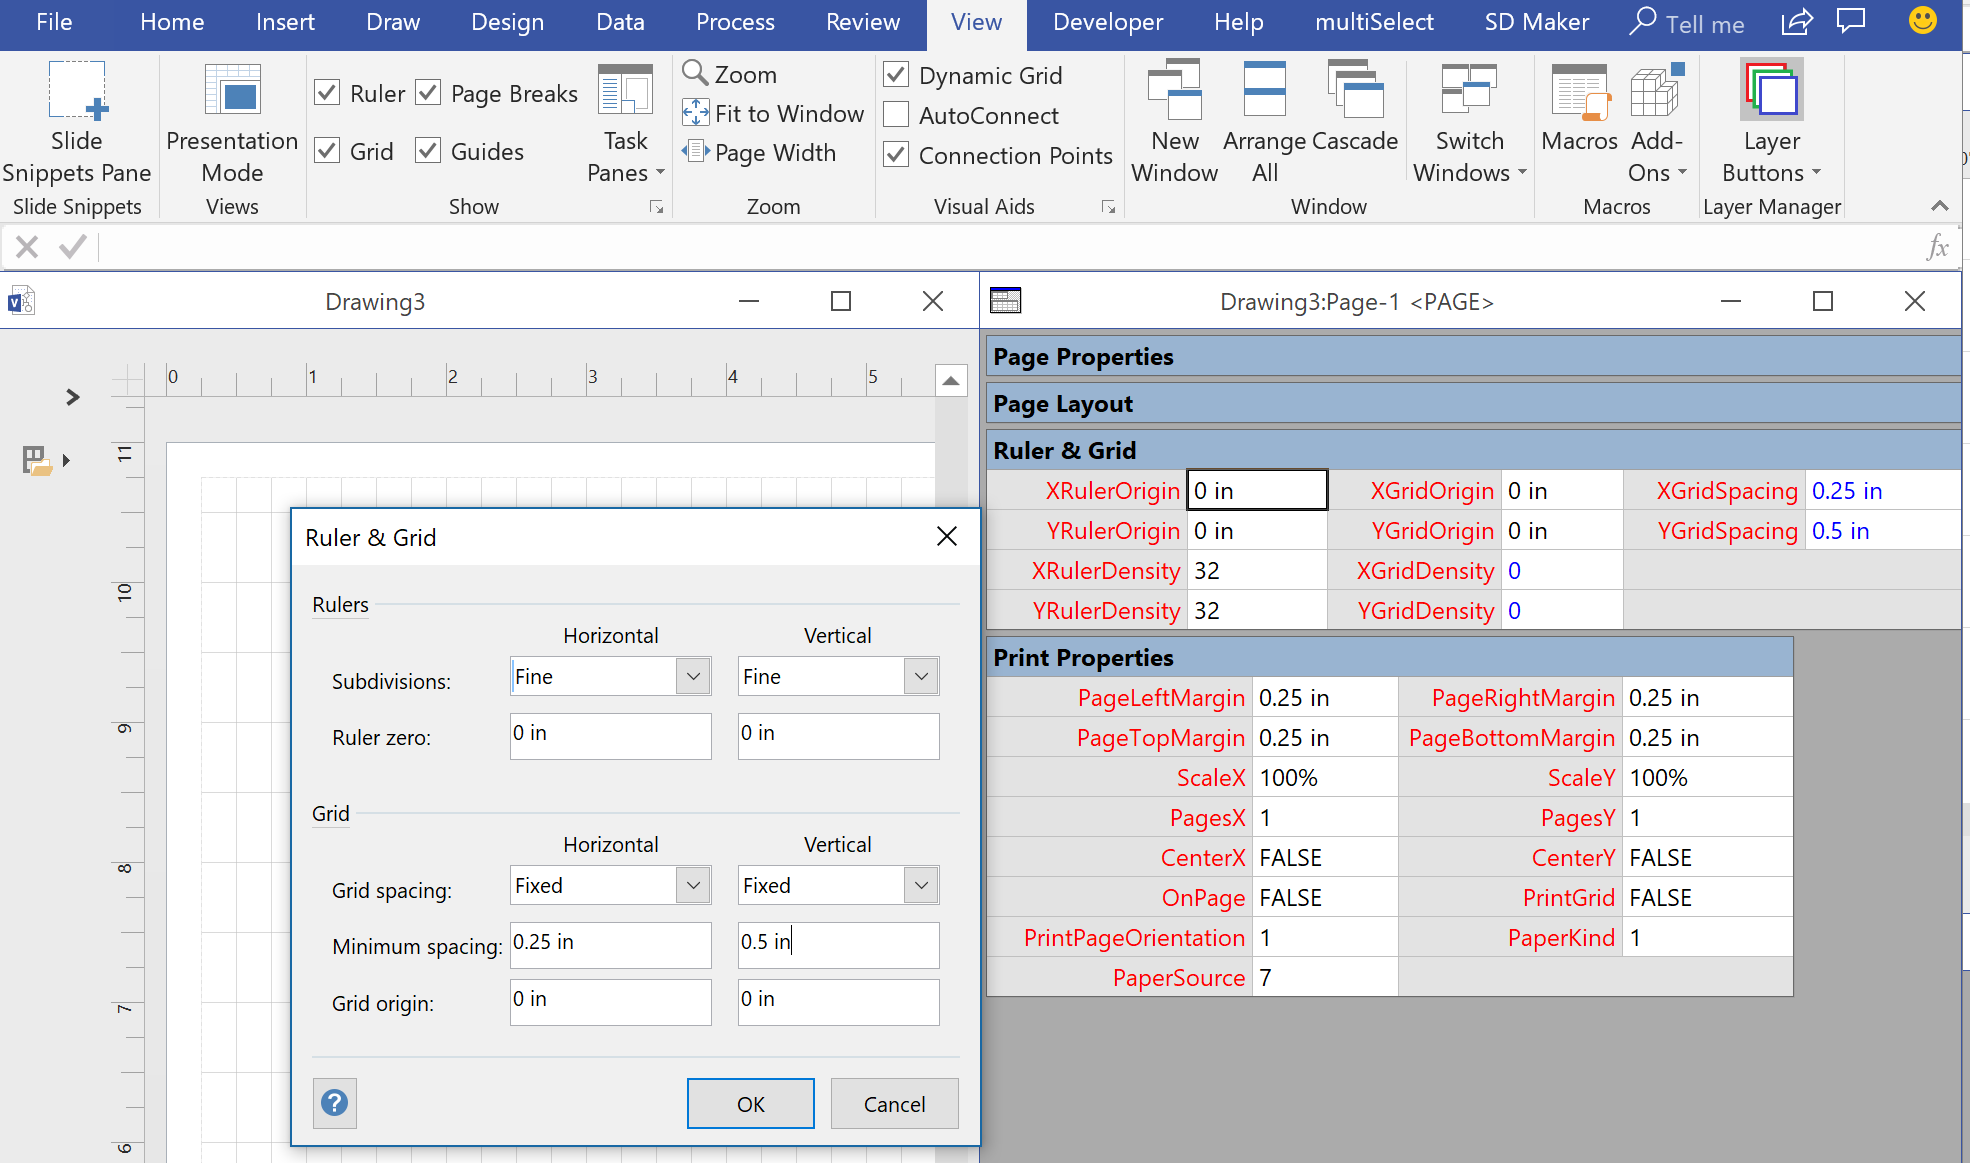
Really Snapping to Grids in Visio

Learn how to ensure that Visio shapes snap and size to fixed grids

EvalCell Shape

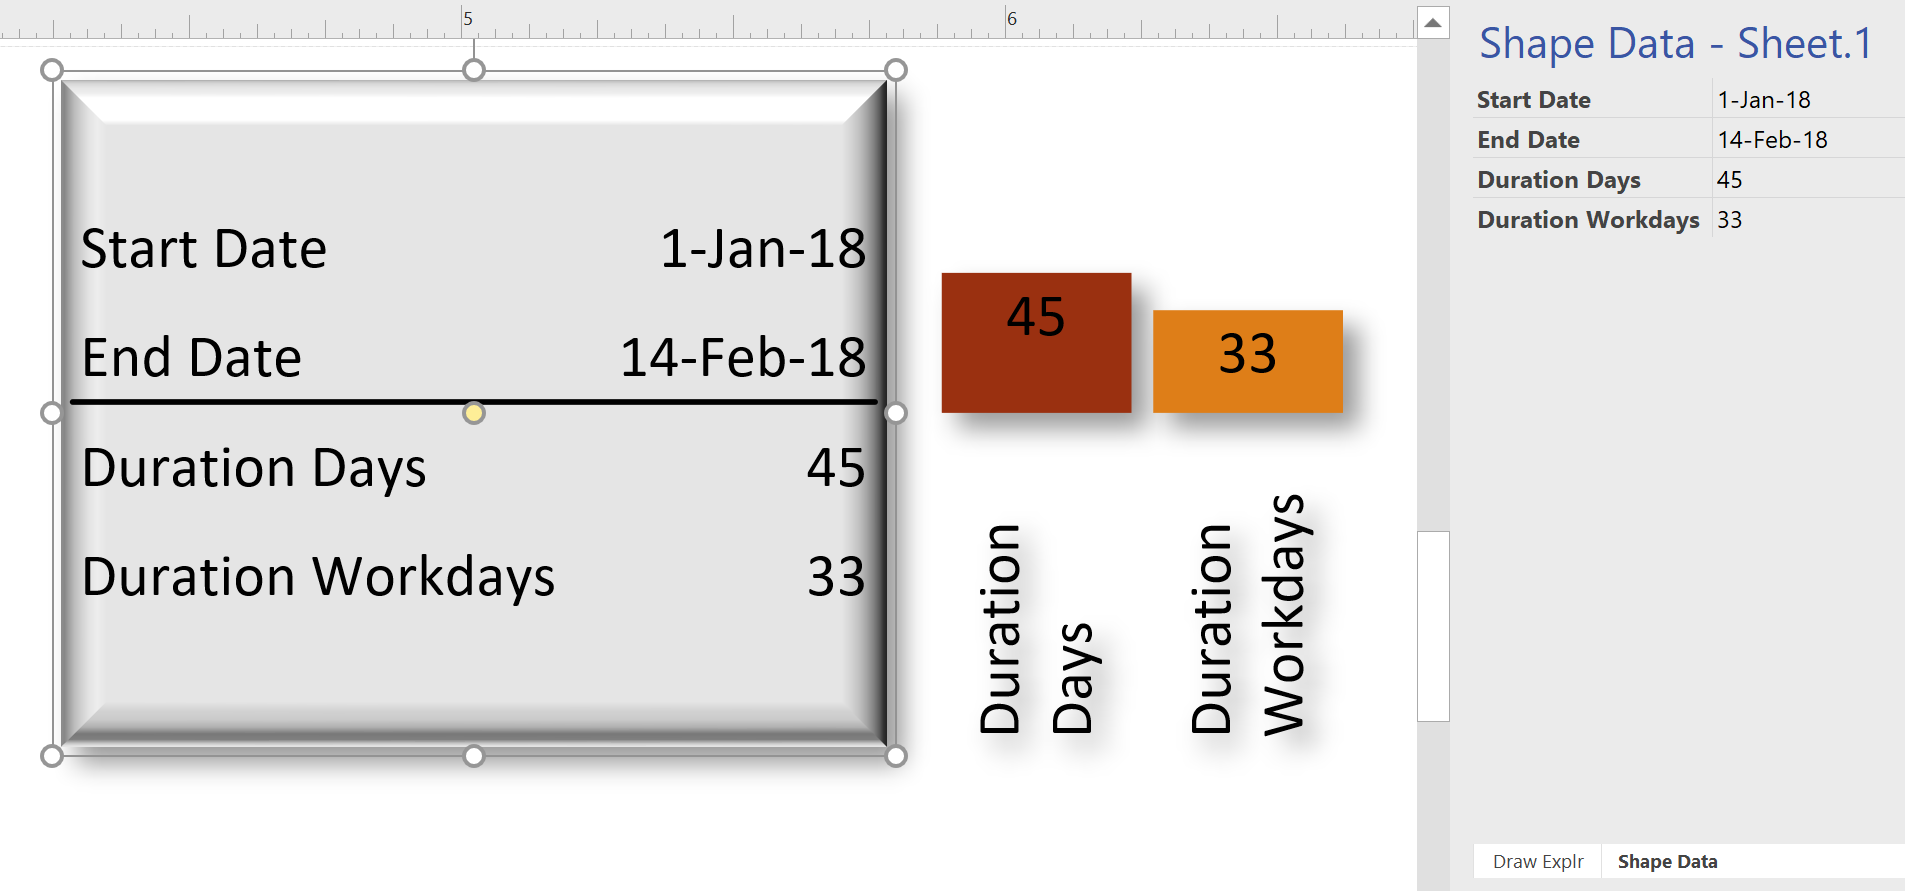
Using EVALCELL() in Visio to calculate Workdays

Using the EVALCELL() formula in Visio to return equivalent of NETWORKDAYS() in Excel

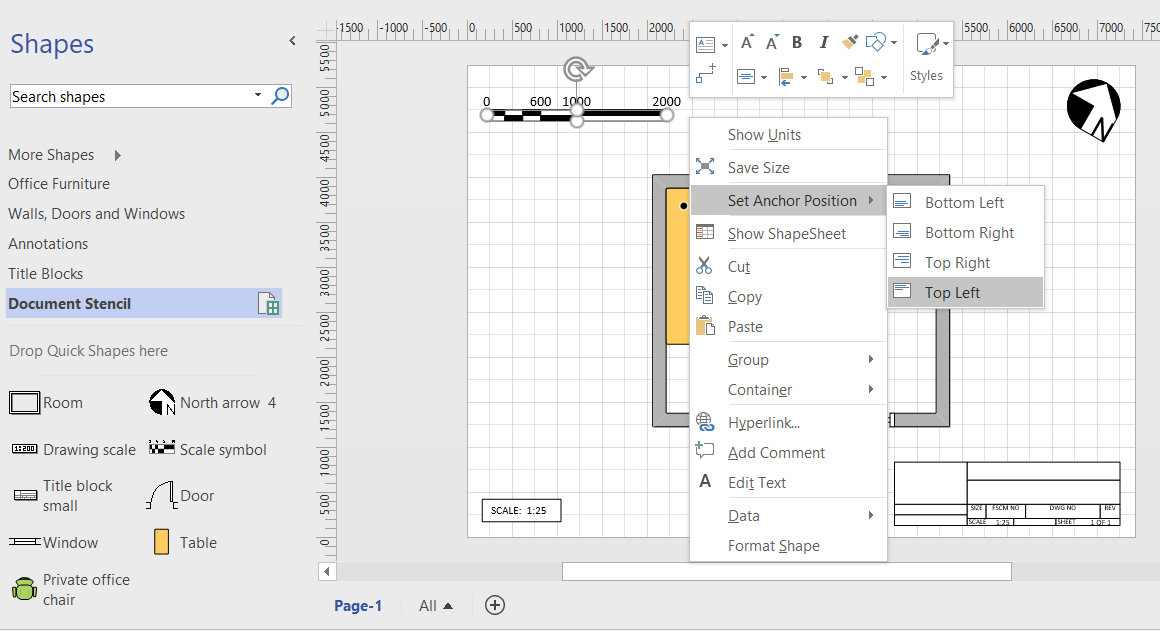
Anchoring scaled shapes to page corners in Visio

I have read that other users have bemoaned the lack of a anchor to top left, or something similar in Visio, so I thought I would demonstrate the issue, then propose a solution. In particular, there are some master shapes on the Annotations and Title Blocks stencils in the Visio Extras category that you would…

Related

Filed Under: Project, TimeTable, Visio for Desktop Tagged With: Gantt, Oracle P6, Timeline, Visio

About David Parker

David Parker has 25 years' experience of providing data visualization solutions to companies around the globe. He is a Microsoft MVP and Visio expert.

Reader Interactions

Leave a Reply Cancel reply

Your email address will not be published. Required fields are marked *

Primary Sidebar

  • LinkedIn
  • Twitter

Recent Posts

  • Update to LayerManager add-in for non-English users
  • Pushing Data Visualizer in Visio beyond its limits
  • Pushing Data Visualizer in Visio to the limits!
  • Teams Tuesday Podcast Recording about Visio
  • Linking Data to Visio Shapes in Code

Categories

Tags

Accessibility Add-Ins Connectors Containers Data Export Data Graphics Data Import Data Visualizer Educational Excel GraphDatabase Hyperlinks Icon Sets JavaScript Layers Legend Link Data to Shapes Lists MSIgnite MVP Office365 Org Chart PowerApps PowerBI PowerQuery Processes Shape Data Shape Design ShapeSheet ShapeSheet Functions SharePoint 2013 SQL Teams Themes Validation VBA Video Visio Visio 2007 Visio 2013 Visio for the Web Visio Online Visio Services Visio Viewer Webinar

Footer

bVisual Profile

The UK-based independent Visio consultancy with a worldwide reach. We have over 25 years experience of providing data visualization solutions to companies around the globe.

Learn more about bVisual

  • LinkedIn
  • Twitter

Search this website

Recent posts

  • Update to LayerManager add-in for non-English users
  • Pushing Data Visualizer in Visio beyond its limits
  • Pushing Data Visualizer in Visio to the limits!
  • Teams Tuesday Podcast Recording about Visio
  • Linking Data to Visio Shapes in Code

Copyright © 2023 · Executive Pro on Genesis Framework · WordPress · Log in