• Skip to main content
  • Skip to primary sidebar
  • Skip to footer

bVisual

  • Home
  • Services
    • How Visio smartness can help your business
    • Visio visual in Power BI
    • Visio Consulting Services
    • Visio Bureau Services
    • Visio Training and Support Services
  • Products
    • Visio Shape Report Converter
    • SS Plus
    • LayerManager
    • visViewer
    • Metro Icons
    • Rules Tools for Visio
    • The Visio 2010 Sessions App
    • Multi-Language Text for Visio
    • Document Imager for Visio
    • multiSelect for Visio
    • pdSelect for Visio
  • Case Studies
    • Case studies overview
    • Visualizing Construction Project Schedules
    • Visio Online Business Process Mapping
    • Nexans Visio Template
    • CNEE Projects, WorldCom
    • Chase Manhattan Bank
  • News
    • Recent news
    • News archive
  • Resources
    • Articles➡
      • ShapeSheet Functions A-Z
      • Comparing Visio for the Web and Desktop
      • Customising Visio Shapes for the Web App
      • Key differences between the Visio desktop and web apps
      • Using the Visio Data Visualizer in Excel
      • Using Visio in Teams
      • Creating Visio Tabs and Apps for Teams with SharePoint Framework (SPFx)
      • Designing Power Automate Flows with Microsoft Visio
      • Innovative uses of Visio Lists
    • Webcasts ➡
      • Visio in Organizations
      • My session and other Visio sessions at MSIgnite 2019
      • Power up your Visio diagrams
      • Vision up your Visio diagrams
      • The Visio 2010 MVP Sessions
    • Visio Web Learning Resources
    • Books➡
      • Mastering Data Visualization with Microsoft Visio
      • Microsoft Visio Business Process Diagramming and Validation
      • Visualizing Information with Microsoft Visio
  • Blog
    • Browse blog articles
    • Visio Power BI articles
    • Visio for Web articles
    • A history of messaging and encryption
  • About us
    • About bVisual
    • Testimonials
    • Bio of David Parker
    • Contact Us
    • Website Privacy Policy
    • Website terms and conditions
    • Ariba Network
You are here: Home / Shape Design / ShapeSheet Formulas / Taking Visio Actions Rows to the limit

Published on June 13, 2022 by David Parker

Taking Visio Actions Rows to the limit

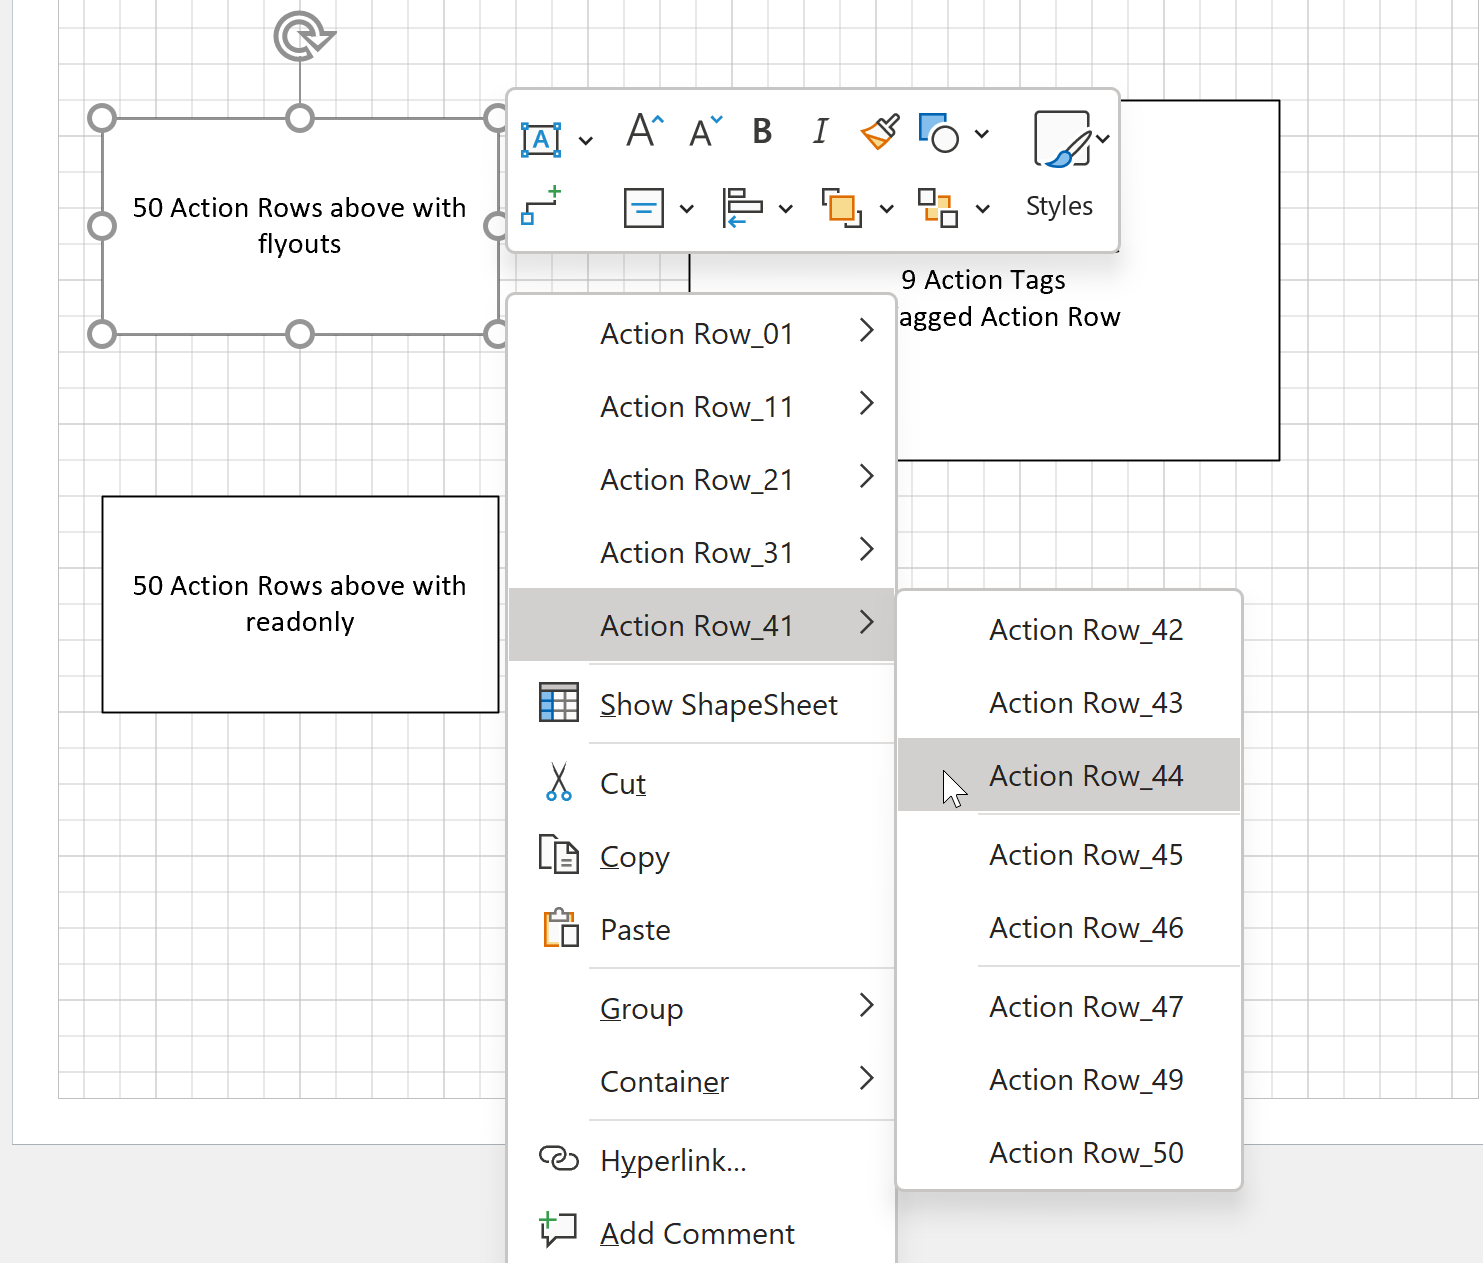
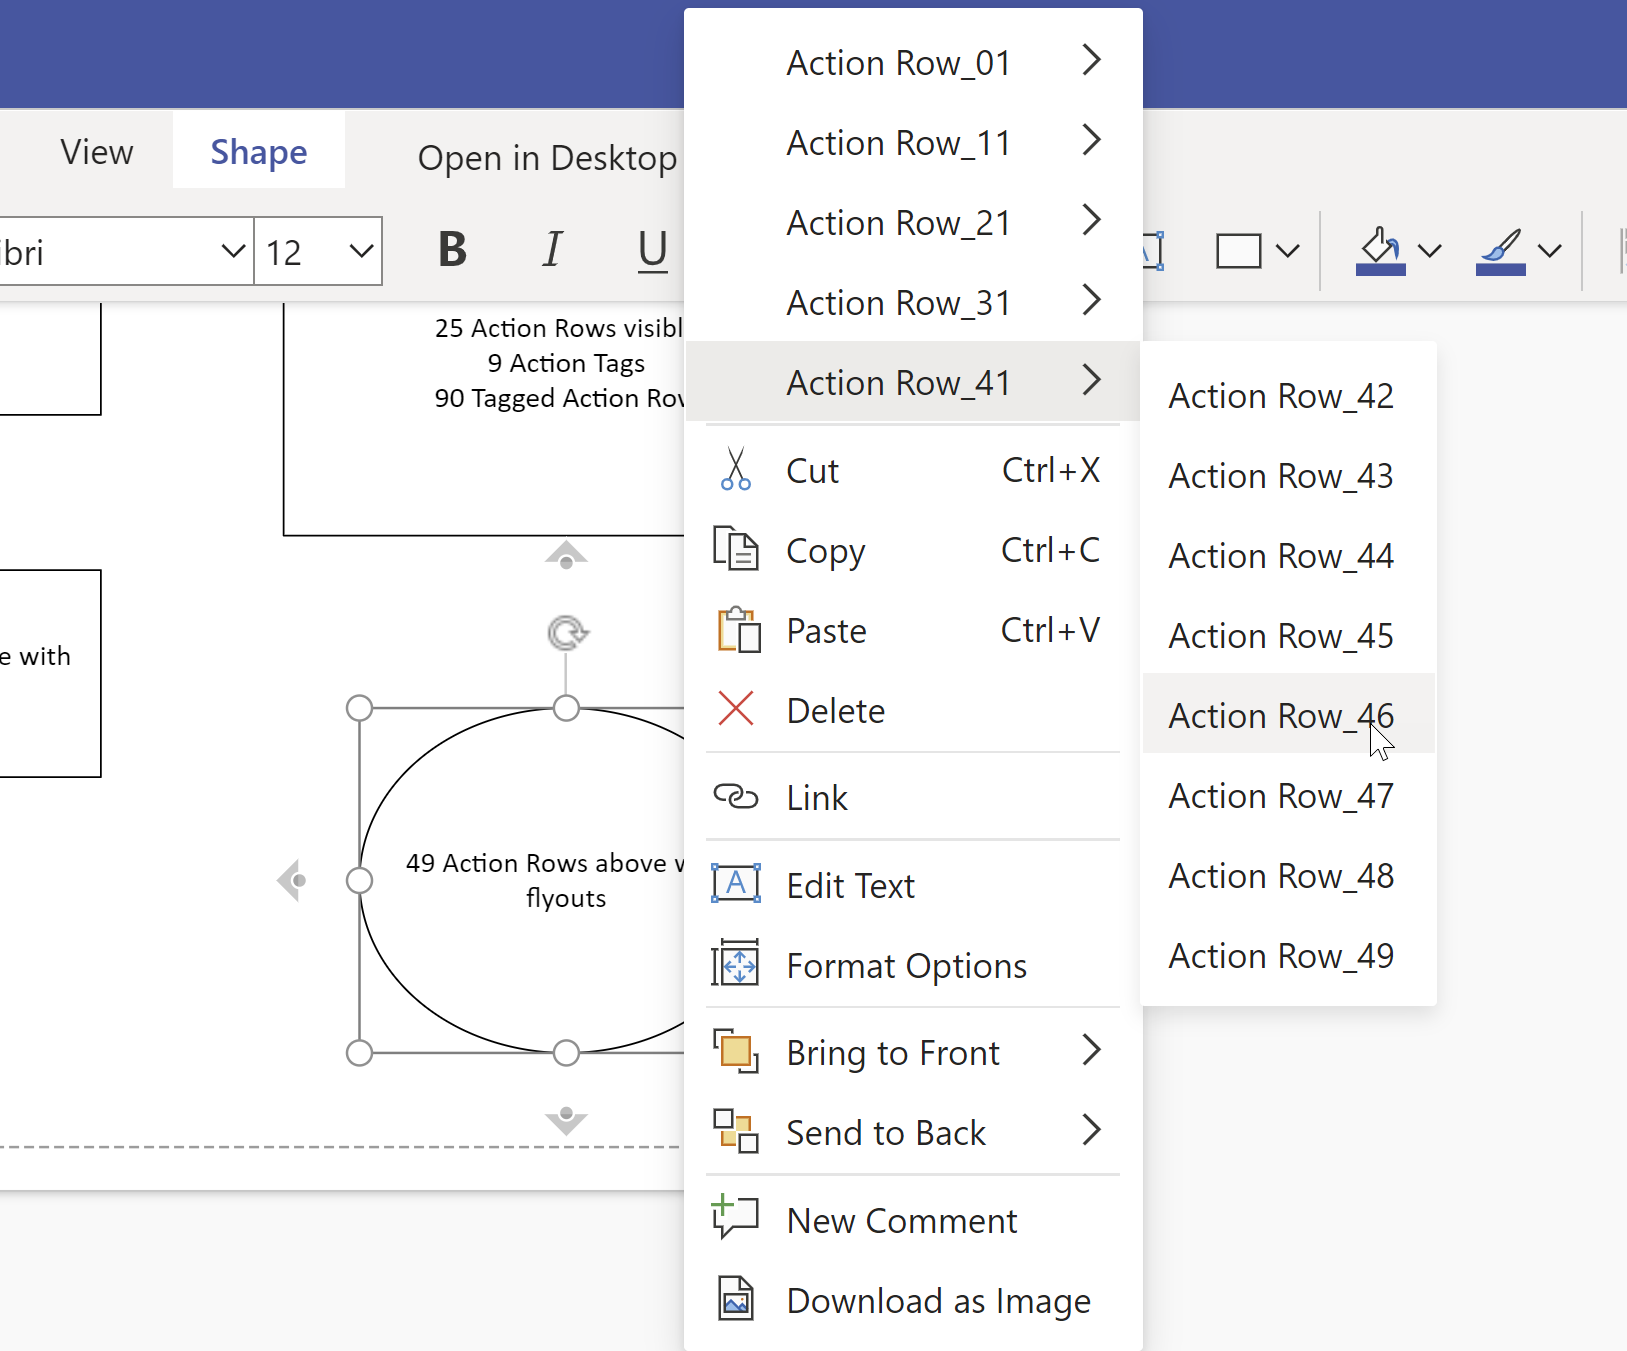
I recently (re-)discovered that there is a limit to the number of Actions section rows that will be evaluated for display on the right mouse menu of a Visio shape. I have not hit a limit (yet) for the number of rows that can be added to the Actions section … so why is there a limitation to the number that will be displayed on the right mouse menu? In Visio for desktop, any rows over this limit will simply not be displayed, but in Visio for web it prevents any Actions from being displayed at all on the shape.

  • Visio for desktop evaluates the first 50 Actions
  • Visio for web can only display 49 Actions

Well, this limit is 50 in the desktop, and 49 in the web … which you may think is too many anyway, but the Visio ShapeSheet provides the ability to each row above or below the built-in menu, be invisible, be disabled, be read-only, and to group them in sub-menus or with spacers, so, given that a single Visio smart shape can incorporate many different options within it, then this limit can be reached unknowingly when creating custom Visio masters.

I often use the right-mouse menu to provide a quick way of changing Shape Data values that are available in a fixed-list. There can be many fixed-lists in a single shape, so there could be many synchronized Actions providing configuration options. Even the Microsoft provided BPMN shapes have 28 Actions rows currently, and I think I remember that there were more in earlier versions of Visio.

So, if your custom master shapes will be used in Visio for web, then you must never have more than 49 rows in the Actions section. It is acceptable to delete rows to keep to this maximum number.

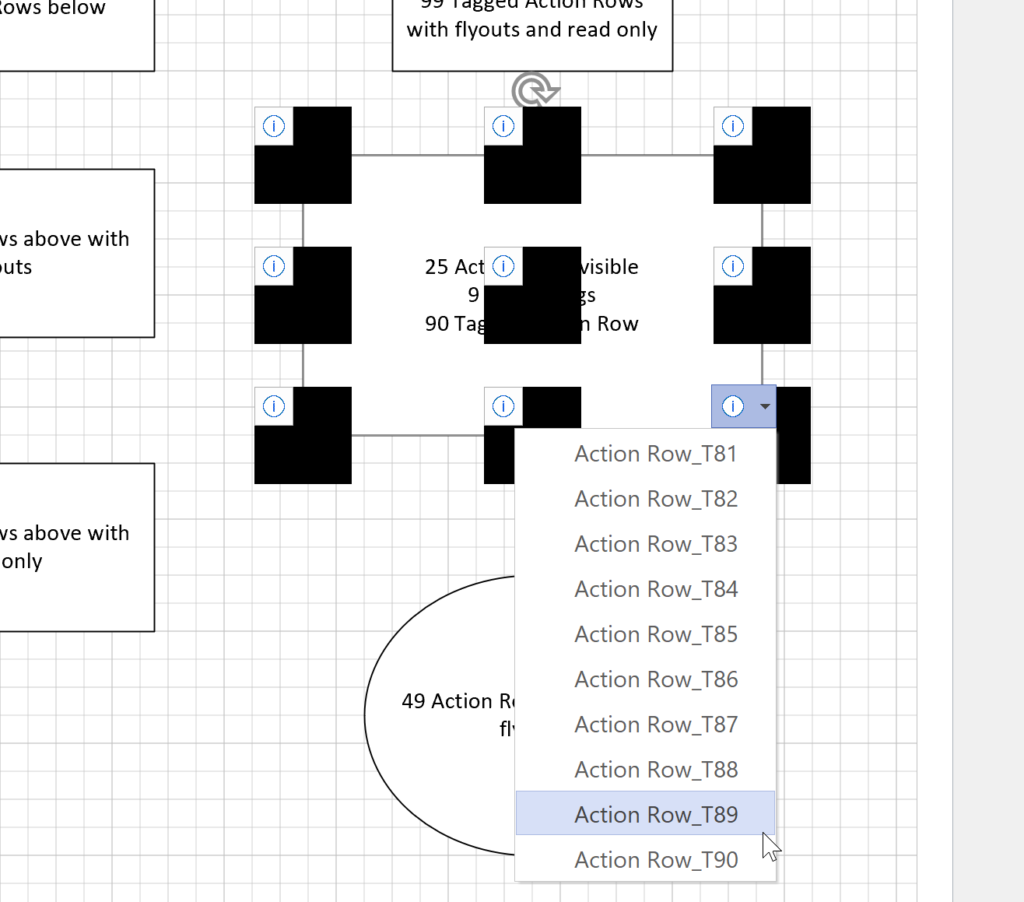
If your custom master shapes will be used in Visio for desktop, then only the first 50 rows will ever be evaluated for display. You can have more than 50 rows in the Actions section but only use rows above 50 for use as menu rows for Action Tags. There appears to be no limit to the number of Actions rows that can be displayed under Action Tags which can be displayed in a many positions around a shape. However, these are a Visio for desktop only feature, and their display can be ugly on some graphics cards…
Pushing Data Visualizer in Visio beyond its limits

My last post was about some of the lessons learnt when trying to push Data Visualizer to its limits, but this one has some ways of overcoming these limitations. The main lesson learnt is that DV binds the shapes within the DV container shape, CFF Data Visualizer, and controls some of the ShapeSheet cells that…

Pushing Data Visualizer in Visio to the limits!

Regular readers of my blog will know that I like to use the Data Visualizer (DV) in Visio Plan 2, but I recently tried to help a user who really decided to push it to the limits. In this scenario, there were multiple connections, but with different labels, being created between the same flowchart shapes,…

Setting Theme defaults in Visio

I was recently asked how to change the default font size and line weight in Visio, and then saw then many others are asking the same sort of question. I found one reasonable answer suggesting that you should create a new document from your required template, then edit the Styles to suit, and then save…

A Multi-Time Zone Clock for Visio

I wrote a post about making a clock face in Visio fifteen years ago, but a reader recently asked about displaying multiple time zones. Well, I have previously written about time zones in Visio, so I accepted the challenge to improve upon my earlier work. (more…)

Update any Visio ShapeSheet cell with External Data

When Microsoft introduced a new way of linking external data to Visio shapes in 2007, I initially bemoaned the inability to update anything but Shape Data row values, unlike the old database add-on that I had been using for 10 years. The new method, though, has many advantages over the old way, not least that…

Referencing Container Data in Visio

Microsoft Visio has a useful Structured Diagramming concept that consists of Containers, Callouts and Connectors. The first of these features make it possible for shapes to know what they are contained within, as a better option to grouping shapes together. Grouping can hide or break the grouped shapes smartness, so Visio provides two ways of…

Related

Filed Under: Actions, Shape Design, ShapeSheet Formulas, Visio, Visio for Desktop, Visio for Web Tagged With: ShapeSheet Functions, Visio

About David Parker

David Parker has 25 years' experience of providing data visualization solutions to companies around the globe. He is a Microsoft MVP and Visio expert.

Reader Interactions

Leave a Reply Cancel reply

Your email address will not be published. Required fields are marked *

Primary Sidebar

  • LinkedIn
  • Twitter

Recent Posts

  • Update to LayerManager add-in for non-English users
  • Pushing Data Visualizer in Visio beyond its limits
  • Pushing Data Visualizer in Visio to the limits!
  • Teams Tuesday Podcast Recording about Visio
  • Linking Data to Visio Shapes in Code

Categories

Tags

Accessibility Add-Ins Connectors Containers Data Export Data Graphics Data Import Data Visualizer Educational Excel GraphDatabase Hyperlinks Icon Sets JavaScript Layers Legend Link Data to Shapes Lists MSIgnite MVP Office365 Org Chart PowerApps PowerBI PowerQuery Processes Shape Data Shape Design ShapeSheet ShapeSheet Functions SharePoint 2013 SQL Teams Themes Validation VBA Video Visio Visio 2007 Visio 2013 Visio for the Web Visio Online Visio Services Visio Viewer Webinar

Footer

bVisual Profile

The UK-based independent Visio consultancy with a worldwide reach. We have over 25 years experience of providing data visualization solutions to companies around the globe.

Learn more about bVisual

  • LinkedIn
  • Twitter

Search this website

Recent posts

  • Update to LayerManager add-in for non-English users
  • Pushing Data Visualizer in Visio beyond its limits
  • Pushing Data Visualizer in Visio to the limits!
  • Teams Tuesday Podcast Recording about Visio
  • Linking Data to Visio Shapes in Code

Copyright © 2023 · Executive Pro on Genesis Framework · WordPress · Log in