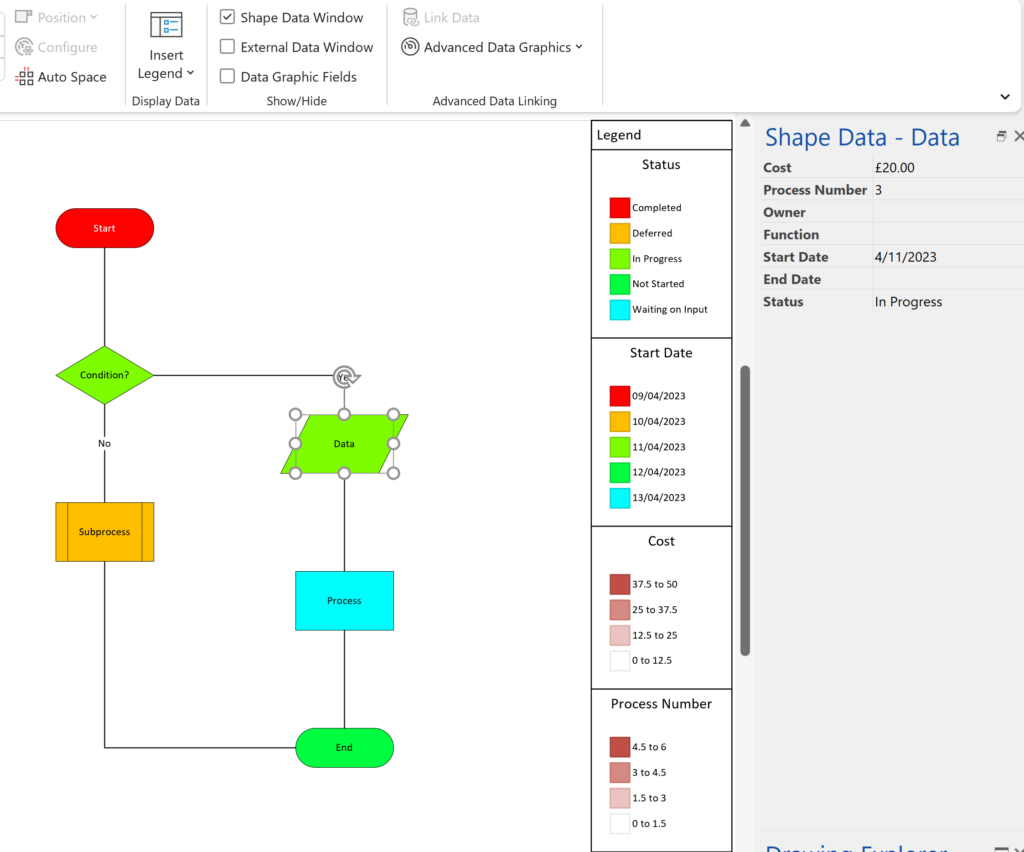
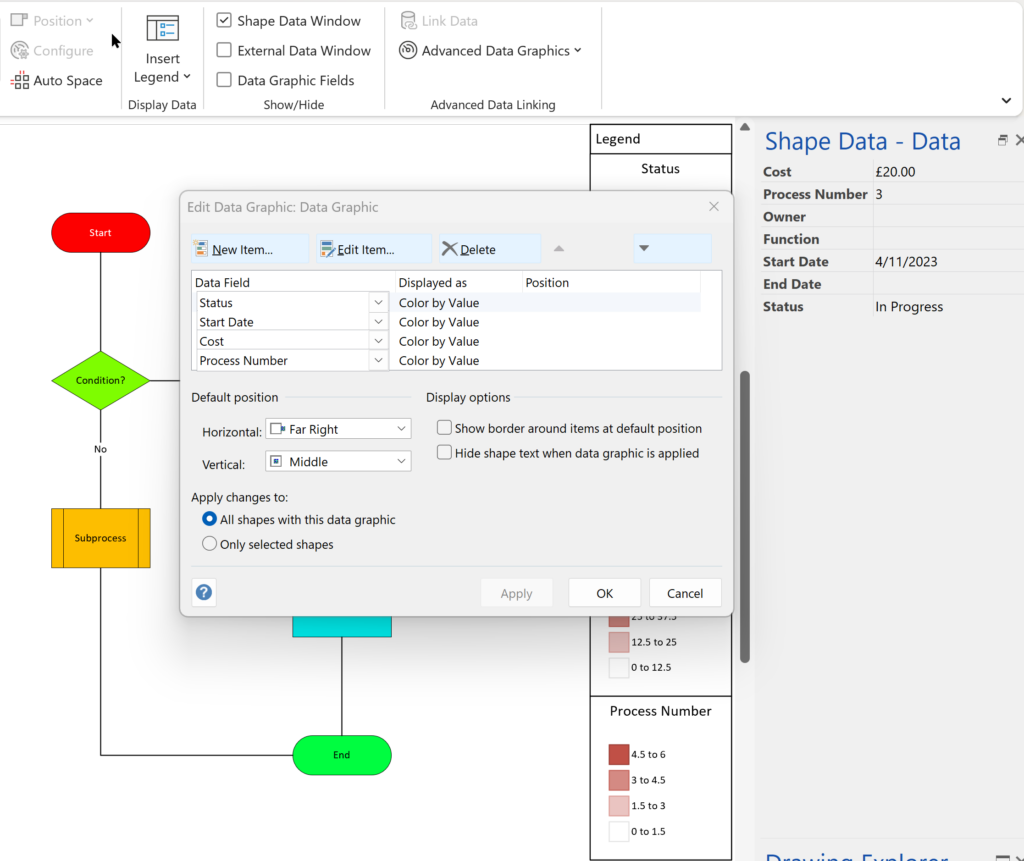
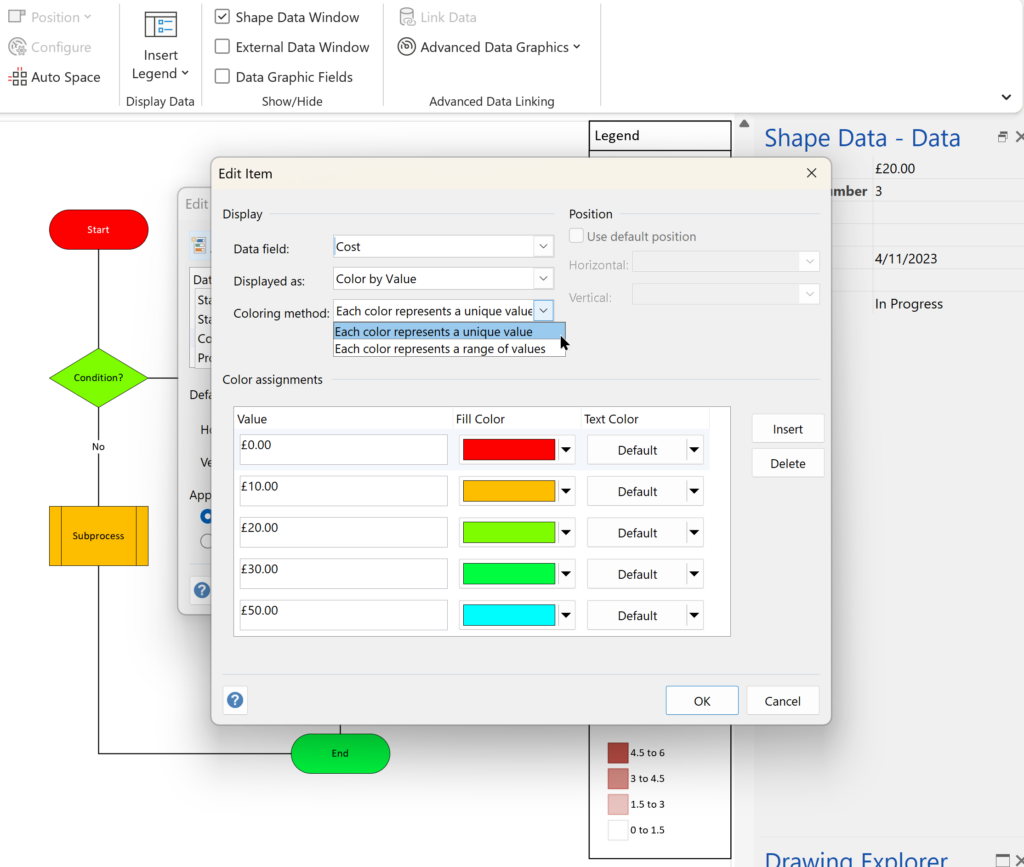
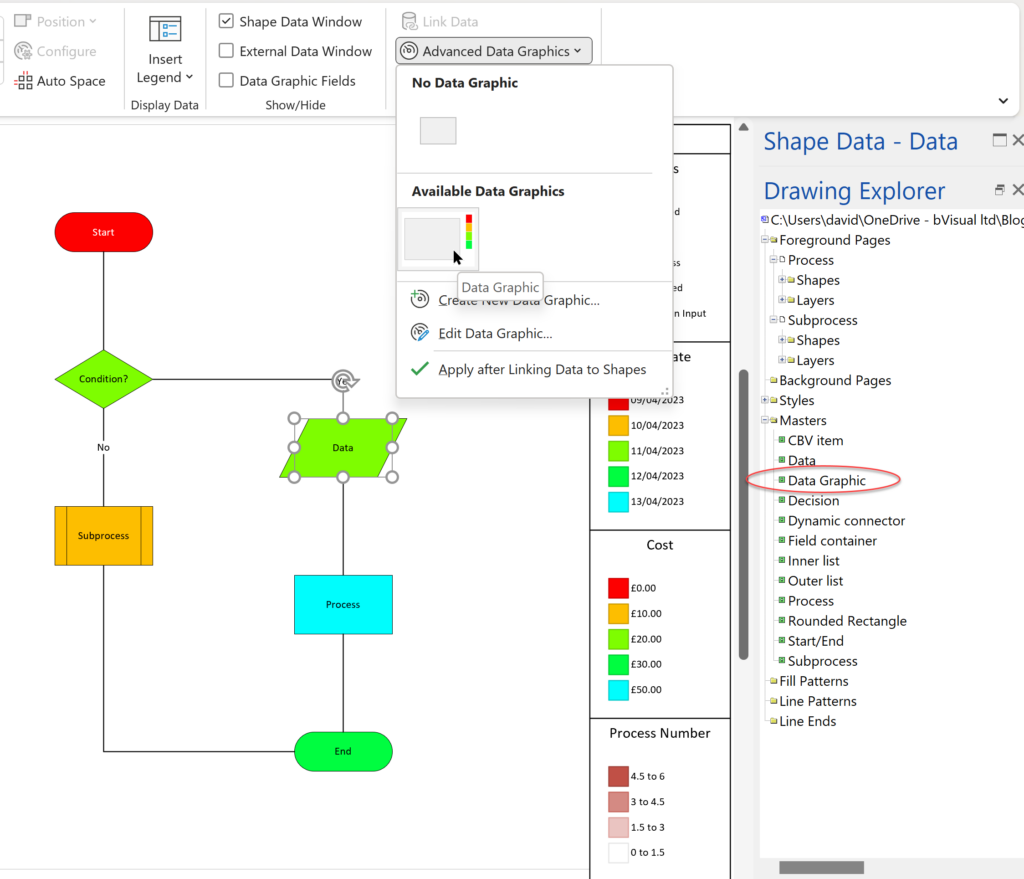
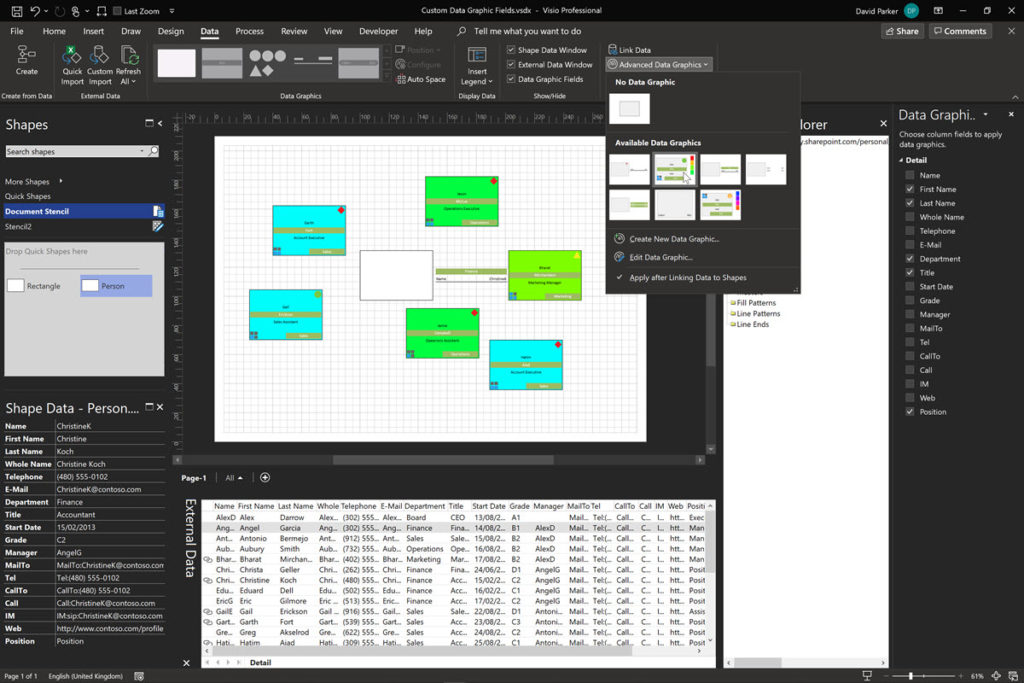
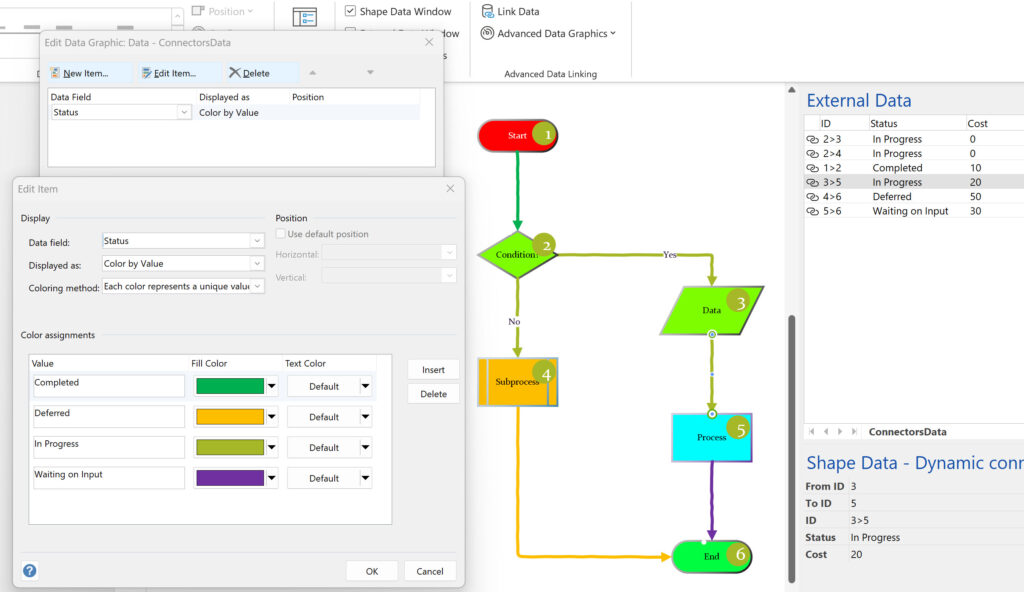
Data Graphics in Visio Plan 2 and Visio Professional is great, but it only enables us to use them with 2D shapes in Visio, i.e. not on connectors. So, what if you want to change the line colour of the connectors between the 2D shapes because of the data flowing between them? Well, it is possible … with a little preparation!
[Read more…] about Using Visio Color by Value on ConnectorsData Graphics
Understanding Visio Data Graphic’s Color by Value
The desktop Visio editions, Visio Professional and Visio Plan 2, have a great way of automatically displaying data as Data Bars, Icon Sets, Text Callouts and Color by Value. The first three types of Data Graphics require sub-shapes to be inserted into each shape that they are applied to, but the last one, Color by Value (CBV), merely requires some User-defined Cells and formulas. However, unlike the first three, there can be only one Shape Data value displayed as colours in each Data Graphic (DG). So, how can we easily update the colour assigned to each value using code, rather than manually using the manual dialogs provided?
[Read more…] about Understanding Visio Data Graphic’s Color by ValueKeeping Visio Data Graphic Items Level
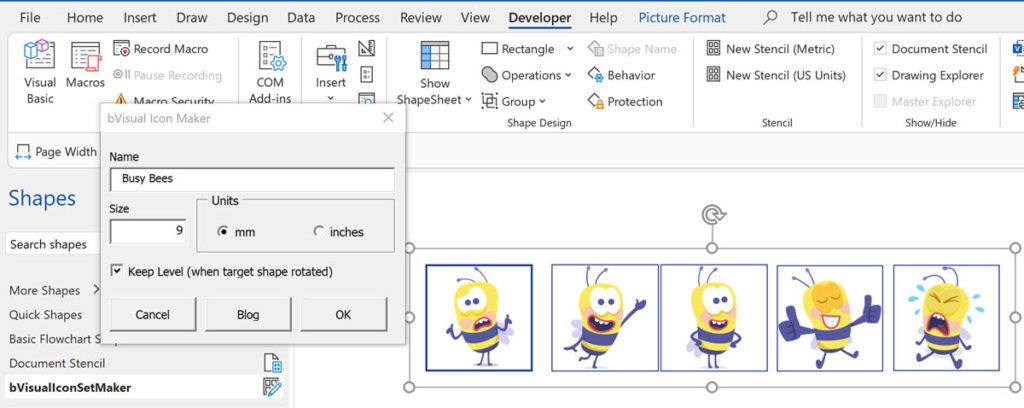
My good friend Scott Helmers, Visio author and trainer, of Harvard Computing Group , recently asked for some help in keeping data graphic items level when their target shape is rotated. Fortunately, I was able to assist, so I thought I would explain how this can be done, and also update my Icon Maker macro from a few years ago. The updated macro is available to download for free and includes the extra ability of sizing the icons. I chose to use some bee stickers from the Insert / Illustrations / Icons tool in Visio Plan 2, and the Status options from the Process shape in the Basic Flowchart Shapes stencil to demonstrate.
[Read more…] about Keeping Visio Data Graphic Items LevelDuplicating Visio Data Graphics
I was recently asked about switching between different Visio Data Graphics within a page, so I thought I should record a few short videos to explain how Visio Data Graphics work, how they can be edited and duplicated, and how to automate switching between them.
[Read more…] about Duplicating Visio Data GraphicsDisplaying Visio Number Shapes data clearly
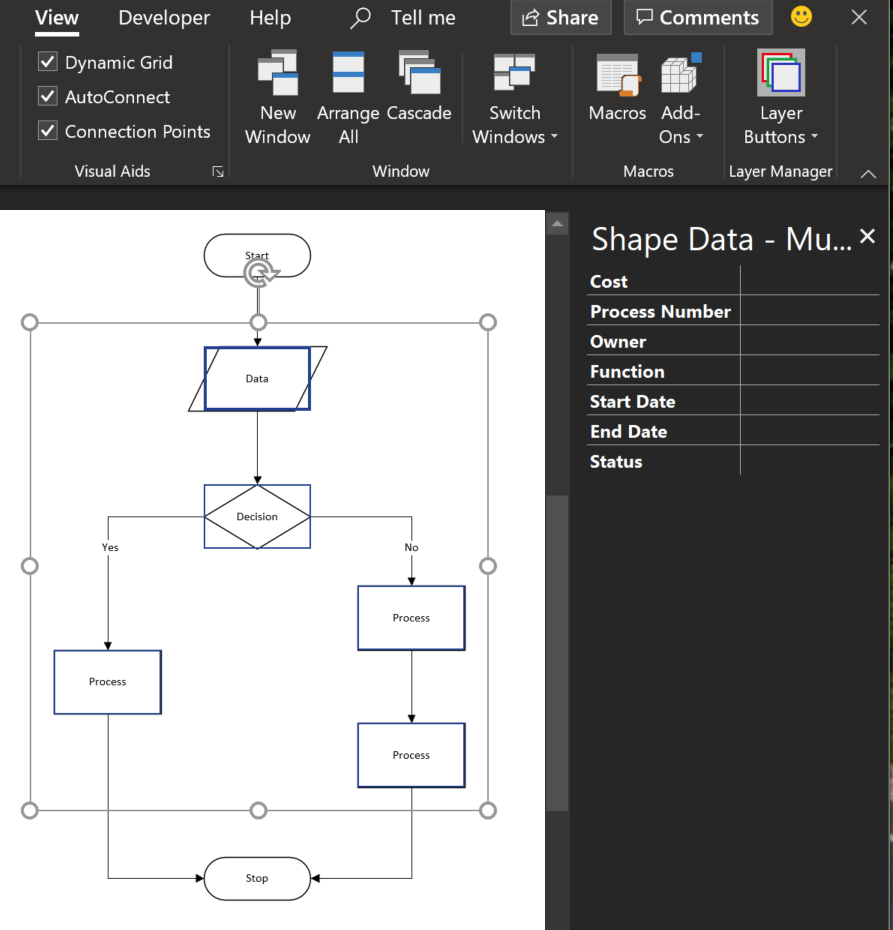
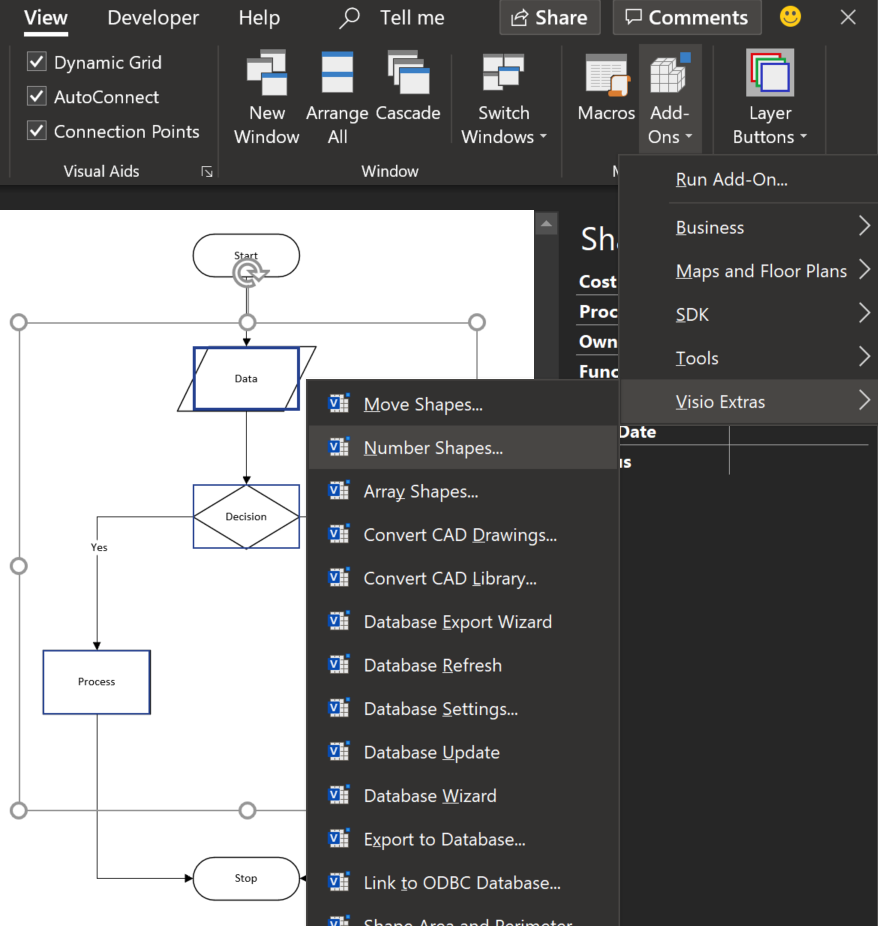
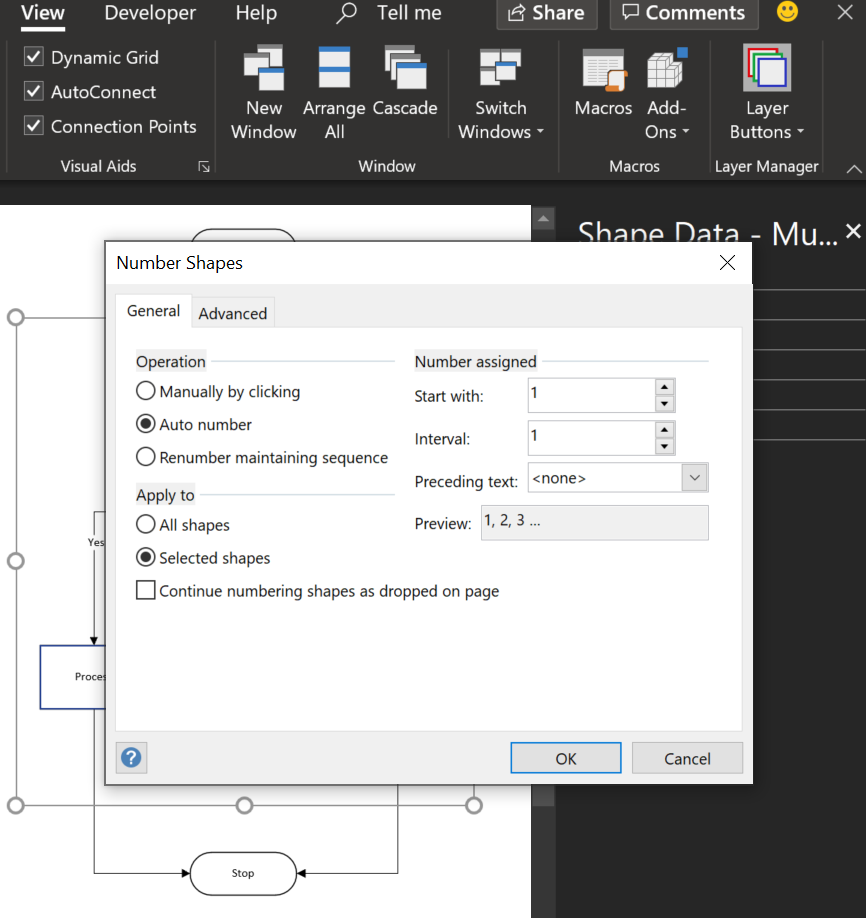
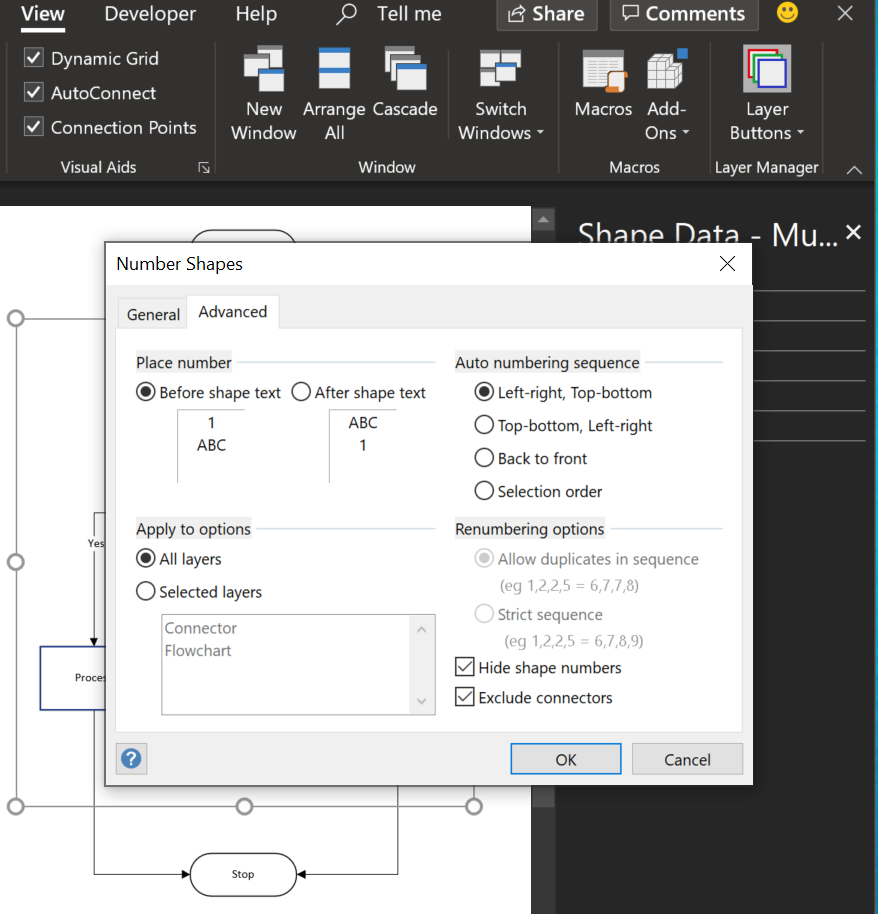
Visio has had a Number Shapes add-on for many years, even since before Microsoft bought the application in 2000. The add-on autmatically creates three Shape Data rows to hold the number, any prefix text, and a value to indicate whether the shape number text should be shown. It is useful, but it can also be very annoying if you also want to label your shapes, such as with process flow shapes, or you want the shape number to be displayed outside of the main shape. Fortunately, there is a solution….
Updates to MSIgnite Visio Session Documents
I will be leaving soon for Atlanta to the MS Ignite Conference, but first I checked the latest schedule and found some additions and some slight title changes, so I have updated the documents provided in my last two posts:
MS Ignite Conference 2016 Sessions in Visio
Visio Sessions at MS Ignite Conference 2016
Also, I have produced a short, silent video of the process to import your own Ignite Trip Report.docx from the MS Ignite website to Visio.
See you in Atlanta!