• Skip to main content
  • Skip to primary sidebar
  • Skip to footer

bVisual

  • Home
  • Services
    • How Visio smartness can help your business
    • Visio visual in Power BI
    • Visio Consulting Services
    • Visio Bureau Services
    • Visio Training and Support Services
  • Products
    • Visio Shape Report Converter
    • SS Plus
    • LayerManager
    • visViewer
    • Metro Icons
    • Rules Tools for Visio
    • The Visio 2010 Sessions App
    • Multi-Language Text for Visio
    • Document Imager for Visio
    • multiSelect for Visio
    • pdSelect for Visio
  • Case Studies
    • Case studies overview
    • Using Visio in Education for GIS
    • Visualizing Construction Project Schedules
    • Visio Online Business Process Mapping
    • Nexans Visio Template
    • CNEE Projects, WorldCom
    • Chase Manhattan Bank
  • News
    • Recent news
    • News archive
  • Resources
    • Articles➡
      • ShapeSheet Functions A-Z
      • Comparing Visio for the Web and Desktop
      • Customising Visio Shapes for the Web App
      • Key differences between the Visio desktop and web apps
      • Using the Visio Data Visualizer in Excel
      • Using Visio in Teams
      • Creating Visio Tabs and Apps for Teams with SharePoint Framework (SPFx)
      • Designing Power Automate Flows with Microsoft Visio
      • Innovative uses of Visio Lists
    • Webcasts ➡
      • Visio in Organizations
      • My session and other Visio sessions at MSIgnite 2019
      • Power up your Visio diagrams
      • Vision up your Visio diagrams
      • The Visio 2010 MVP Sessions
    • Visio Web Learning Resources
    • Books➡
      • Visualize Complex Processes with Microsoft Visio
      • Mastering Data Visualization with Microsoft Visio
      • Microsoft Visio Business Process Diagramming and Validation
      • Visualizing Information with Microsoft Visio
  • Blog
    • Browse blog articles
    • Visio Power BI articles
    • Visio for Web articles
    • A history of messaging and encryption
  • About us
    • About bVisual
    • Testimonials
    • Bio of David Parker
    • Contact Us
    • Website Privacy Policy
    • Website terms and conditions
    • Ariba Network

ShapeSheet Formulas

Published on July 14, 2023 by David Parker

More Parsing XML Data in Visio Shapes

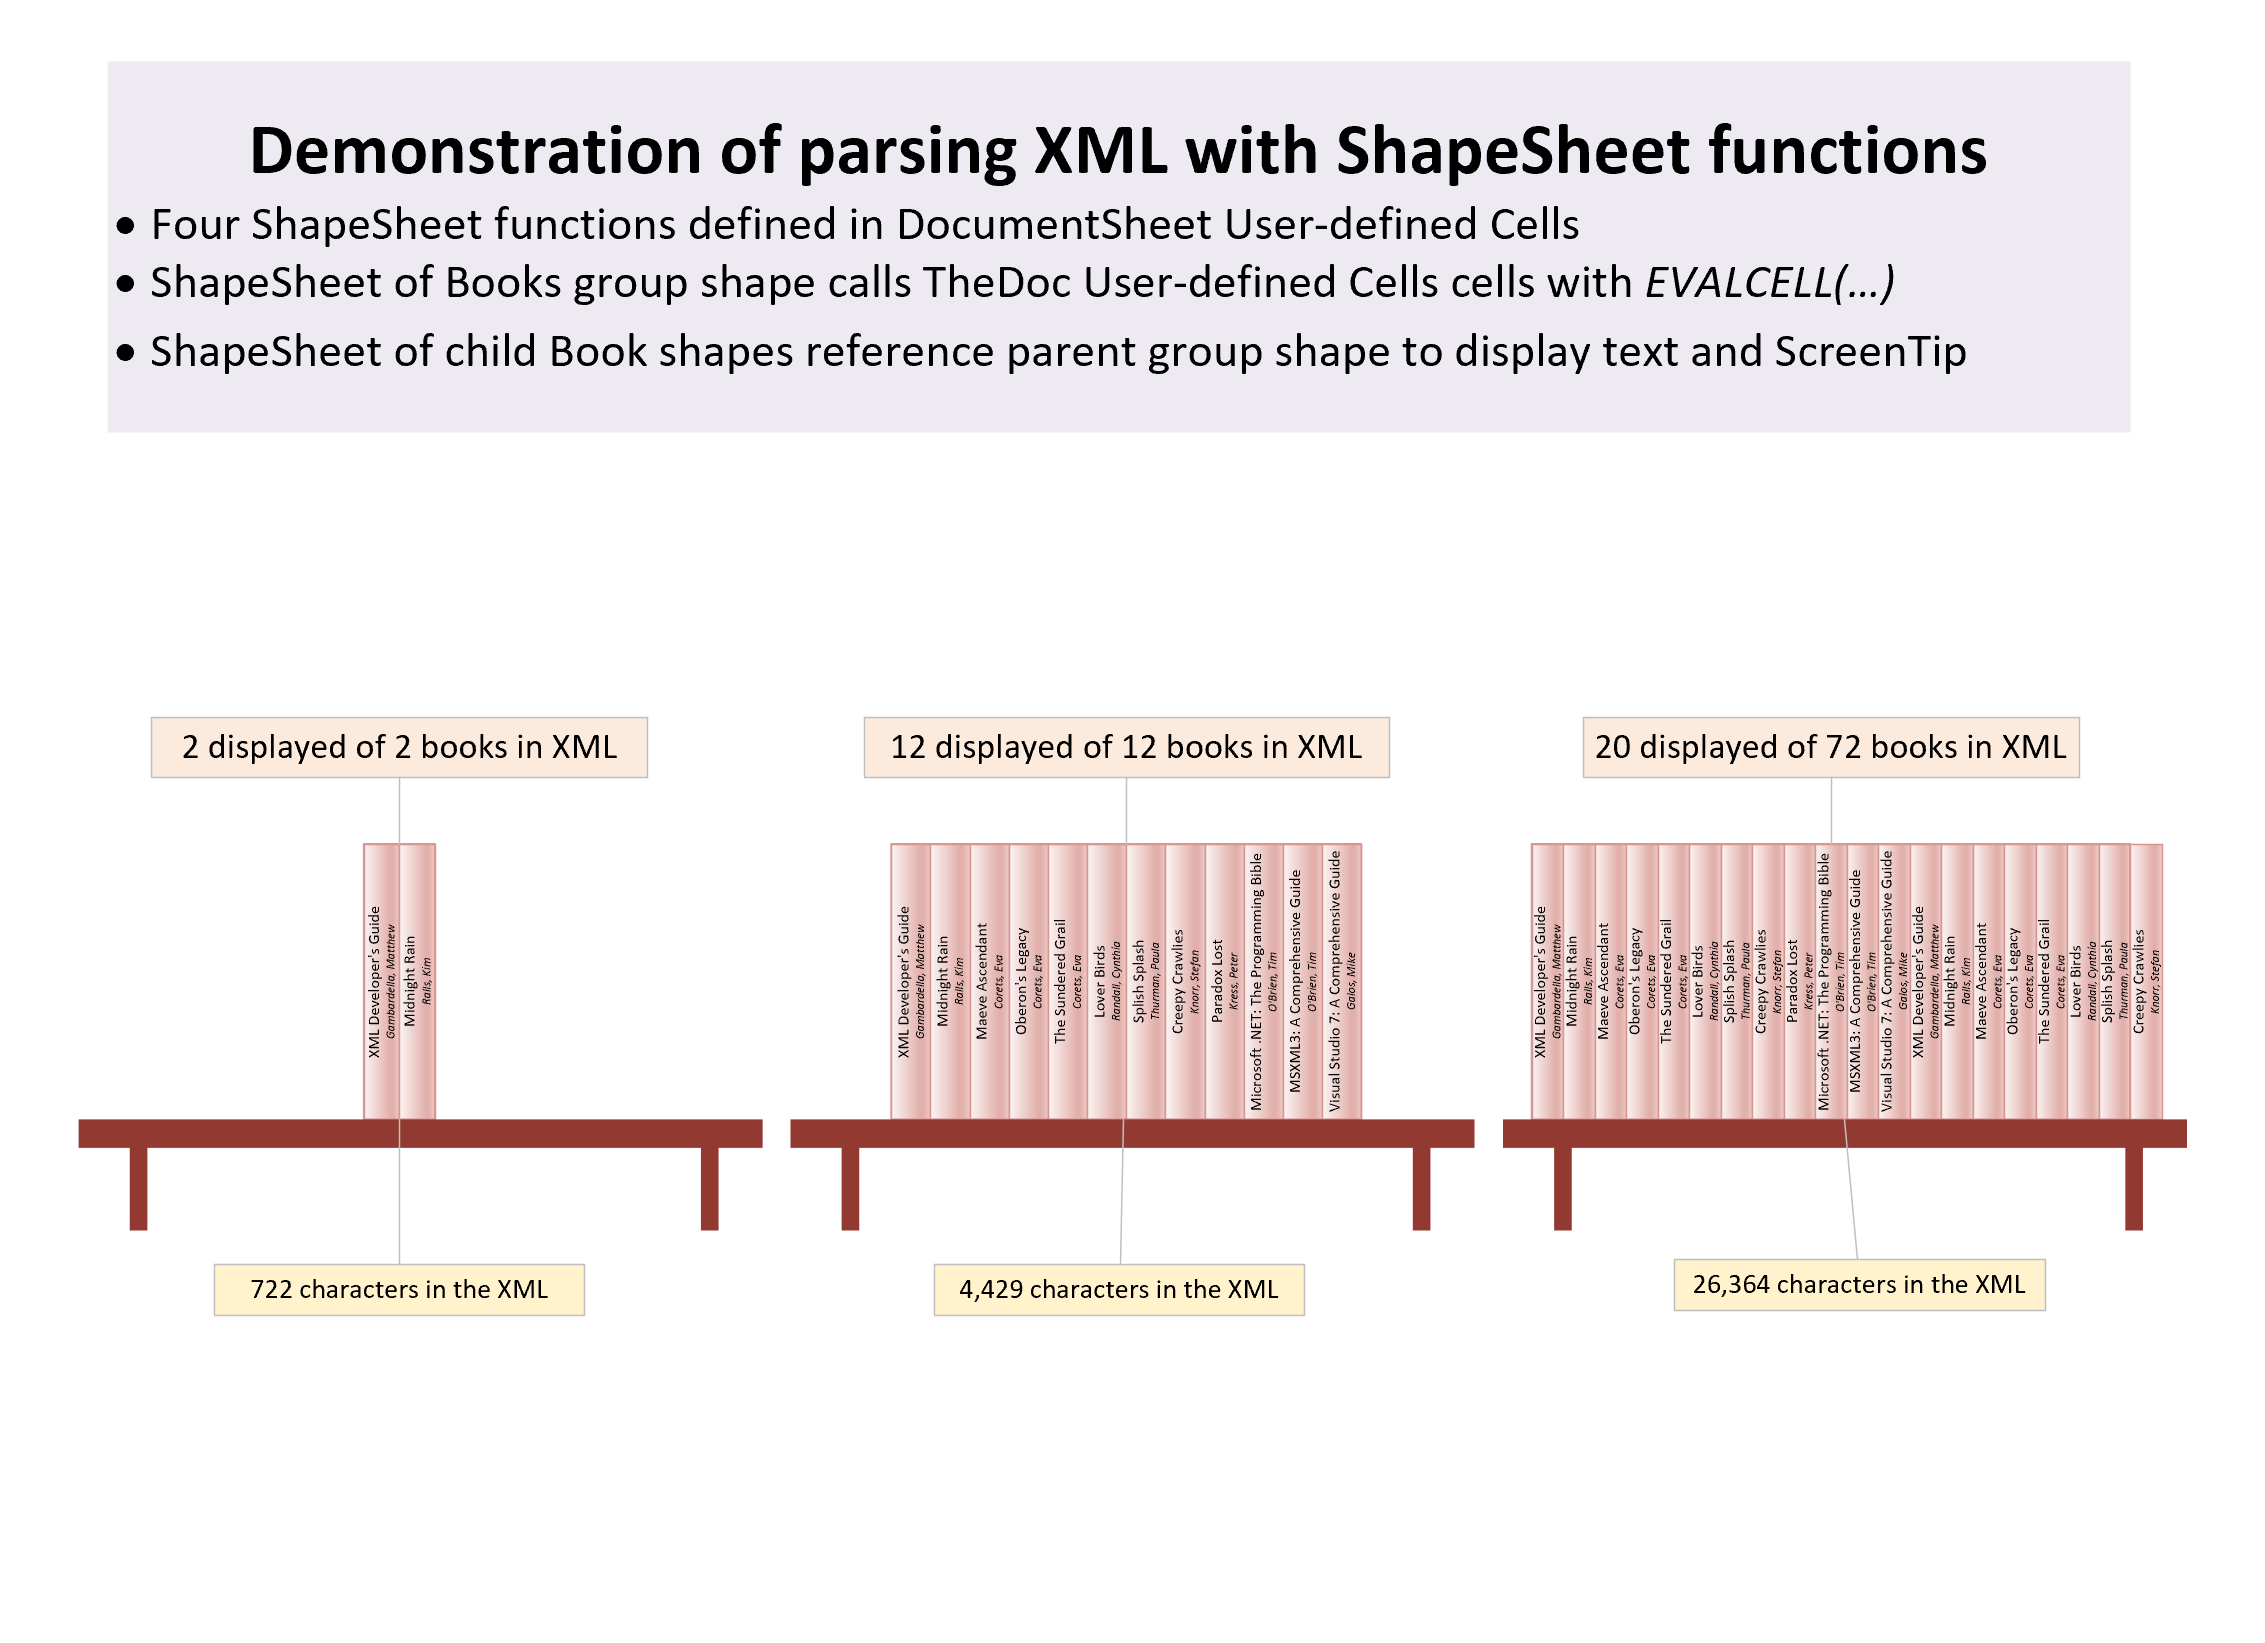
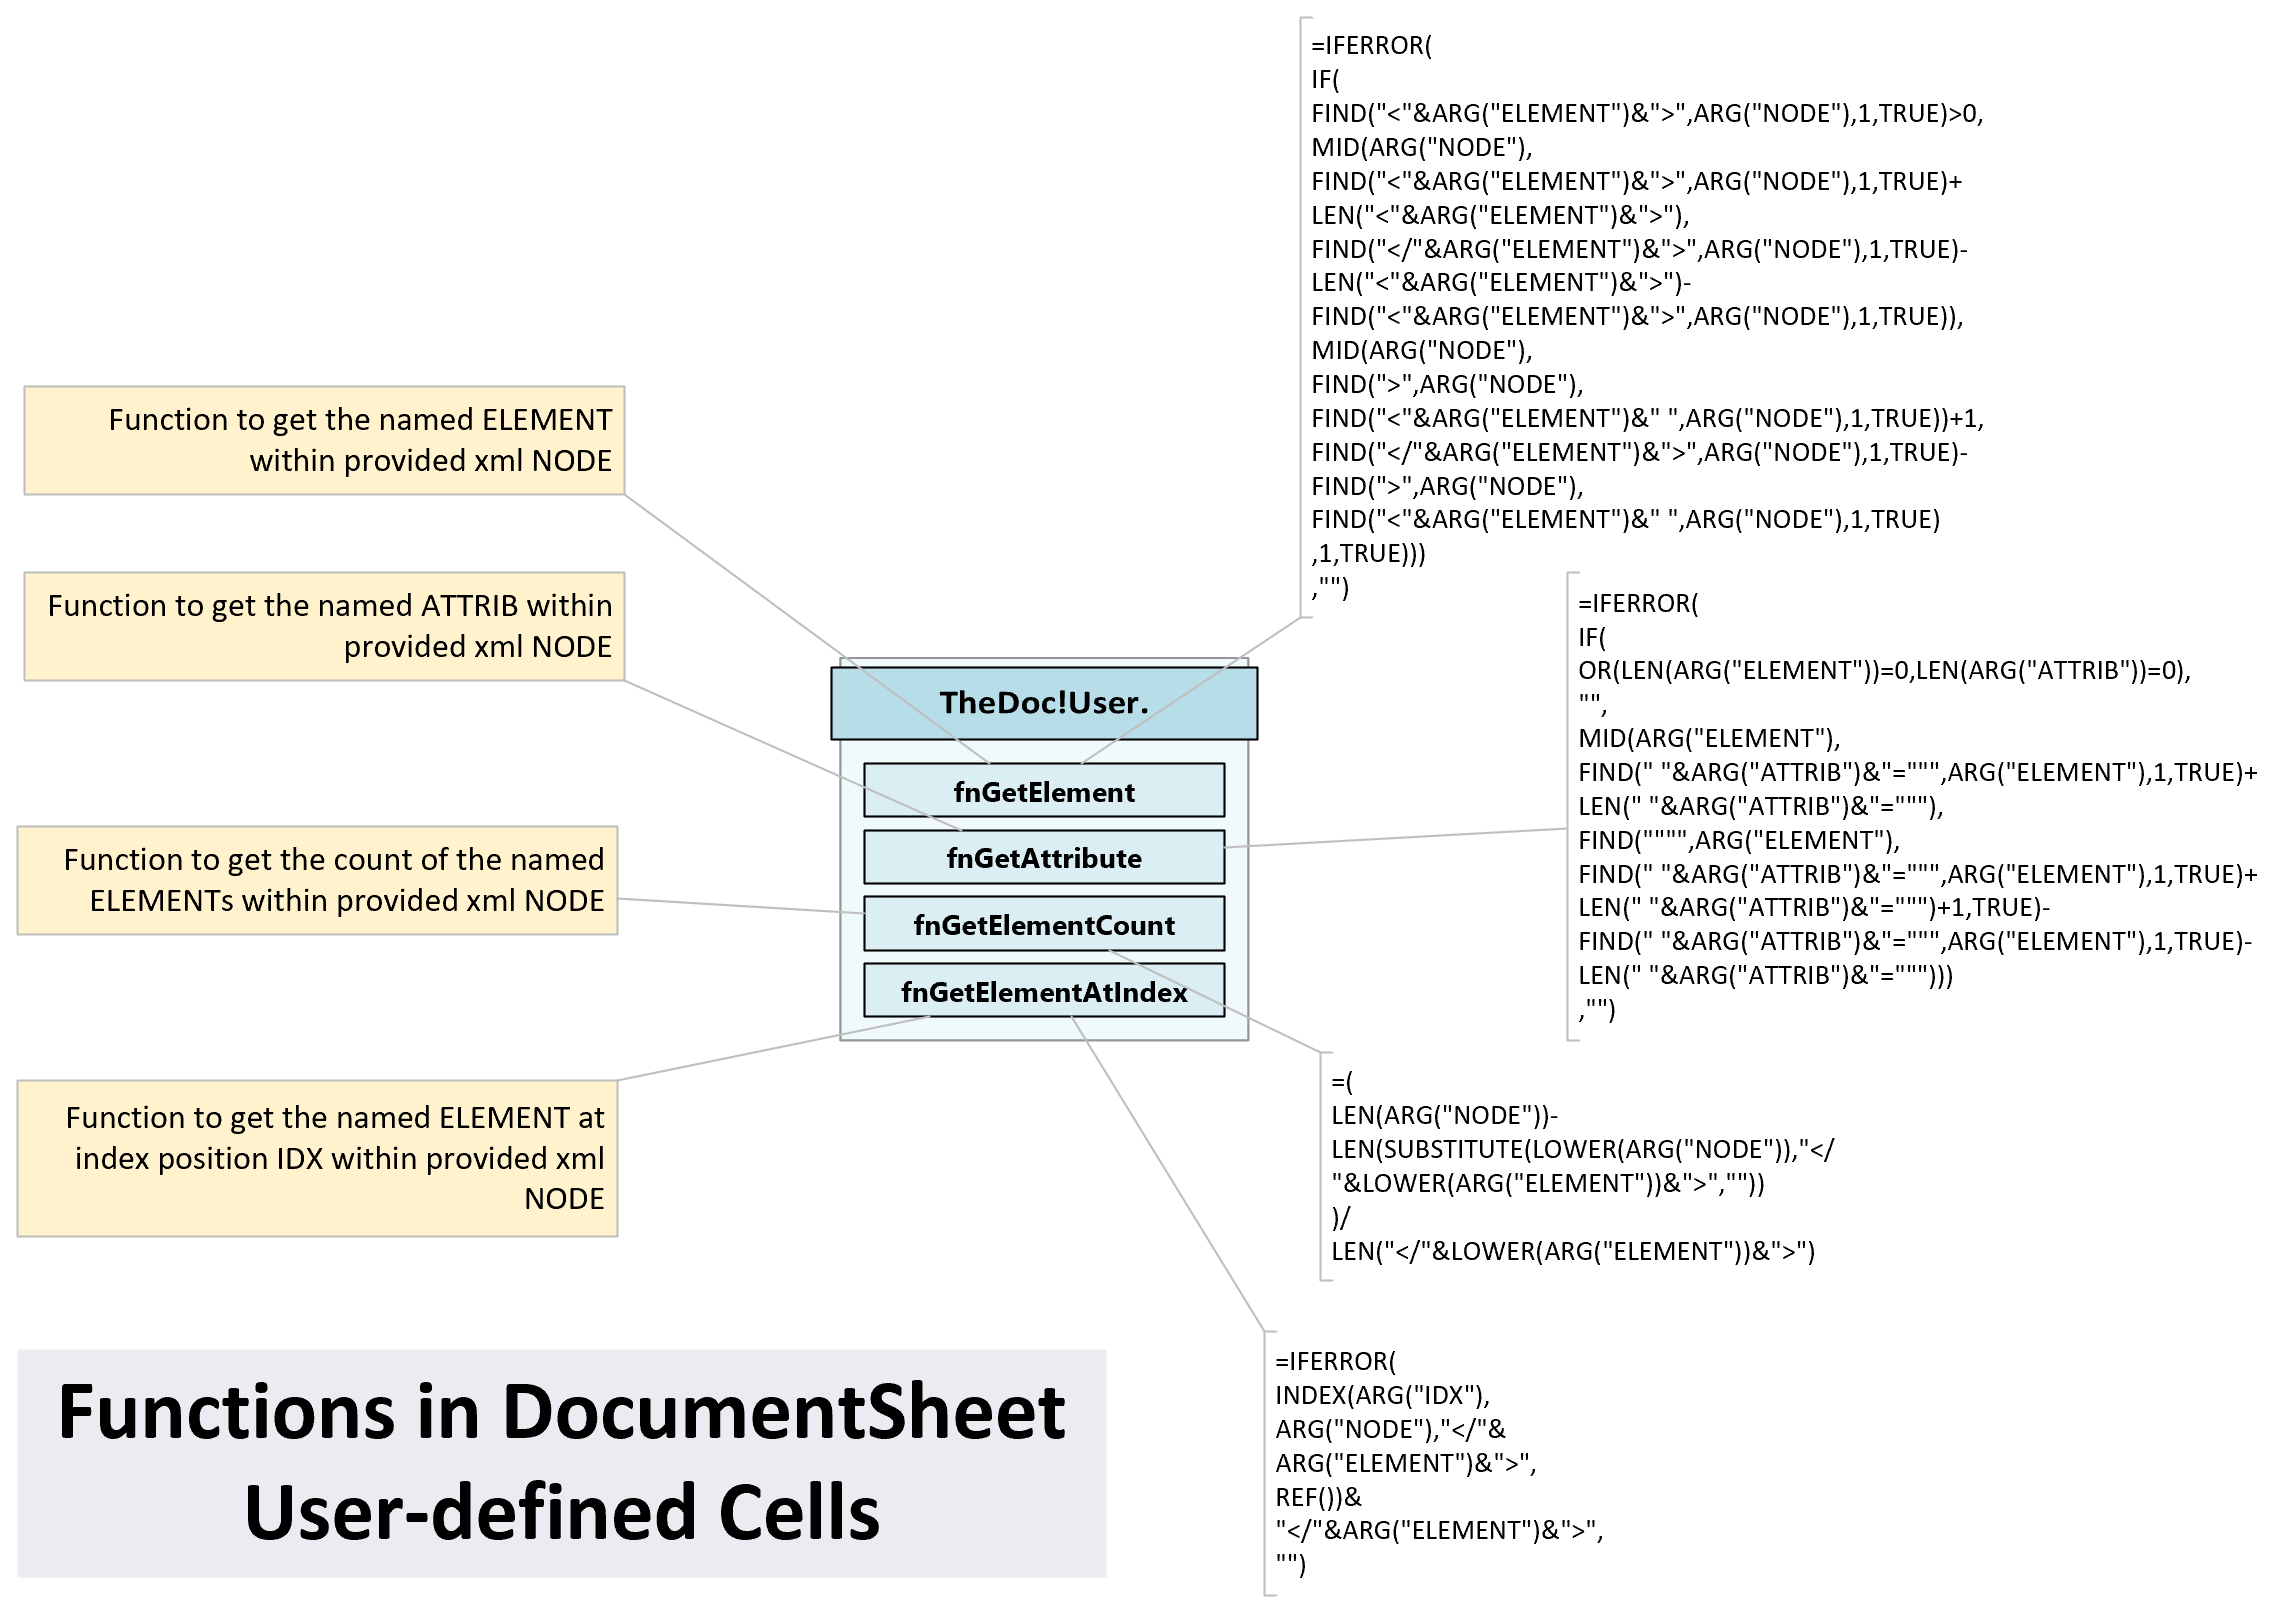
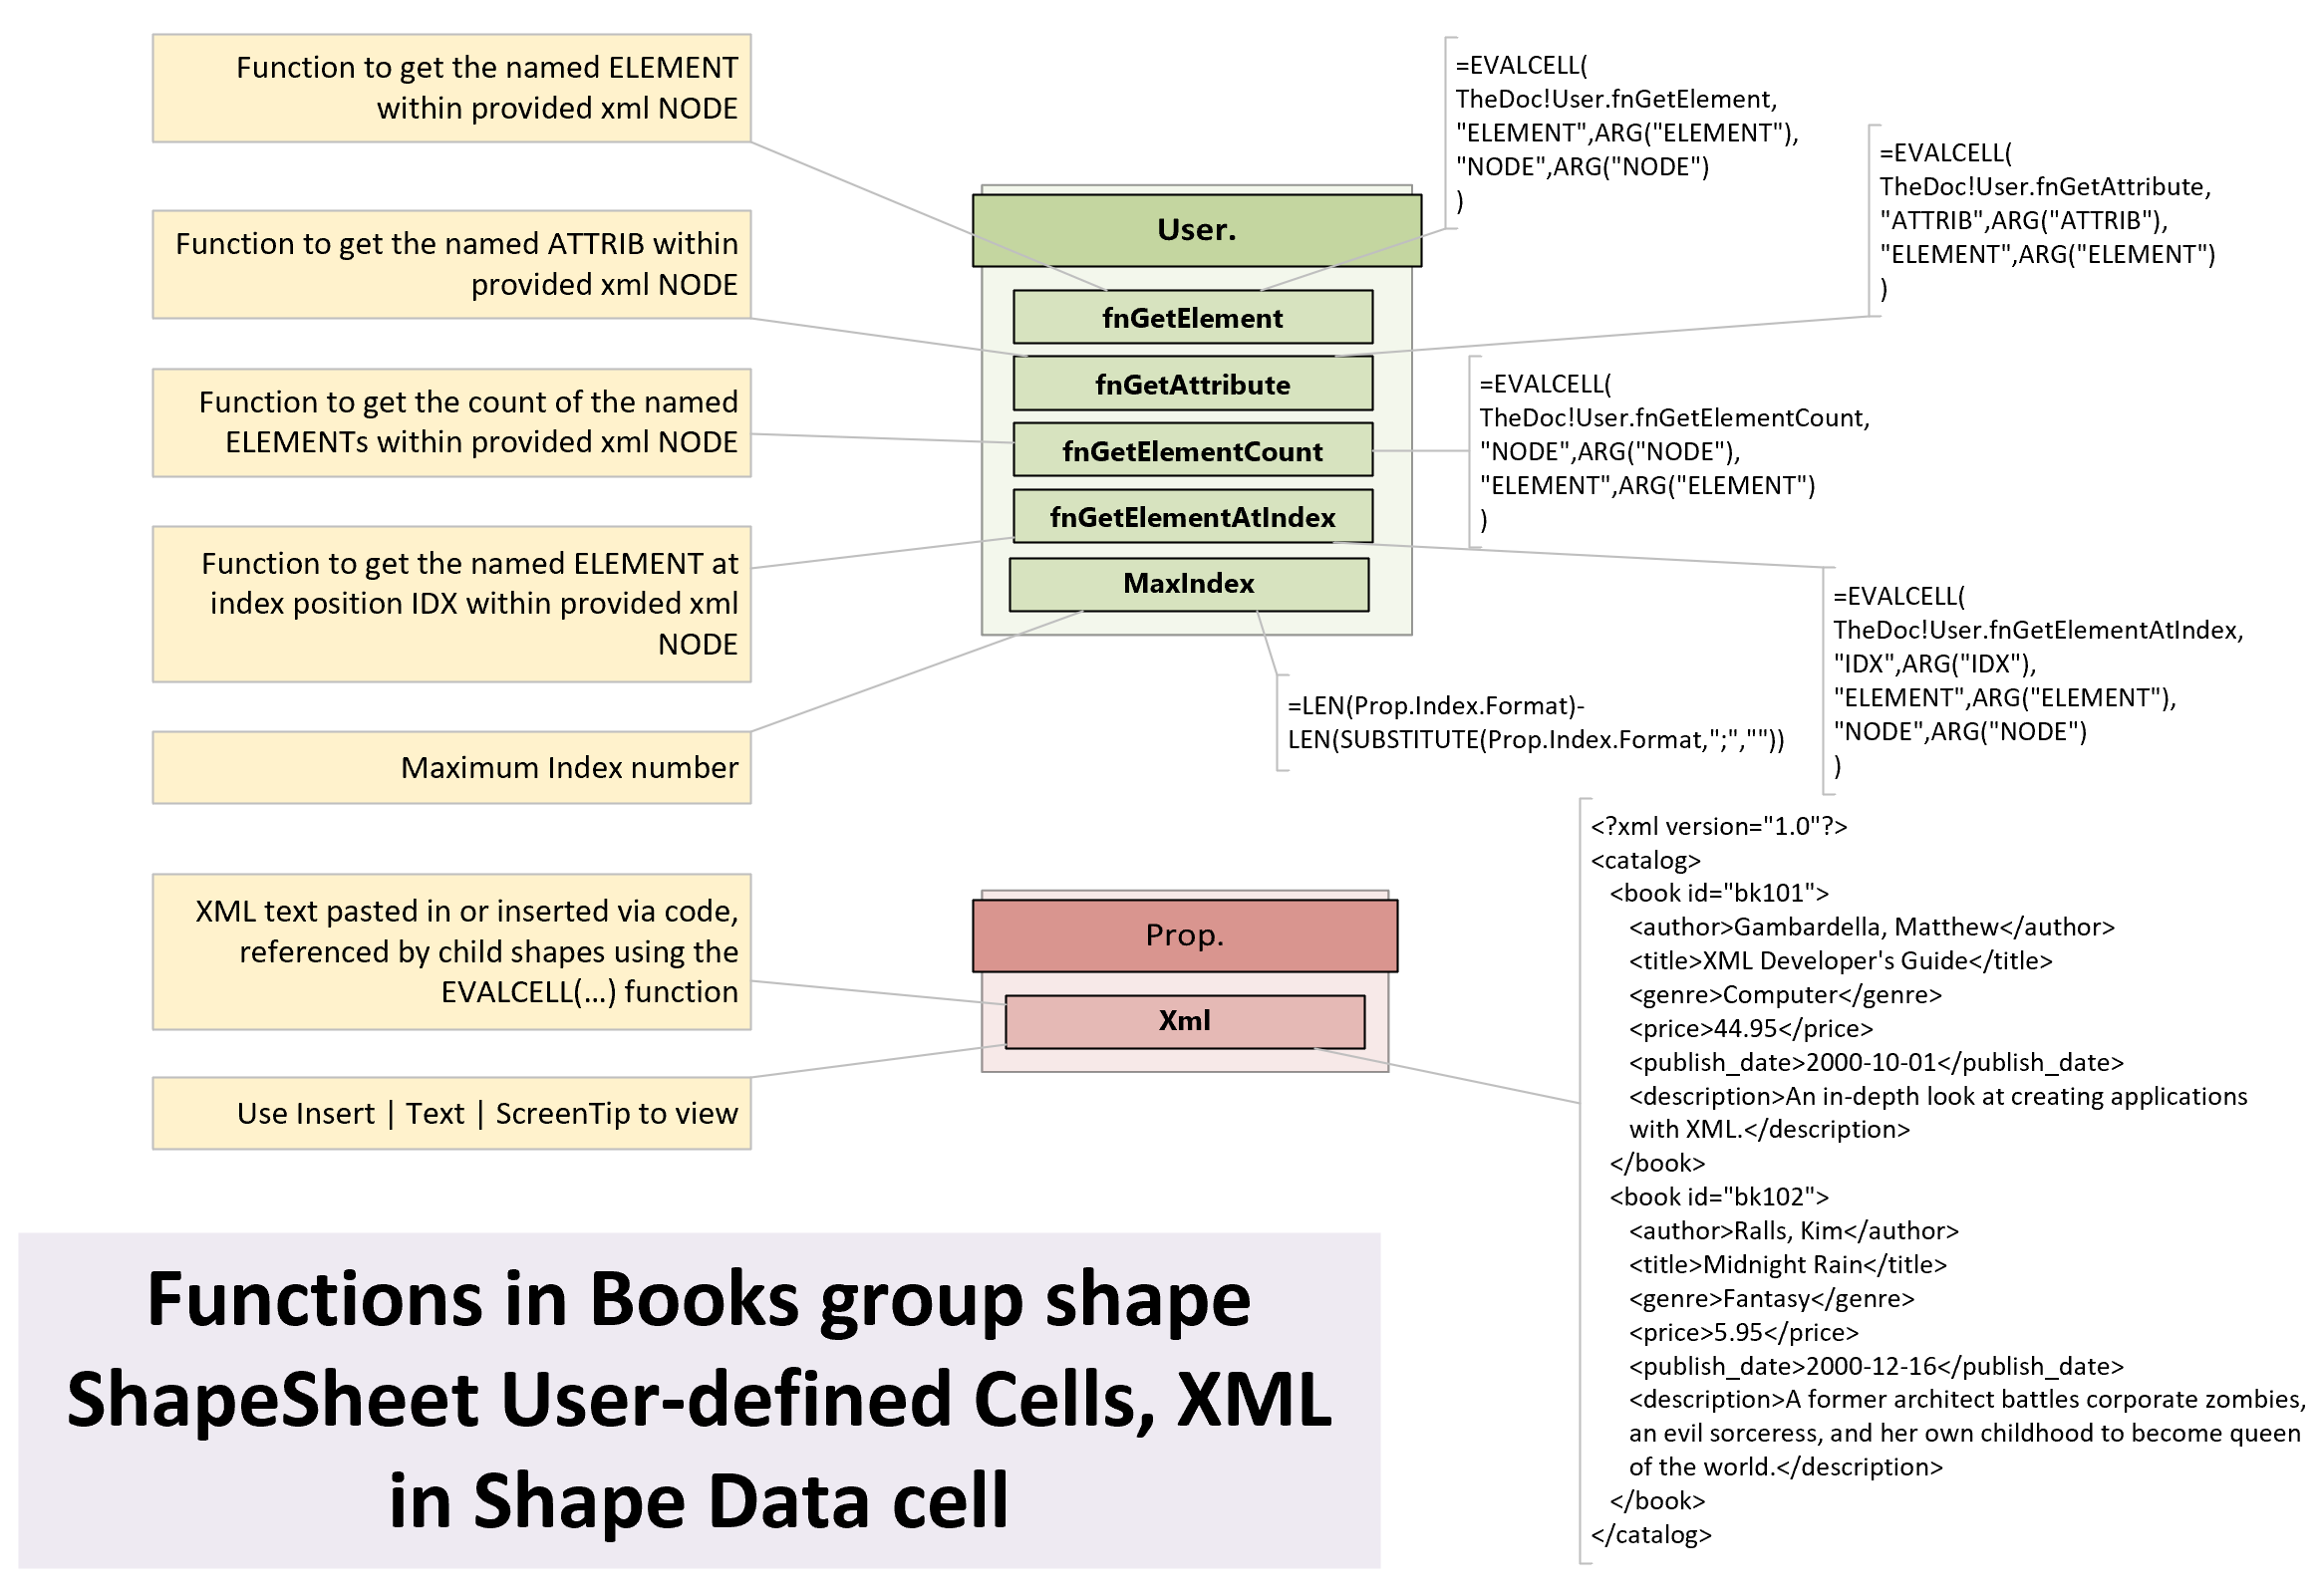
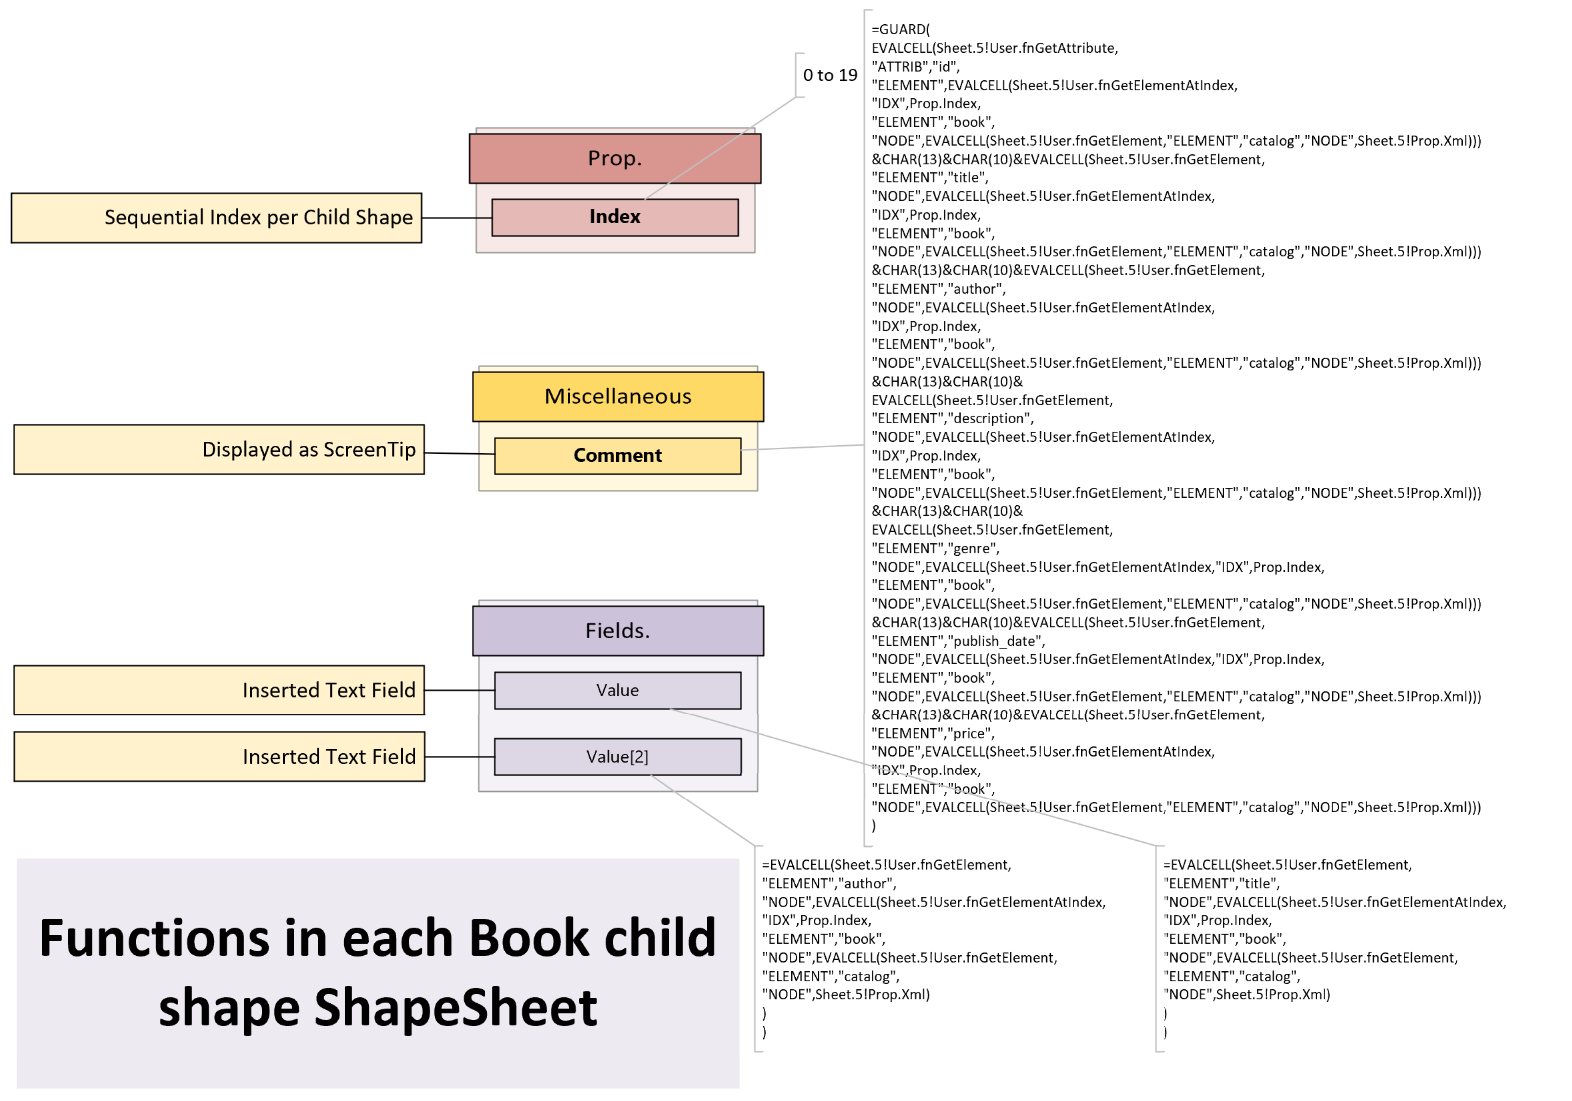
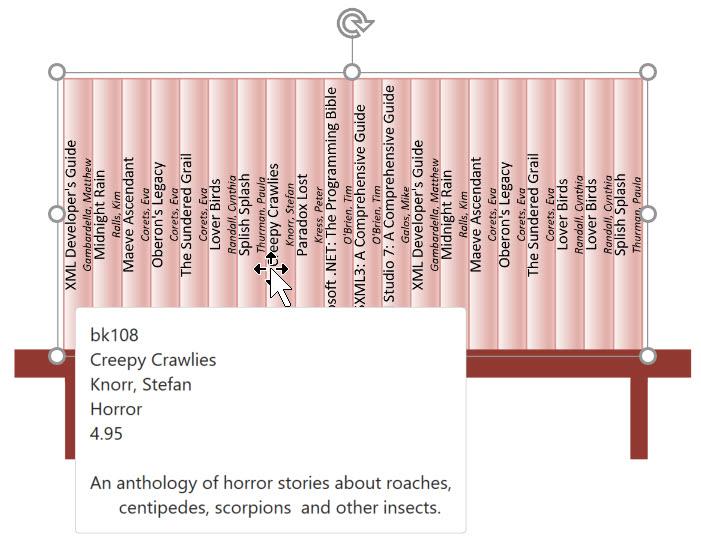
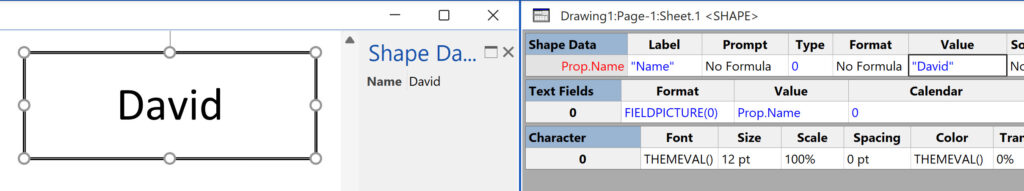
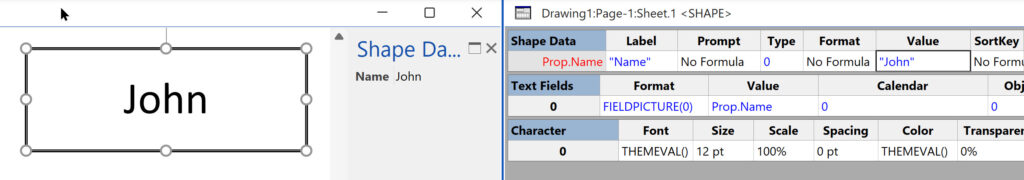
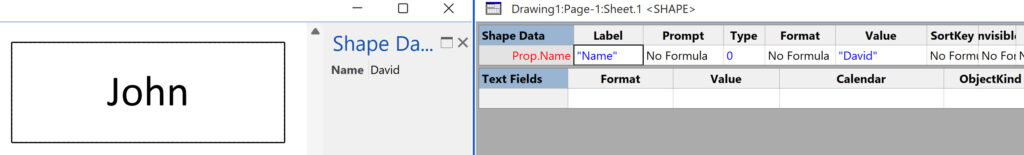
My last article looked at parsing an XML string with a known structure and order of elements and attributes. This can be acceptable in some scenarios, but what if the elements or attributes are in a different order? Then it is necessary to use the element and attribute names rather than their index position. This requires a little more complexity to the ShapeSheet functions, and this can result in longer processing time, so needs to be used cautiously, but it is possible, as I demonstrate in this article.

  • Books group shape contains 20 child book shapes
  • Main functions in the document ShapeSheet
  • Called from cells in the group shape
  • Child shapes call functions in the parent shape
[Read more…] about More Parsing XML Data in Visio Shapes

Filed Under: Shape Data, ShapeSheet Formulas, Visio Tagged With: ShapeSheet Functions, Visio, Xml

Published on June 26, 2023 by David Parker

Parsing XML data in Visio Shapes

One of my current projects uses XML data, and some of the values in the XML data control the display and content of Visio shapes. Therefore, I looked deeper into how the XML data can be used directly to control parts of the graphics.

Although the external data linking feature in Visio Professional and Visio Plan 2 does have the ability to use XML files, the structure of these XML files is in a particular ADO format, and not suitable for the XML data in this project.

Also, Visio documents can have embedded XML data within it, and there are several methods available to work with the XML, such as Document.SolutionXMLElement. In fact, there are several ShapeSheet cells that can also hold SolutionXML too, as found in the Visio SDK :

The cell must be an A through D cell of the Scratch section or value cell of the User or Custom Properties section.

Custom Properties is the former name of Shape Data, and the SDK contains sample code for putting XML into the Document and a ShapeSheet cell. Unfortunately, the SolutionXML functions only work with the Document, not with a Cell.

Again, there does not seem to be a compelling reason to use SolutionXML with shape cells in my current project because it just adds extra characters, and slightly modifies the XML characters.

Visio cells can store very large amounts of text within them, and in this particular project, I have well structured XML with predictable elements and attributes. Similarly, there are many variations of books.xml on the web, ( small, medium, large ) which I have used for this article to demonstrate what can be done with XML in shapes.

In my case, I have created a Visio shape which has a Shape Data row to store the XML data, and other User-defined Cells to parse the XML data, then more Shape Data rows to just check the contents. I then have a 20 book sub-shapes that can become visible and display the information in the parent XML data automatically:

  • Small XML data set contains 2 books
  • Small XML data set contains 12 books
  • Small XML data set contains 2,652 books, but first 20 shown
[Read more…] about Parsing XML data in Visio Shapes

Filed Under: ShapeSheet Formulas Tagged With: ShapeSheet Functions, Visio

Published on June 23, 2023 by David Parker

Highlighting dirty text in Visio shapes

I suppose I should explain what I mean by dirty text first 🙂

I often display the value of a Shape Data row in Visio text, but sometimes the solution requires that the value is also editable. This is ok if the client accepts that all editing is done with the Shape Data window or dialog, but not if the user more naturally wants to edit the text in the shape. In my current solution, I want to pass the manually edited text to another process for checking, and then only update the Shape Data row when validated or accepted, before re-setting the text with the inserted field. My first task was to spot with text had been manually overtyped, so I decided that checking the value of a new User-defined Cell, called IsDirty, was best, and then this value can be used to change the color of the text (or it could be the LineColor or FillForegnd) to make this value visible.

When Insert / Field is used in Visio, it creates a Text Fields section which can hold the reference to the inserted field.

If the text is manually overtyped, then the rows in the Text Fields section get deleted.

  • The Prop.Name Shape Data row inserted as a Field
  • Editing the Shape Data window dislays the value in the shape too
  • Editing the text deletes the inserted field
[Read more…] about Highlighting dirty text in Visio shapes

Filed Under: Shape Data, ShapeSheet Formulas Tagged With: ShapeSheet Functions, VBA, Visio

Published on May 15, 2023 by David Parker

My new book on Visualizing Processes with Microsoft Visio has launched

Back in the early 1990s, there was an application called ABC Flowcharter that was the market leader for diagramming business flowcharts, but some of the brains behind Aldus PageMaker saw an opportunity to create something smarter, and left to write the Visio product, with the stated aim to overtake ABC Flowcharter within 2 years. They did it in just 18 months and Visio expanded to cover more types of diagramming, especially organization charts and network diagramming. Visio became the default vector-based, data-diagramming application for the desktop, and so Microsoft acquired the company in 2000, who started to integrate it with Microsoft Office applications. Many imitators on the desktop tried to emulate Visio, but most fell by the wayside. There were constant requests for Visio to work on Apple Macs, but Microsoft resisted making a Mac specific version, and instead started to make Visio work in a web-browser, so it can work anywhere on any modern device. There are literally millions of lines of code on Visio, so it was never going to be straightforward or easy, but now we do have a light edition of Visio provided to all M365 business subscribers, and two extra subscription levels for more features and capabilities. We still have desktop Visio Standard and Professional, but the edition that straddles both the desktop and web is Visio Plan 2. It has some desktop only features delivered via web-services, and an enhanced browser-based editing experience. Visio Plan 2 is the edition for heavy or advanced users, but any of the desktop editions can be viewed as a design studio for content that can be used by the browser users because of Visio’s unique ShapeSheet feature that contains Excel-like formulas to control the properties of the shapes. Almost all of these formulas work in the web browser, but desktop Visio is required to write the formulas initially. This means that powerful customizations are possible without any web-scripting, and achievable by anyone who can write formulas in Excel!

So, this new book focuses on the original driver for Visio, process flowcharts, and explains how the different Visio editions can be used to create, edit, collaborate, comment, present, automate, export them, and finally how to customize them. Find out more at Visualize Complex Processes with Microsoft Visio!

[Read more…] about My new book on Visualizing Processes with Microsoft Visio has launched

Filed Under: Books, Data Visualizer, Ebooks, Process Flows, ShapeSheet Formulas, Visio, Visio for Desktop, Visio for M365, Visio for Web, Visio Plan 1, Visio Plan 2 Tagged With: My Books, Processes, Visio

Published on April 28, 2023 by David Parker

Interactive Demographics of the European Union in Visio

I was recently contacted by a reader, Stanley M. Max (Towson University lecturer), who had started creating a Visio map of the 27 countries in the European Union in 2020, along with the demographics culled from Wikipedia. He wanted to know if the map and stats could be combined to make a more appealing presentation. Well, that prompted me to not only combine the data and country shapes, but to explore ways in which a presentation of the map can be made more interesting in Visio. So, I added data and hyperlinks to the shapes, and set up a page property for the selected country which automatically highlights the country shape, statistics, and header, to which I added flags. So, the user can either set the page country using the Shape Data window for the page, or context menu of each country, or simply by double-clicking.

  • The original Visio page
  • The original Excel table
  • The enhanced Visio page
  • A country selected for the page
  • Adding Slide Snippets
  • Exported to PowerPoint
  • Export to Word previews
  • Exported to Word
[Read more…] about Interactive Demographics of the European Union in Visio

Filed Under: Geographic, PowerPoint, Shape Data, ShapeSheet Formulas, Slide Snippets, SS Plus, Visio for Desktop, Visio for Web Tagged With: PowerPoint, Shape Data, Slide Snippets, Visio, word

Published on April 9, 2023 by David Parker

Understanding Visio Data Graphic’s Color by Value

The desktop Visio editions, Visio Professional and Visio Plan 2, have a great way of automatically displaying data as Data Bars, Icon Sets, Text Callouts and Color by Value. The first three types of Data Graphics require sub-shapes to be inserted into each shape that they are applied to, but the last one, Color by Value (CBV), merely requires some User-defined Cells and formulas. However, unlike the first three, there can be only one Shape Data value displayed as colours in each Data Graphic (DG). So, how can we easily update the colour assigned to each value using code, rather than manually using the manual dialogs provided?

  • One Data Graphic with 4 CBVs
  • The first in the list is applied
  • Numeric data can have two types of CBV
  • Locating the Data Graphic master
[Read more…] about Understanding Visio Data Graphic’s Color by Value

Filed Under: Data Graphics, ShapeSheet Formulas, Visio for Desktop, Visio Plan 2 Tagged With: Data Graphics, ShapeSheet, Visio

  • « Go to Previous Page
  • Page 1
  • Page 2
  • Page 3
  • Page 4
  • Page 5
  • Interim pages omitted …
  • Page 19
  • Go to Next Page »

Primary Sidebar

  • LinkedIn
  • Twitter

Recent Posts

  • Fixing dimensions of 2D shapes
  • Merging Linked Data from Similar Tables
  • Smart Radio Buttons and Check Boxes in Visio
  • Using Button Face Ids in Visio
  • Grid Snapping Revisited

Categories

Tags

Accessibility Add-Ins Connectors Containers Data Export Data Graphics Data Import Data Visualizer Educational Excel GraphDatabase Hyperlinks Icon Sets JavaScript LayerManager Layers Legend Link Data to Shapes Lists MSIgnite MVP Office365 Org Chart PowerApps PowerBI PowerQuery Processes Setup and Deployment Shape Data Shape Design ShapeSheet ShapeSheet Functions SharePoint 2013 SQL Teams Validation VBA Video Visio Visio 2007 Visio for the Web Visio Online Visio Services Visio Viewer Webinar

Footer

bVisual Profile

The UK-based independent Visio consultancy with a worldwide reach. We have over 25 years experience of providing data visualization solutions to companies around the globe.

Learn more about bVisual

  • Amazon
  • E-mail
  • Facebook
  • LinkedIn
  • Twitter
  • YouTube

Search this website

Recent posts

  • Fixing dimensions of 2D shapes
  • Merging Linked Data from Similar Tables
  • Smart Radio Buttons and Check Boxes in Visio
  • Using Button Face Ids in Visio
  • Grid Snapping Revisited

Copyright © 2025 · Executive Pro on Genesis Framework · WordPress · Log in