I have often wanted a Visio map of the world, with countries that can be linked to data. There are a number of Visio country shapes that are available for download on the internet, but they are fairly old, and certainly don’t have an up to date world. For example, South Sudan is currently the newest country in the world (2011), though a lot of resources on the web don’t show it. So, I was relieved to find a good SVG world map at http://commons.wikimedia.org/wiki/File:BlankMap-FlatWorld6.svg?uselang=en-gb . Even better was that each of the shapes are named with the ISO2 code. This meant that I could use Link Data to Shapes to automatically create Shape Data from an Excel worksheet that I put together from various sources.
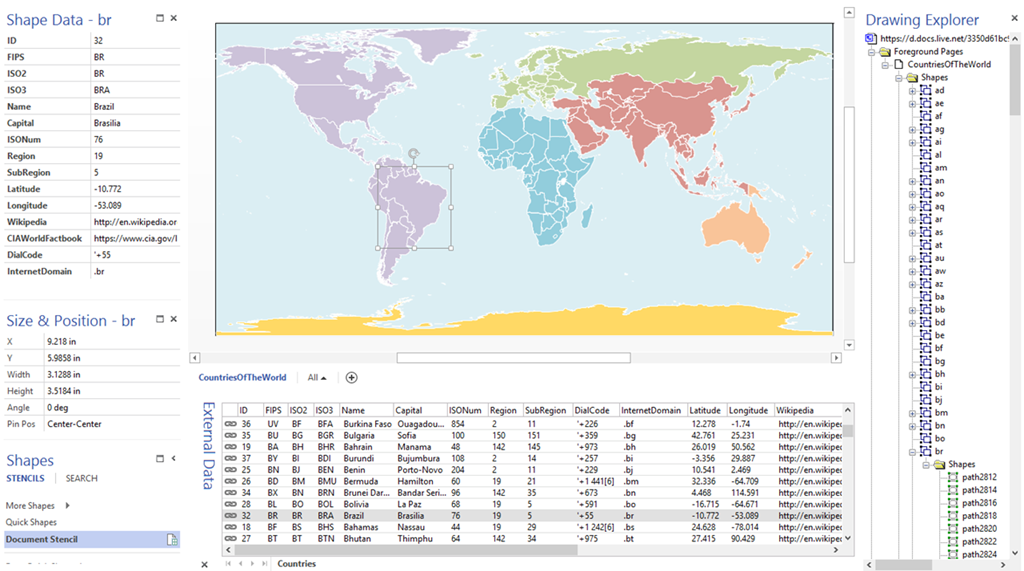
Note that I had to add Kosovo manually, since it was not on the original map, as it’s status as a country is in dispute. The ISO codes have apparently been temporarily assigned.
[Read more…] about Visio Map of the World


