• Skip to main content
  • Skip to primary sidebar
  • Skip to footer

bVisual

  • Home
  • Services
    • How Visio smartness can help your business
    • Visio visual in Power BI
    • Visio Consulting Services
    • Visio Bureau Services
    • Visio Training and Support Services
  • Products
    • Visio Shape Report Converter
    • SS Plus
    • LayerManager
    • visViewer
    • Metro Icons
    • Rules Tools for Visio
    • The Visio 2010 Sessions App
    • Multi-Language Text for Visio
    • Document Imager for Visio
    • multiSelect for Visio
    • pdSelect for Visio
  • Case Studies
    • Case studies overview
    • Using Visio in Education for GIS
    • Visualizing Construction Project Schedules
    • Visio Online Business Process Mapping
    • Nexans Visio Template
    • CNEE Projects, WorldCom
    • Chase Manhattan Bank
  • News
    • Recent news
    • News archive
  • Resources
    • Articles➡
      • ShapeSheet Functions A-Z
      • Comparing Visio for the Web and Desktop
      • Customising Visio Shapes for the Web App
      • Key differences between the Visio desktop and web apps
      • Using the Visio Data Visualizer in Excel
      • Using Visio in Teams
      • Creating Visio Tabs and Apps for Teams with SharePoint Framework (SPFx)
      • Designing Power Automate Flows with Microsoft Visio
      • Innovative uses of Visio Lists
    • Webcasts ➡
      • Visio in Organizations
      • My session and other Visio sessions at MSIgnite 2019
      • Power up your Visio diagrams
      • Vision up your Visio diagrams
      • The Visio 2010 MVP Sessions
    • Visio Web Learning Resources
    • Books➡
      • Visualize Complex Processes with Microsoft Visio
      • Mastering Data Visualization with Microsoft Visio
      • Microsoft Visio Business Process Diagramming and Validation
      • Visualizing Information with Microsoft Visio
  • Blog
    • Browse blog articles
    • Visio Power BI articles
    • Visio for Web articles
    • A history of messaging and encryption
  • About us
    • About bVisual
    • Testimonials
    • Bio of David Parker
    • Contact Us
    • Website Privacy Policy
    • Website terms and conditions
    • Ariba Network

Diagram Types

Published on December 24, 2014 by David Parker

A Visio Countdown to Xmas

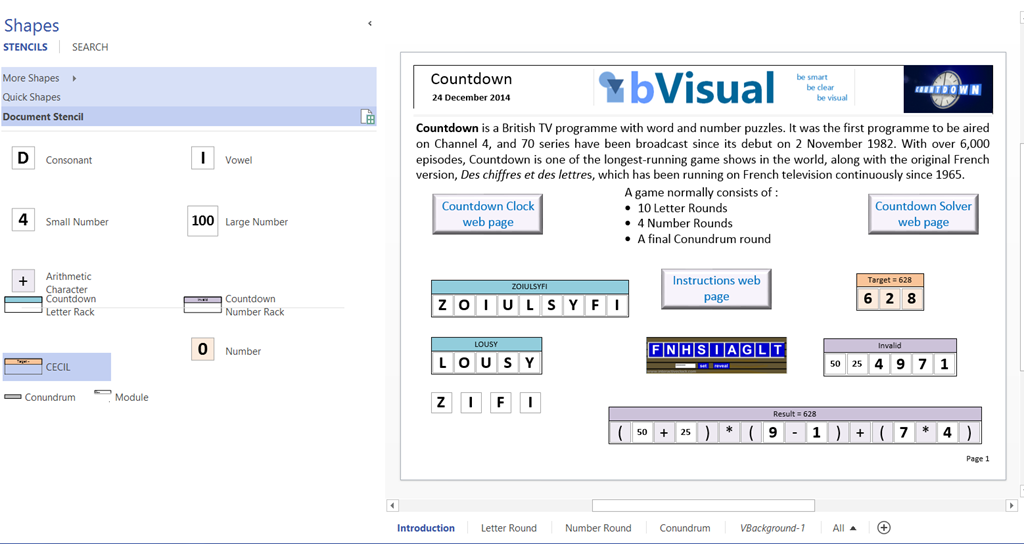
I presented a Visio deck of cards in a previous post ( see http://blog.bvisual.net/2014/12/03/a-visio-deck-of-cards/ ), and now I present a real game that can be played with Visio over the holiday season. Countdown is a British TV programme with word and number puzzles. It was the first programme to be aired on Channel 4, and 70 series have been broadcast since its debut on 2 November 1982. With over 6,000 episodes, Countdown is one of the longest-running game shows in the world, along with the original French version, Des chiffres et des lettres, which has been running on French television continuously since 1965. Read more at http://en.wikipedia.org/wiki/Countdown_%28game_show%29.
image
[Read more…] about A Visio Countdown to Xmas

Filed Under: Games, Lists, Visio 2013 Tagged With: Shape Data, ShapeSheet Functions

Published on December 3, 2014 by David Parker

A Visio Deck of Cards

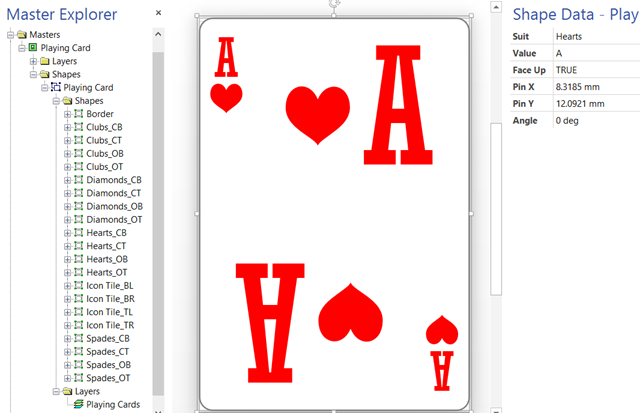
Sometimes I try ideas out in Visio without a specific goal in mind, and I have been creating a Visio deck of cards recently, so I thought I would share it. In fact, I have only created one card but it is capable of being any card in the deck by changing its shape data! I can even get a randomly generated card … all without any code except for formulas in the ShapeSheet.

Firstly, I used four icons for hearts, clubs, diamonds and spades, from my set of metro icons stencils ( see http://blog.bvisual.net/2012/11/20/announcing-metro-icons-and-a-windows-app-tile-shape-for-visio/ ). I decided to keep the icons for the suits separate, with four per suit, but linked their visibility to a Suit Shape Data fixed list row. I also displayed the Value Shape Data as the text of each icon.

image

I added a Face Up Shape Data row so that the suit and value are hidden by the Microsoft Office logo.

[Read more…] about A Visio Deck of Cards

Filed Under: Games, Lists, Shape Reports, ShapeSheet Formulas, Visio 2013 Tagged With: Link Data to Shapes, Shape Data, ShapeSheet Functions

Published on September 10, 2014 by David Parker

Union Jacked?

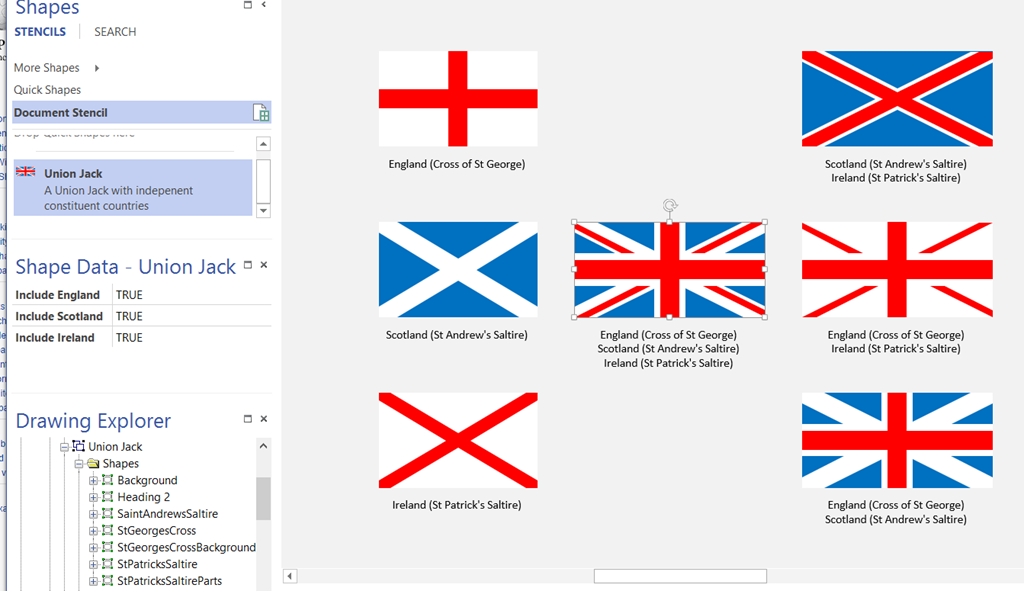
I am in Edinburgh, capital of Scotland, today. All talk is of the vote on Scottish independence next week … so, I thought I would make a Union Jack Visio shape that can be automatically changed, using Shape Data values, to represent the countries left in the union!

The Union Jack is comprised of the flags of England, Scotland and Ireland … sorry Wales, you are only a principality. Yes, I know that Northern Ireland is a province, but it was decided that St Patrick’s Saltire should be kept even after Eire got independence.

Note that a single country flag has an aspect ratio of 5:3, but a multi-country union flag has an aspect ratio of 2:1.

image
[Read more…] about Union Jacked?

Filed Under: Geographic, Shape Data, ShapeSheet Formulas, Visio Tagged With: Shape Data, ShapeSheet Functions

Published on March 26, 2014 by David Parker

Creating a Schema from Visio External Data record sets

Visio introduced External Data record sets in 2007, and I have made great use of them ever since. Visio 2013 has deprecated reverse engineering of databases to produce a schema, which was a function that I loved to use because it allowed me to provide clients with up to date, annotated, enhanced schema diagrams. Microsoft have, however, provided some nice database schema templates in Visio 2013 Professional, so I thought I would provide a way to use the External Data record sets to produce schema diagrams.

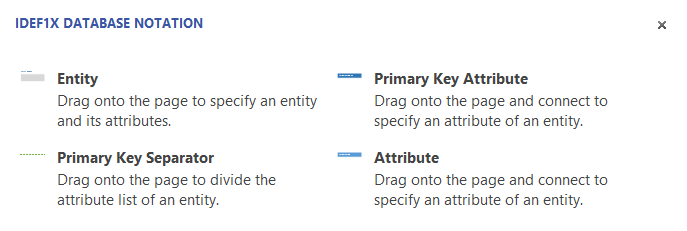
I have created a new custom stencil, based upon the IDEF1X Database Notation template in Visio 2013 Professional, and have added some macros to provide the guided diagramming. I say guided because page position of tables and relationships are left to you, but the macros will create table definitions from External Data record sets.

All of the three database notation templates contain an Entity and an Attribute master. In fact, they also have a Primary Key Attribute master too, but this is identical to the Attribute master, apart from a setting to say it is the primary key. This can be done from the Attribute shape anyway, so I will dispense with the Primary Key Attribute master.

image
[Read more…] about Creating a Schema from Visio External Data record sets

Filed Under: Database, External Data, Lists, Visio, Visio 2013 Tagged With: ER Diagrams

Published on January 27, 2014 by David Parker

Visio Map of the World Update

My earlier post about the world in Visio shapes, see http://blog.bvisual.net/2013/08/16/visio-map-of-the-world/ , has been one of my most popular, and a reader recently asked about changing the colour of countries by data not in my original worksheet, and another asked about adding labelled dots.

Well, at first, I thought it would be quite simple to add more Data Graphics with the Color By Value that I already had, but then I realised that I needed to adjust some of the shapes that I had created from SVG in my previous article.

The problem is that some of the country shapes which were converted from SVG have geometry at the top group level. This means that any Data Graphic items, other than Color By Value, are actually sub-shapes of the group and will be hidden by the country shape itself. That is probably why the Data Graphics task, on the selected Afghanistan shape below, sent the AF label over to the right of it, whereas all the group shapes with all their geometry in sub-shapes, such as the AE (United Arab Emirates) shape, placed the label in its centre.

image
[Read more…] about Visio Map of the World Update

Filed Under: Geographic, Visio Tagged With: Data Graphics, Link Data to Shapes, Visio 2010, Visio 2013

Published on August 16, 2013 by David Parker

Visio World Time Zones

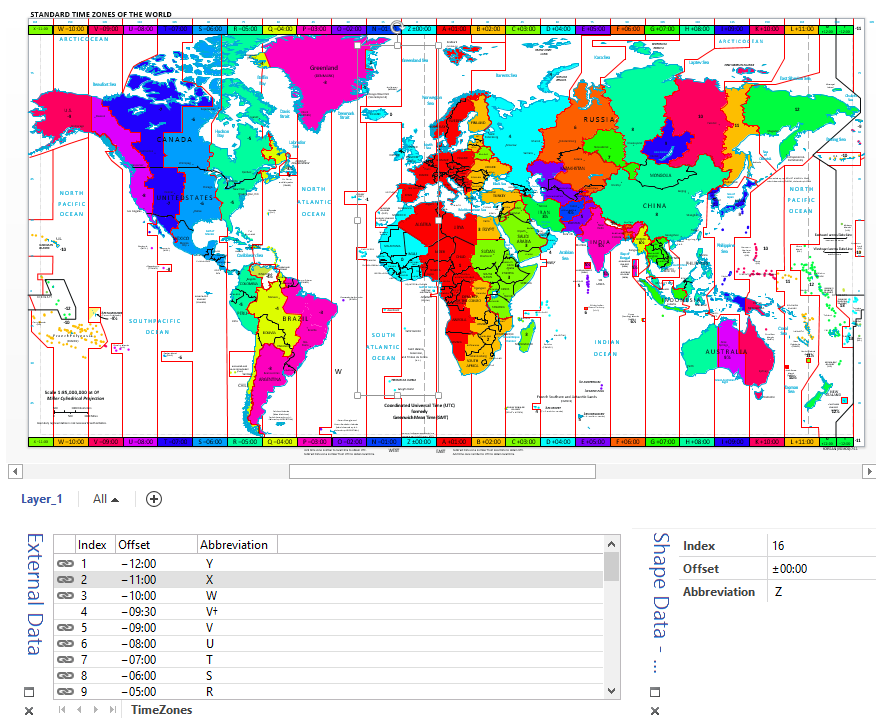
My last post about a world map inspired me to find a time zone map that could be used in Visio. I found an SVG map at

http://upload.wikimedia.org/wikipedia/commons/6/68/Standard_time_zones_of_the_world_%282012%29.svg that I could convert, and link a list of time zones from

http://en.wikipedia.org/wiki/List_of_time_zones_by_UTC_offset that I put into Excel.

image

I have used Visio’s Color By Value Data Graphics, so you can easily edit the colour scheme.

You can download this map from WorldTimeZones.vsdx

Filed Under: Geographic, Visio 2013 Tagged With: Link Data to Shapes, Shape Data

  • « Go to Previous Page
  • Page 1
  • Interim pages omitted …
  • Page 5
  • Page 6
  • Page 7
  • Page 8
  • Page 9
  • Go to Next Page »

Primary Sidebar

  • LinkedIn
  • Twitter

Recent Posts

  • Introducing a free Visio Report Runner application
  • Protecting the integrity of custom Visio masters
  • Docked Stencils in Visio for the Web
  • My Visio Books and Old pre-C# Work
  • Migrating from Lucidchart to Visio?

Categories

Tags

Accessibility Add-Ins AdvancedInstaller Connectors Containers Data Export Data Graphics Data Import Data Visualizer Educational Excel GraphDatabase Hyperlinks Icon Sets JavaScript LayerManager Layers Legend Link Data to Shapes MSIgnite Office365 Org Chart PowerApps PowerBI PowerQuery Processes Setup and Deployment Shape Data Shape Design ShapeSheet ShapeSheet Functions SharePoint 2013 SQL Teams Validation VBA Video Visio Visio 2007 Visio for the desktop Visio for the Web Visio Online Visio Services Visio Viewer Webinar

Footer

bVisual Profile

The UK-based independent Visio consultancy with a worldwide reach. We have over 25 years experience of providing data visualization solutions to companies around the globe.

Learn more about bVisual

  • Amazon
  • E-mail
  • Facebook
  • LinkedIn
  • Twitter
  • YouTube

Search this website

Recent posts

  • Introducing a free Visio Report Runner application
  • Protecting the integrity of custom Visio masters
  • Docked Stencils in Visio for the Web
  • My Visio Books and Old pre-C# Work
  • Migrating from Lucidchart to Visio?

Copyright © 2026 · Executive Pro on Genesis Framework · WordPress · Log in