I am upgrading this website at the moment, and I came across on old post of mine about a new video series that Microsoft launched in 2009 … yes, 10 years ago! So, I thought I wouldre-boot the series for all our enjoyment … and because almost all of the features are still present, with a new look, and some new features!
bVisual Blog by David Parker
Immersive Mixed Reality is coming to Visio
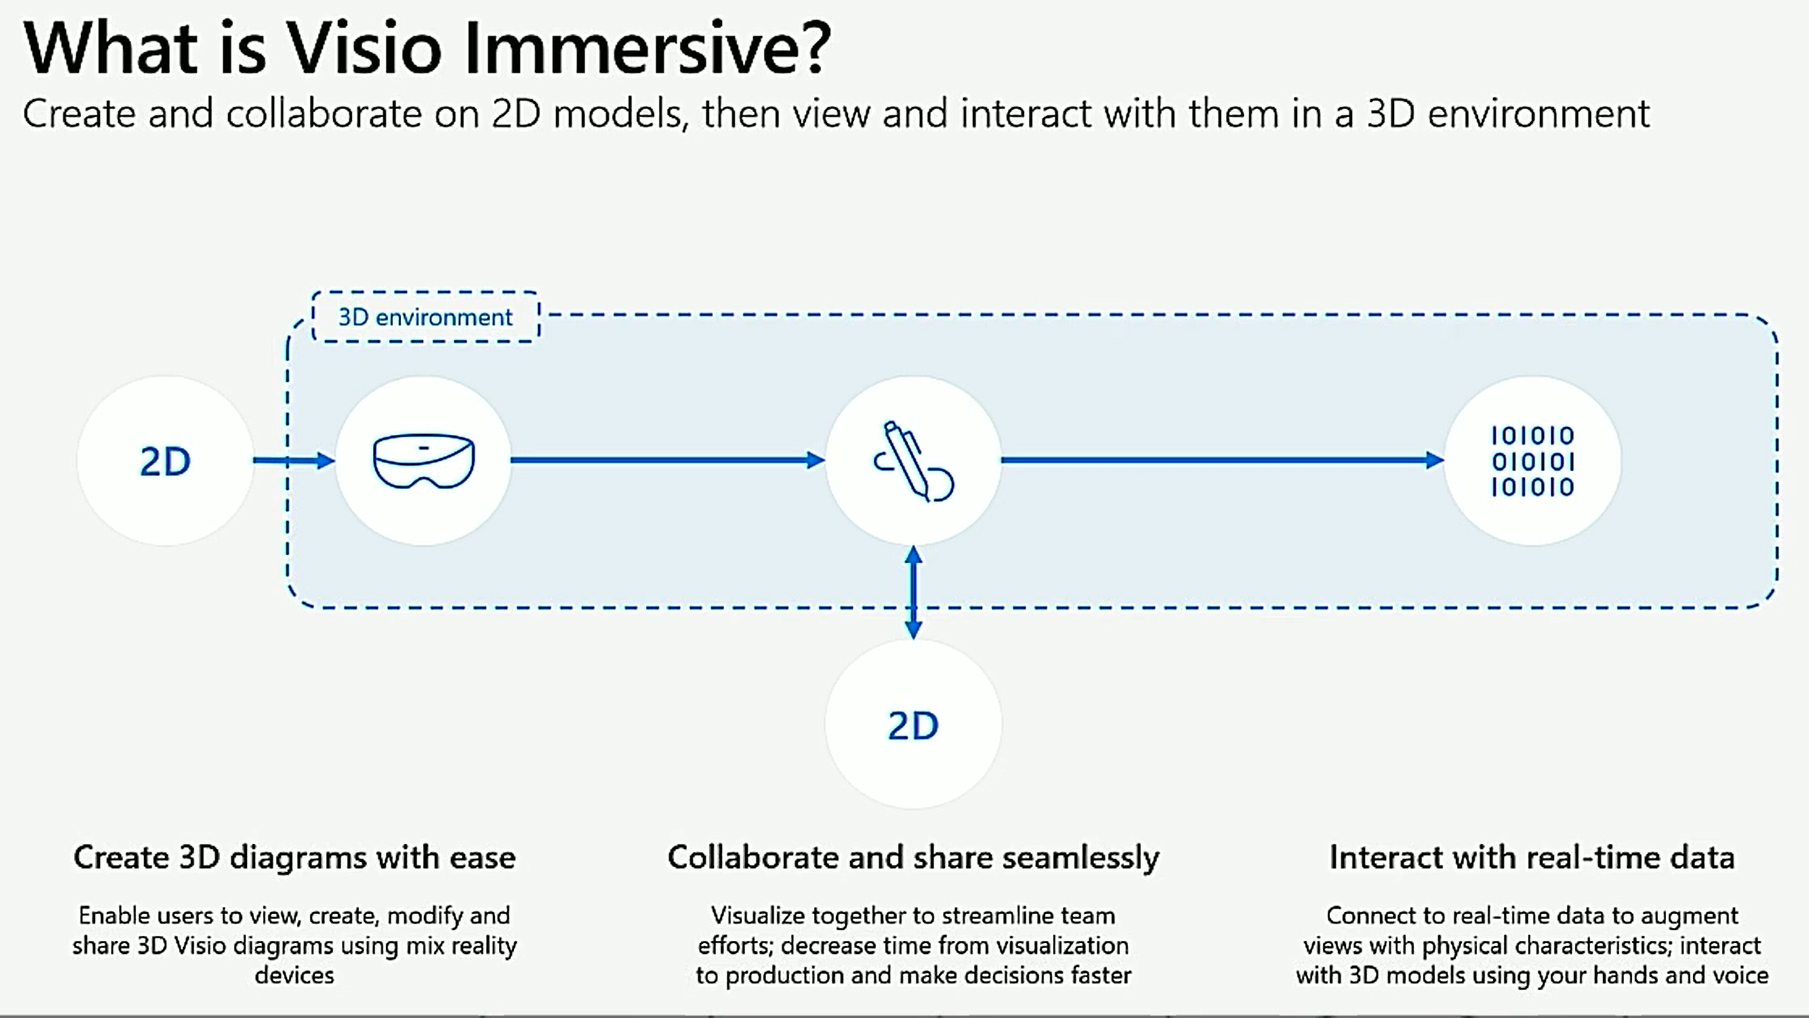
Visio Roadmap @ MSIgnite 2018
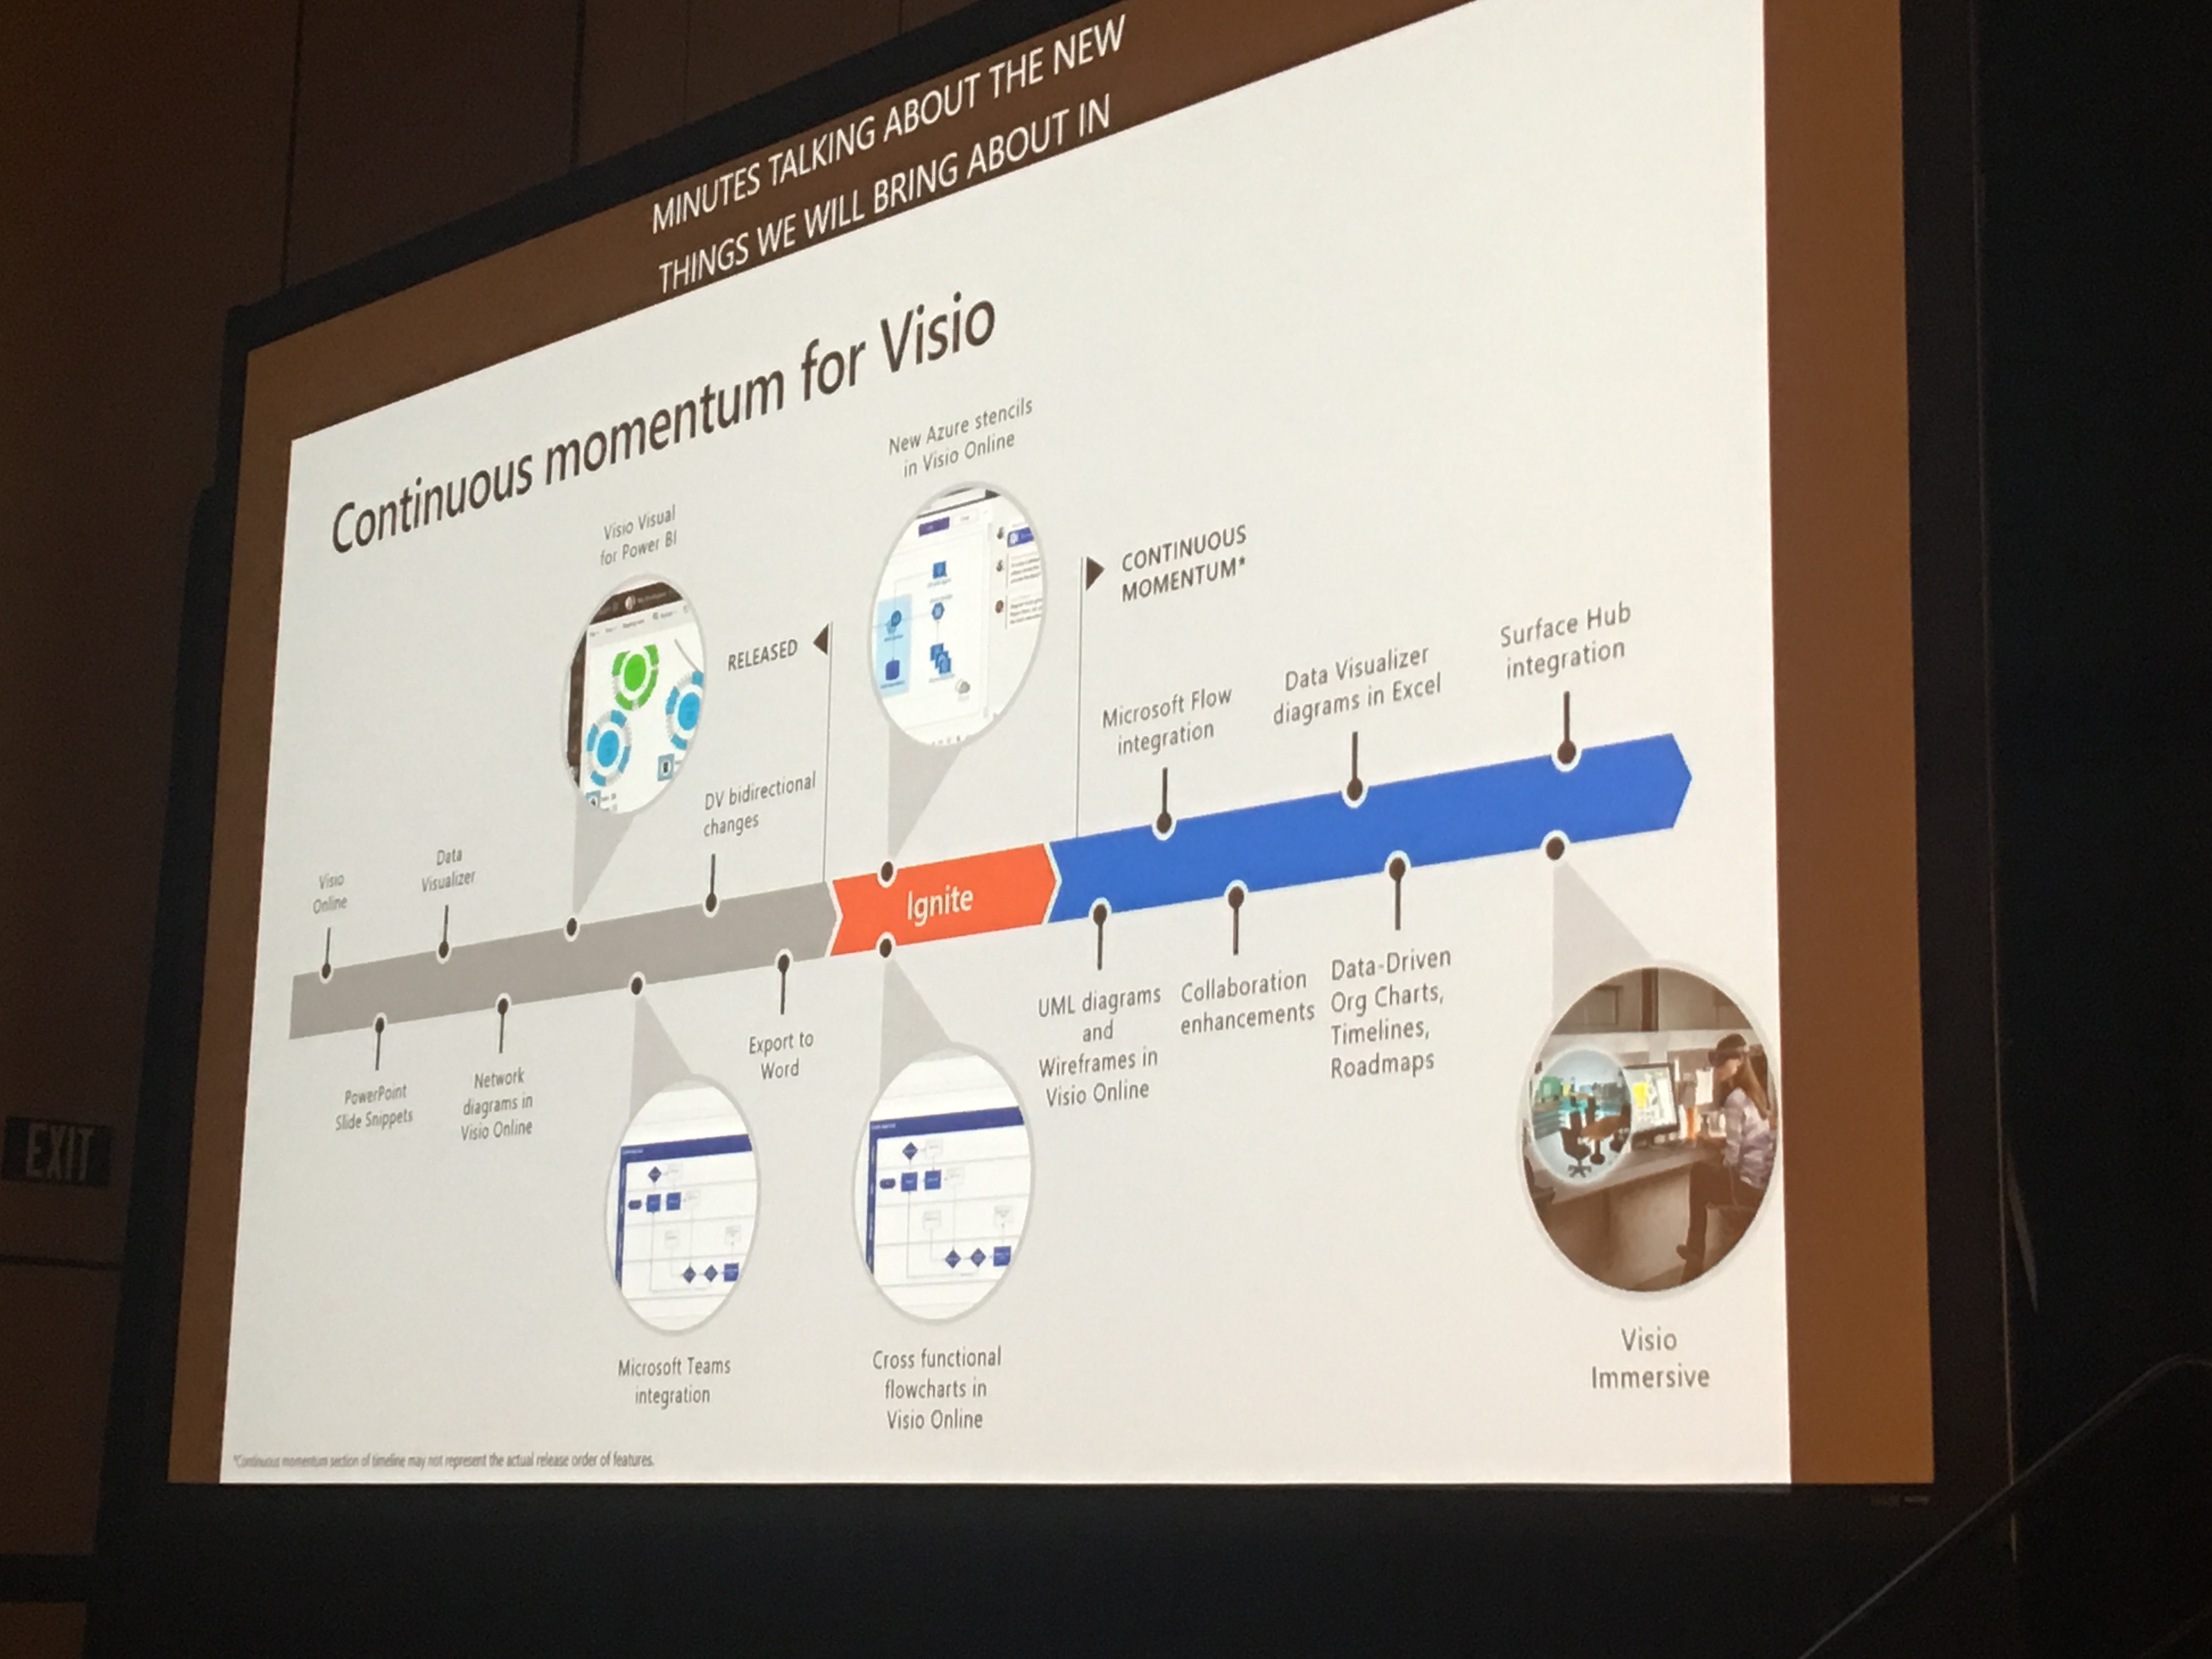
The first slot of the day at the furthest away room from the main conference area is not the ideal time to present anything, but those attendees that made it saw how many new features have been added to Visio recently, and what is soon to be added. The session recording should be available soon, but for those who can’t wait, here is a spoiler! ( View the session here )
Enhancing the Built-In Containers in Visio
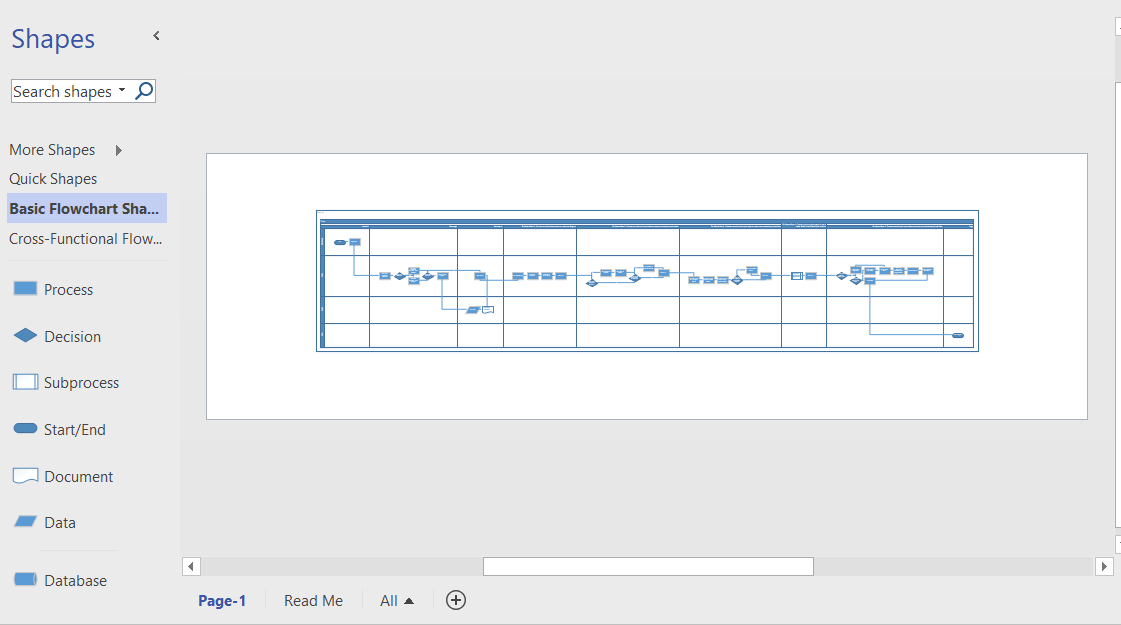
The concept of Structured Diagrams was introduced in Visio 2010 to provide core functionality for a variety of the templates in Visio, such as the Cross-Functional Flowchart, BPMN Diagram and Wireframe Diagram. This is primarily evident as Containers, Lists and Callouts and they can be customized (see Custom Containers, List and Callouts ), as shown in some of my previous articles ( see https://blog.bvisual.net/?s=container). One example of this extension can be found in all of the flowchart shapes that placed into a swimlane in a cross-functional flowchart. They have a Shape Data row, Function, that automatically inherits the text entered into the header of the swimlane. In another example, a Visio user can use Insert / Diagram Parts / Container to visually group other shapes together, and update the header text of the container. Well, I often do want my custom shapes to inherit the text of a container, so, in this article, I show how the built-in containers can be enhanced to provide this ability.
You should be aware that I often exploit the fact that Visio creates a local copy of each master shape that it uses within a document. This can be modified and set to match master by name on drop, to ensure that it is the one to use, even if the original Microsoft provided version is used. In this case, I use this trick to create hidden, enhanced versions of the containers that are available in the gallery of containers. Microsoft also do this with the Dynamic connector shape in a number of their own templates.
If you examine the Function Shape Data row of any of the flowchart shapes, then you will find the formula:
Data Visualizer for Visio Pro for Office 365 – Part 2
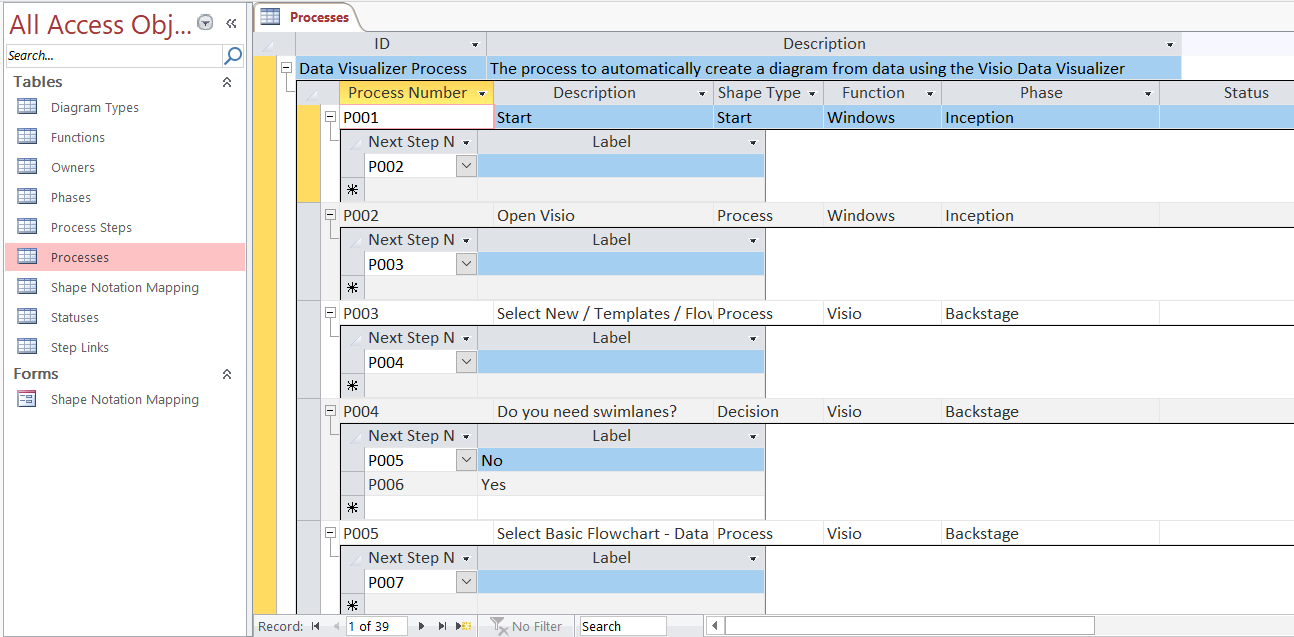
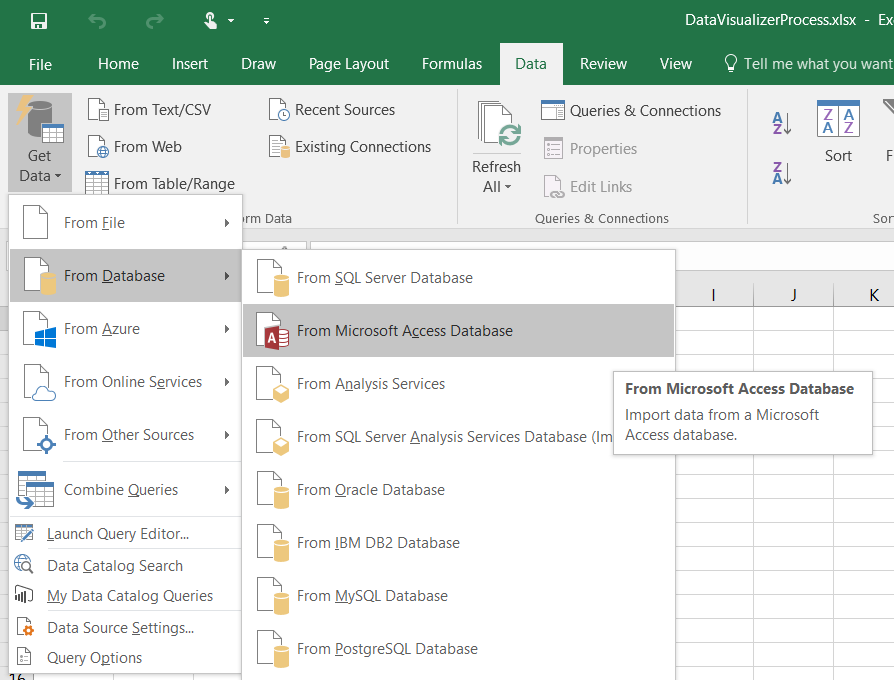
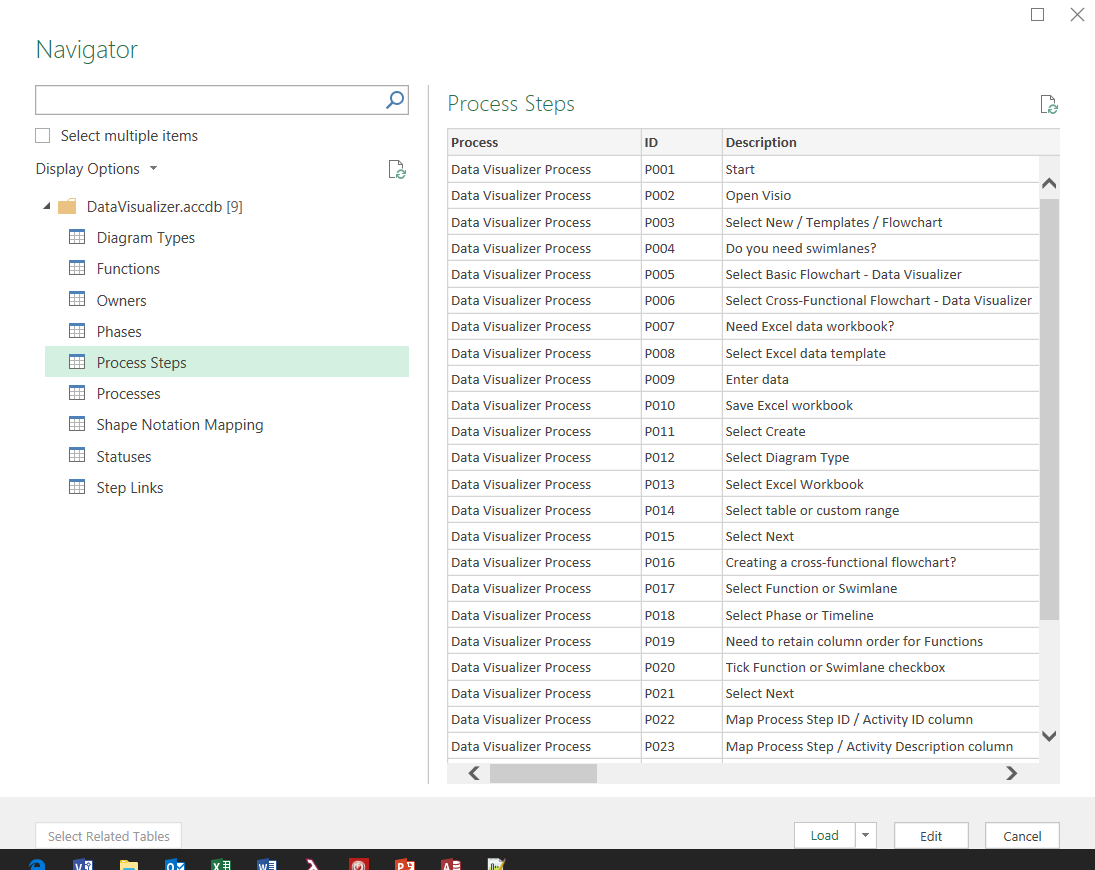
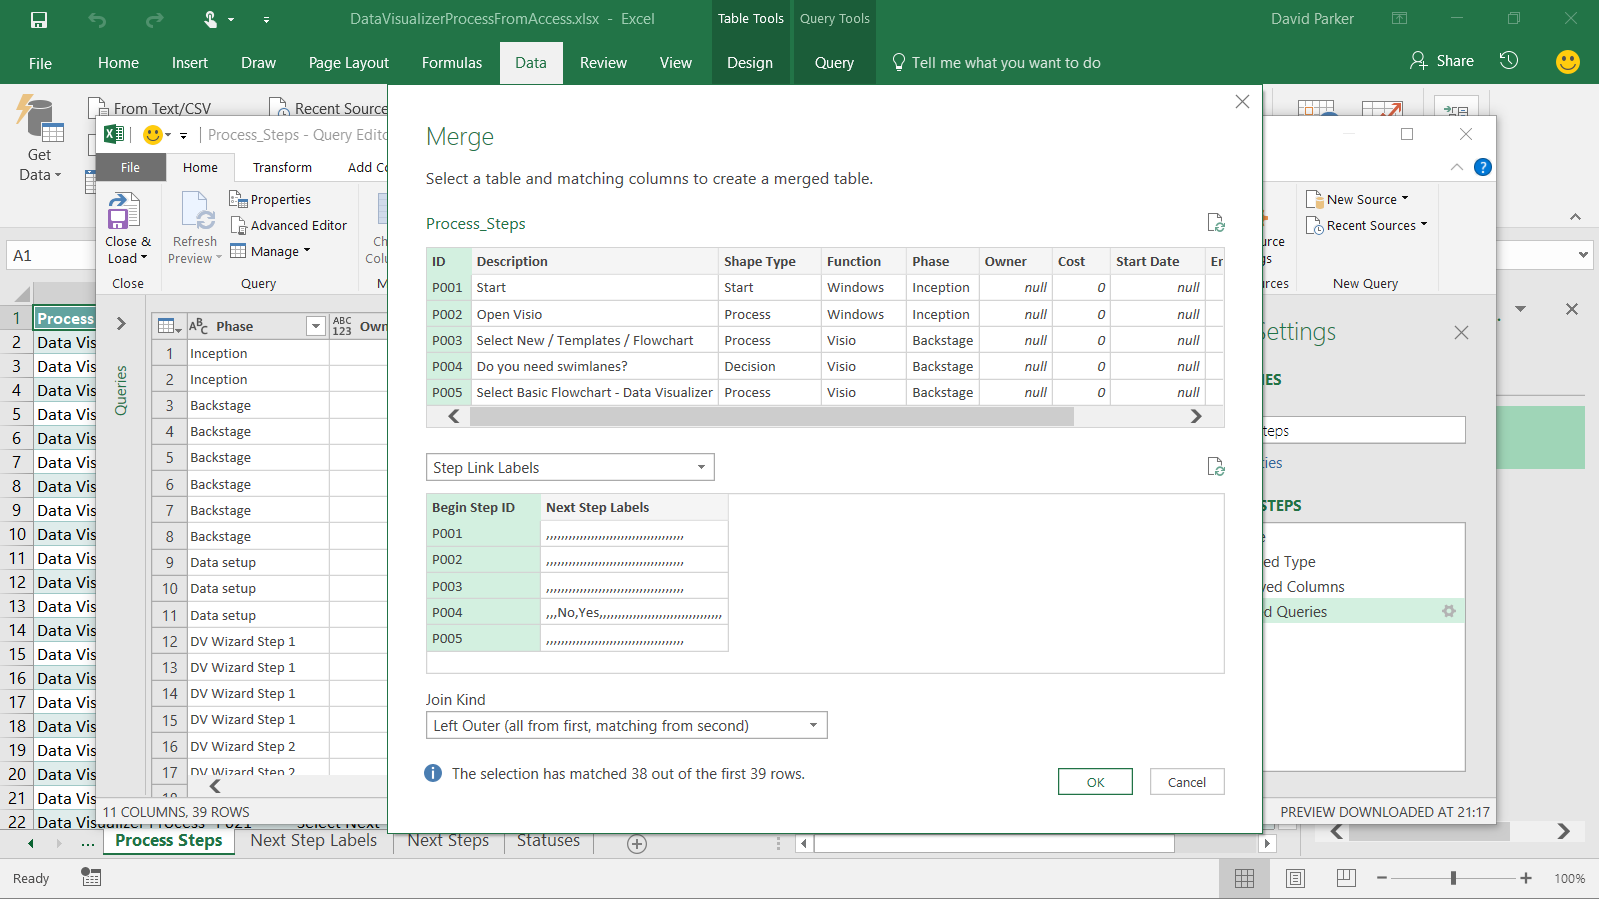
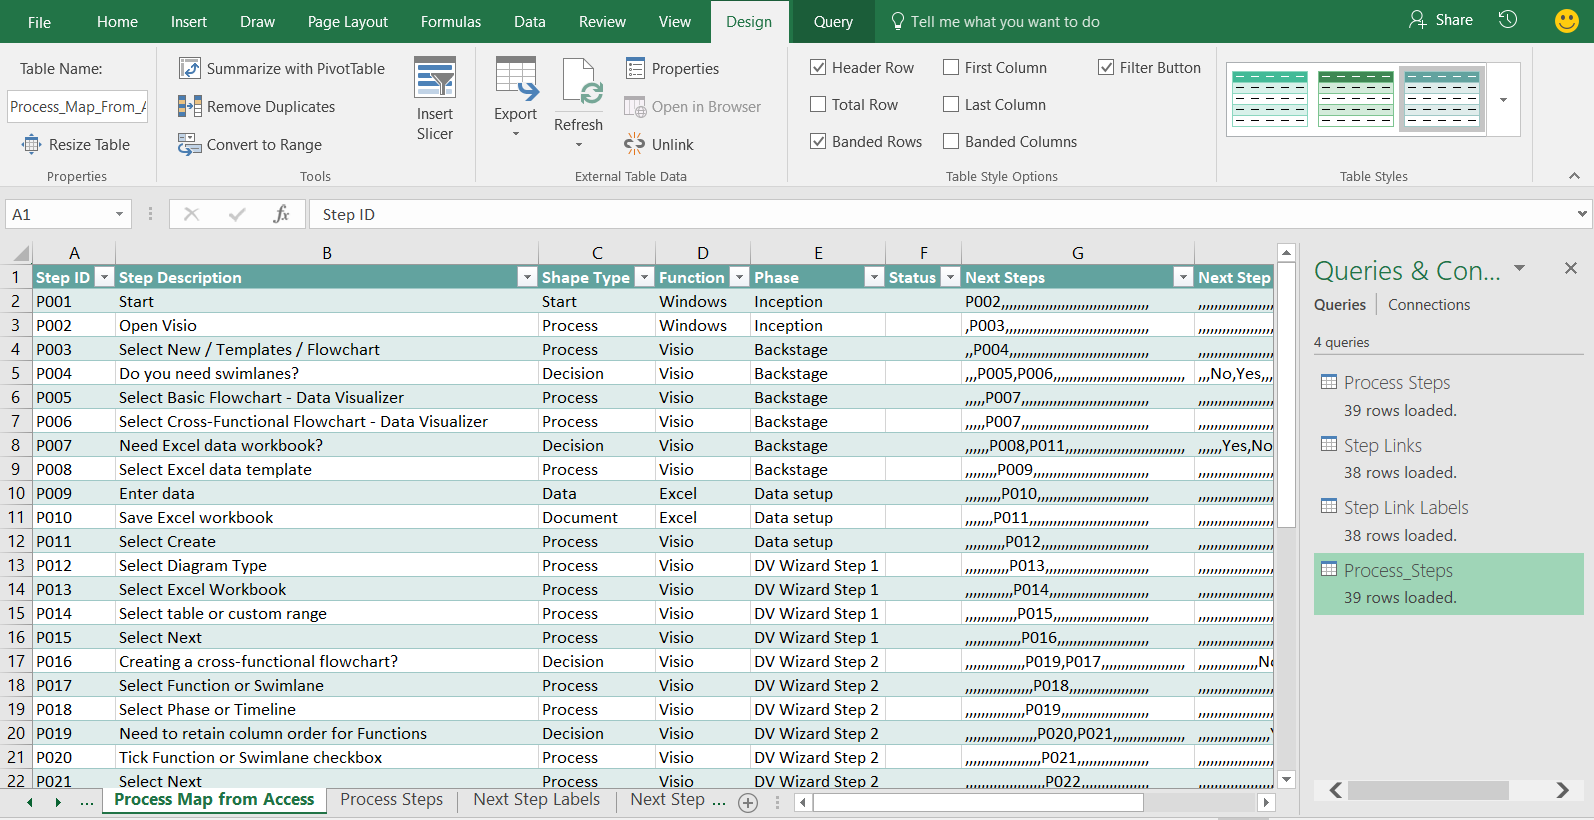
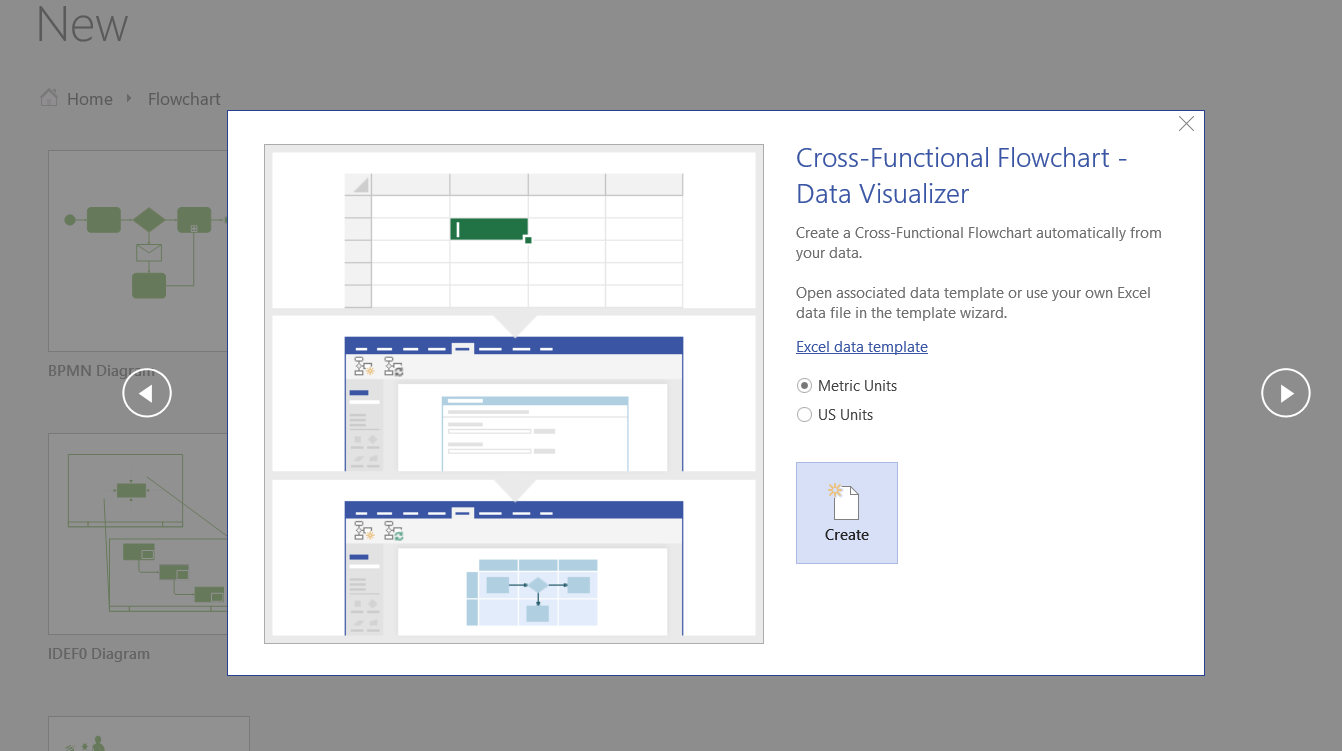
I walked though the steps to create a Cross-Functional flowchart automatically from an Excel table in my last article ( Data Visualizer for #Visio Pro for Office 365 – Part 1 ), but I often prefer to use a relational data source, such as Access or SQL Server, to store and organise my data. Therefore, I describe how Excel‘s Get Data (nee PowerQuery) can be used to merge together the data in a relational data source as a single table suitable for Data Visualizer in Visio Pro for Office 365.
[Read more…] about Data Visualizer for Visio Pro for Office 365 – Part 2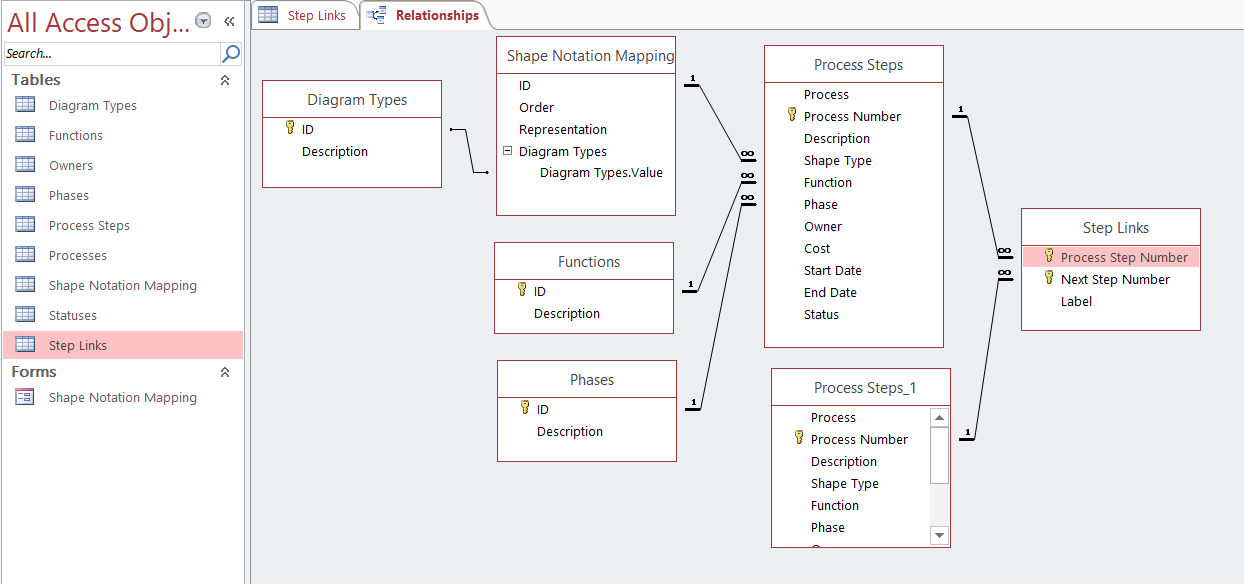
Managing People, Processes and Performance in PowerPoint? There is a better way!
I will be presenting a webcast on Thursday, March 23 | 12.00 to 13.00 (UTC) demonstrating how data-linked diagrams can provide a much more efficient and dynamic method for operational intelligence than PowerPoint.
Follow this link to register : http://bit.ly/2m2sPOv